Races in Glendale, Wisconsin (WI) Detailed Stats
Data:
Races - White alone (%)
Races - White alone (% change since 2000)
Races - Black alone (%)
Races - Black alone (% change since 2000)
Races - American Indian alone (%)
Races - American Indian alone (% change since 2000)
Races - Asian alone (%)
Races - Asian alone (% change since 2000)
Races - Hispanic (%)
Races - Hispanic (% change since 2000)
Races - Native Hawaiian and Other Pacific Islander alone (%)
Races - Native Hawaiian and Other Pacific Islander alone (% change since 2000)
Races - Two or more races(%)
Races - Two or more races(% change since 2000)
Races - Other race alone (%)
Races - Other race alone (% change since 2000)
Racial diversity
Place of birth - Born in state of residence (%)
Place of birth - Born in state of residence (%) - White
Place of birth - Born in state of residence (%) - Black or African American
Place of birth - Born in state of residence (%) - Asian
Place of birth - Born in state of residence (%) - Hispanic or Latino
Place of birth - Born in state of residence (%) - American Indian and Alaska Native
Place of birth - Born in state of residence (%) - Multirace
Place of birth - Born in state of residence (%) - Other Race
Place of birth - Born in other state (%)
Place of birth - Born in other state (%) - White
Place of birth - Born in other state (%) - Black or African American
Place of birth - Born in other state (%) - Asian
Place of birth - Born in other state (%) - Hispanic or Latino
Place of birth - Born in other state (%) - American Indian and Alaska Native
Place of birth - Born in other state (%) - Multirace
Place of birth - Born in other state (%) - Other Race
Place of birth - Native, outside of US (%)
Place of birth - Native, outside of US (%) - White
Place of birth - Native, outside of US (%) - Black or African American
Place of birth - Native, outside of US (%) - Asian
Place of birth - Native, outside of US (%) - Hispanic or Latino
Place of birth - Native, outside of US (%) - American Indian and Alaska Native
Place of birth - Native, outside of US (%) - Multirace
Place of birth - Native, outside of US (%) - Other Race
Place of birth - Foreign born (%)
Place of birth - Foreign born (%) - White
Place of birth - Foreign born (%) - Black or African American
Place of birth - Foreign born (%) - Asian
Place of birth - Foreign born (%) - Hispanic or Latino
Place of birth - Foreign born (%) - American Indian and Alaska Native
Place of birth - Foreign born (%) - Multirace
Place of birth - Foreign born (%) - Other Race
Residents speaking English at home (%)
Residents speaking English at home - Born in the United States (%)
Residents speaking English at home - Native, born elsewhere (%)
Residents speaking English at home - Foreign born (%)
Residents speaking Spanish at home (%)
Residents speaking Spanish at home - Born in the United States (%)
Residents speaking Spanish at home - Native, born elsewhere (%)
Residents speaking Spanish at home - Foreign born (%)
Residents speaking other language at home (%)
Residents speaking other language at home - Born in the United States (%)
Residents speaking other language at home - Native, born elsewhere (%)
Residents speaking other language at home - Foreign born (%)
Marital status - Never married (%)
Marital status - Now married (%)
Marital status - Separated (%)
Marital status - Widowed (%)
Marital status - Divorced (%)
Ancestries Reported - Arab (%)
Ancestries Reported - Czech (%)
Ancestries Reported - Danish (%)
Ancestries Reported - Dutch (%)
Ancestries Reported - English (%)
Ancestries Reported - French (%)
Ancestries Reported - French Canadian (%)
Ancestries Reported - German (%)
Ancestries Reported - Greek (%)
Ancestries Reported - Hungarian (%)
Ancestries Reported - Irish (%)
Ancestries Reported - Italian (%)
Ancestries Reported - Lithuanian (%)
Ancestries Reported - Norwegian (%)
Ancestries Reported - Polish (%)
Ancestries Reported - Portuguese (%)
Ancestries Reported - Russian (%)
Ancestries Reported - Scotch-Irish (%)
Ancestries Reported - Scottish (%)
Ancestries Reported - Slovak (%)
Ancestries Reported - Subsaharan African (%)
Ancestries Reported - Swedish (%)
Ancestries Reported - Swiss (%)
Ancestries Reported - Ukrainian (%)
Ancestries Reported - United States (%)
Ancestries Reported - Welsh (%)
Ancestries Reported - West Indian (%)
Ancestries Reported - Other (%)
Geographical mobility - Same house 1 year ago (%)
Geographical mobility - Same house 1 year ago (%) - White
Geographical mobility - Same house 1 year ago (%) - Black or African American
Geographical mobility - Same house 1 year ago (%) - Asian
Geographical mobility - Same house 1 year ago (%) - Hispanic or Latino
Geographical mobility - Same house 1 year ago (%) - American Indian and Alaska Native
Geographical mobility - Same house 1 year ago (%) - Multirace
Geographical mobility - Same house 1 year ago (%) - Other Race
Geographical mobility - Moved within same county (%)
Geographical mobility - Moved within same county (%) - White
Geographical mobility - Moved within same county (%) - Black or African American
Geographical mobility - Moved within same county (%) - Asian
Geographical mobility - Moved within same county (%) - Hispanic or Latino
Geographical mobility - Moved within same county (%) - American Indian and Alaska Native
Geographical mobility - Moved within same county (%) - Multirace
Geographical mobility - Moved within same county (%) - Other Race
Geographical mobility - Moved from different county within same state (%)
Geographical mobility - Moved from different county within same state (%) - White
Geographical mobility - Moved from different county within same state (%) - Black or African American
Geographical mobility - Moved from different county within same state (%) - Asian
Geographical mobility - Moved from different county within same state (%) - Hispanic or Latino
Geographical mobility - Moved from different county within same state (%) - American Indian and Alaska Native
Geographical mobility - Moved from different county within same state (%) - Multirace
Geographical mobility - Moved from different county within same state (%) - Other Race
Geographical mobility - Moved from different state (%)
Geographical mobility - Moved from different state (%) - White
Geographical mobility - Moved from different state (%) - Black or African American
Geographical mobility - Moved from different state (%) - Asian
Geographical mobility - Moved from different state (%) - Hispanic or Latino
Geographical mobility - Moved from different state (%) - American Indian and Alaska Native
Geographical mobility - Moved from different state (%) - Multirace
Geographical mobility - Moved from different state (%) - Other Race
Geographical mobility - Moved from abroad (%)
Geographical mobility - Moved from abroad (%) - White
Geographical mobility - Moved from abroad (%) - Black or African American
Geographical mobility - Moved from abroad (%) - Asian
Geographical mobility - Moved from abroad (%) - Hispanic or Latino
Geographical mobility - Moved from abroad (%) - American Indian and Alaska Native
Geographical mobility - Moved from abroad (%) - Multirace
Geographical mobility - Moved from abroad (%) - Other Race
Place of birth for the foreign-born population - Ireland (%)
Place of birth for the foreign-born population - Denmark (%)
Place of birth for the foreign-born population - Norway (%)
Place of birth for the foreign-born population - Sweden (%)
Place of birth for the foreign-born population - United Kingdom (%)
Place of birth for the foreign-born population - England (%)
Place of birth for the foreign-born population - Scotland (%)
Place of birth for the foreign-born population - Other Northern Europe (%)
Place of birth for the foreign-born population - Austria (%)
Place of birth for the foreign-born population - Belgium (%)
Place of birth for the foreign-born population - France (%)
Place of birth for the foreign-born population - Germany (%)
Place of birth for the foreign-born population - Netherlands (%)
Place of birth for the foreign-born population - Switzerland (%)
Place of birth for the foreign-born population - Other Western Europe (%)
Place of birth for the foreign-born population - Greece (%)
Place of birth for the foreign-born population - Italy (%)
Place of birth for the foreign-born population - Portugal (%)
Place of birth for the foreign-born population - Spain (%)
Place of birth for the foreign-born population - Other Southern Europe (%)
Place of birth for the foreign-born population - Albania (%)
Place of birth for the foreign-born population - Belarus (%)
Place of birth for the foreign-born population - Bosnia and Herzegovina (%)
Place of birth for the foreign-born population - Bulgaria (%)
Place of birth for the foreign-born population - Croatia (%)
Place of birth for the foreign-born population - Czechoslovakia (%)
Place of birth for the foreign-born population - Hungary (%)
Place of birth for the foreign-born population - Latvia (%)
Place of birth for the foreign-born population - Lithuania (%)
Place of birth for the foreign-born population - North Macedonia (Macedonia) (%)
Place of birth for the foreign-born population - Moldova (%)
Place of birth for the foreign-born population - Poland (%)
Place of birth for the foreign-born population - Romania (%)
Place of birth for the foreign-born population - Russia (%)
Place of birth for the foreign-born population - Serbia (%)
Place of birth for the foreign-born population - Ukraine (%)
Place of birth for the foreign-born population - Other Eastern Europe (%)
Place of birth for the foreign-born population - China (%)
Place of birth for the foreign-born population - Hong Kong (%)
Place of birth for the foreign-born population - Taiwan (%)
Place of birth for the foreign-born population - Japan (%)
Place of birth for the foreign-born population - Korea (%)
Place of birth for the foreign-born population - Other Eastern Asia (%)
Place of birth for the foreign-born population - Afghanistan (%)
Place of birth for the foreign-born population - Bangladesh (%)
Place of birth for the foreign-born population - India (%)
Place of birth for the foreign-born population - Iran (%)
Place of birth for the foreign-born population - Kazakhstan (%)
Place of birth for the foreign-born population - Nepal (%)
Place of birth for the foreign-born population - Pakistan (%)
Place of birth for the foreign-born population - Sri Lanka (%)
Place of birth for the foreign-born population - Uzbekistan (%)
Place of birth for the foreign-born population - Other South Central Asia (%)
Place of birth for the foreign-born population - Burma (%)
Place of birth for the foreign-born population - Cambodia (%)
Place of birth for the foreign-born population - Indonesia (%)
Place of birth for the foreign-born population - Laos (%)
Place of birth for the foreign-born population - Malaysia (%)
Place of birth for the foreign-born population - Philippines (%)
Place of birth for the foreign-born population - Singapore (%)
Place of birth for the foreign-born population - Thailand (%)
Place of birth for the foreign-born population - Vietnam (%)
Place of birth for the foreign-born population - Other South Eastern Asia (%)
Place of birth for the foreign-born population - Armenia (%)
Place of birth for the foreign-born population - Iraq (%)
Place of birth for the foreign-born population - Israel (%)
Place of birth for the foreign-born population - Jordan (%)
Place of birth for the foreign-born population - Kuwait (%)
Place of birth for the foreign-born population - Lebanon (%)
Place of birth for the foreign-born population - Saudi Arabia (%)
Place of birth for the foreign-born population - Syria (%)
Place of birth for the foreign-born population - Turkey (%)
Place of birth for the foreign-born population - Yemen (%)
Place of birth for the foreign-born population - Other Western Asia (%)
Place of birth for the foreign-born population - Eritrea (%)
Place of birth for the foreign-born population - Ethiopia (%)
Place of birth for the foreign-born population - Kenya (%)
Place of birth for the foreign-born population - Somalia (%)
Place of birth for the foreign-born population - Uganda (%)
Place of birth for the foreign-born population - Zimbabwe (%)
Place of birth for the foreign-born population - Other Eastern Africa (%)
Place of birth for the foreign-born population - Cameroon (%)
Place of birth for the foreign-born population - Congo (%)
Place of birth for the foreign-born population - Democratic Republic of Congo (Zaire) (%)
Place of birth for the foreign-born population - Other Middle Africa (%)
Place of birth for the foreign-born population - Egypt (%)
Place of birth for the foreign-born population - Morocco (%)
Place of birth for the foreign-born population - Sudan (%)
Place of birth for the foreign-born population - Other Northern Africa (%)
Place of birth for the foreign-born population - South Africa (%)
Place of birth for the foreign-born population - Other Southern Africa (%)
Place of birth for the foreign-born population - Cabo Verde (%)
Place of birth for the foreign-born population - Ghana (%)
Place of birth for the foreign-born population - Liberia (%)
Place of birth for the foreign-born population - Nigeria (%)
Place of birth for the foreign-born population - Senegal (%)
Place of birth for the foreign-born population - Sierra Leone (%)
Place of birth for the foreign-born population - Other Western Africa (%)
Place of birth for the foreign-born population - Australia (%)
Place of birth for the foreign-born population - New Zealand (%)
Place of birth for the foreign-born population - Fiji (%)
Place of birth for the foreign-born population - Micronesia (%)
Place of birth for the foreign-born population - Bahamas (%)
Place of birth for the foreign-born population - Barbados (%)
Place of birth for the foreign-born population - Cuba (%)
Place of birth for the foreign-born population - Dominica (%)
Place of birth for the foreign-born population - Dominican Republic (%)
Place of birth for the foreign-born population - Grenada (%)
Place of birth for the foreign-born population - Haiti (%)
Place of birth for the foreign-born population - Jamaica (%)
Place of birth for the foreign-born population - St. Vincent and the Grenadines (%)
Place of birth for the foreign-born population - Trinidad and Tobago (%)
Place of birth for the foreign-born population - West Indies (%)
Place of birth for the foreign-born population - Other Caribbean (%)
Place of birth for the foreign-born population - Belize (%)
Place of birth for the foreign-born population - Costa Rica (%)
Place of birth for the foreign-born population - El Salvador (%)
Place of birth for the foreign-born population - Guatemala (%)
Place of birth for the foreign-born population - Honduras (%)
Place of birth for the foreign-born population - Mexico (%)
Place of birth for the foreign-born population - Nicaragua (%)
Place of birth for the foreign-born population - Panama (%)
Place of birth for the foreign-born population - Other Central America (%)
Place of birth for the foreign-born population - Argentina (%)
Place of birth for the foreign-born population - Bolivia (%)
Place of birth for the foreign-born population - Brazil (%)
Place of birth for the foreign-born population - Chile (%)
Place of birth for the foreign-born population - Colombia (%)
Place of birth for the foreign-born population - Ecuador (%)
Place of birth for the foreign-born population - Guyana (%)
Place of birth for the foreign-born population - Peru (%)
Place of birth for the foreign-born population - Uruguay (%)
Place of birth for the foreign-born population - Venezuela (%)
Place of birth for the foreign-born population - Other South America (%)
Place of birth for the foreign-born population - Canada (%)
Place of birth for the foreign-born population - Other Northern America (%)
Place of birth for the foreign-born population - Other (%)
Latest news about races in Glendale, WI collected exclusively by city-data.com from local newspapers, TV, and radio stations
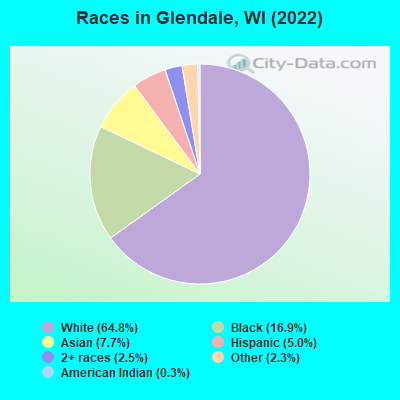
According to 2022 data, the most numerous races in Glendale, WI are White alone (8,443 residents), Hispanic (645 residents), and Black alone (2,207 residents). 85.4% of Glendale residents speak English at home. 11.5% of Glendale, WI residents are foreign-born (6.8% born in Asia, 3.0% born in Europe), which is 56.4% greater than the foreign-born rate of 5.0% across the entire state of Wisconsin.
Race distribution in Glendale
2000 2022
4,681,630 87.3% White alone 300,245 5.6% Black alone 192,921 3.6% Hispanic 87,995 1.6% Asian alone 51,921 1.0% Two or more races 43,980 0.8% American Indian alone 3,637 0.07% Other race alone 1,346 0.03% Native Hawaiian and Other
4,654,031 79.0% White alone 447,022 7.6% Hispanic 345,678 5.9% Black alone 217,532 3.7% Two or more races 172,242 2.9% Asian alone 33,762 0.6% American Indian alone 19,680 0.3% Other race alone 2,592 0.04% Native Hawaiian and Other
Income and house value in Glendale Median household income in 2022 $88,359 White non-Hispanic householders$42,643 Black householders$82,421 Asian householders$154,354 Hispanic or Latino race householdersMedian 2022 house value $281,298 White Non-Hispanic householders$306,980 Black or African American householders $423,043 Asian householders$137,165 Some other race householders$305,785 Two or more races householders$251,038 Hispanic or Latino householders
Median age by race in Glendale
48.3 Median age for White residents47.6 50.9 39.2 Median age for Black or African American residents33.0 47.2 -699,907,663.2 Median age for American Indian / Alaska Native residents-833,824,974.6 -627,763,040.9 40.6 Median age for Asian residents45.1 40.2 -825,688,072.6 Median age for Native Hawaiian / Pacific Islander residents-862,745,097.2 -732,444,443.7 70.8 Median age for Other race residents70.6 70.5 18.1 Median age for Two or more races residents8.6 17.9 48.1 Median age for White alone residents47.0 49.9 34.7 Median age for Hispanic or Latino residents31.1 36.1
Owner/renter occupied households by race in Glendale
House owners and renters - White residents 3,126 77.4% Owner occupied912 22.6% Renter occupiedHouse owners and renters - Black or African American residents 308 32.1% Owner occupied652 67.9% Renter occupiedHouse owners and renters - American Indian / Alaska Native residents 16 100.0% Renter occupiedHouse owners and renters - Asian residents 171 56.8% Owner occupied131 43.2% Renter occupiedHouse owners and renters - Other race residents 169 87.8% Owner occupied23 12.2% Renter occupiedHouse owners and renters - Two or more races residents 40 34.3% Owner occupied77 65.7% Renter occupiedHouse owners and renters - White alone residents 3,177 77.7% Owner occupied909 22.3% Renter occupiedHouse owners and renters - Hispanic or Latino residents 151 61.9% Owner occupied93 38.1% Renter occupied
Language usage in Glendale
English speakers - Total 85.4% of residents of Glendale speak English at home.
2.5% of residents speak Spanish at home 291 93.3% Speak English very well21 6.7% Speak English less than very well12.1% of residents speak other language at home 852 56.8% Speak English very well649 43.2% Speak English less than very well
English speakers - Born in the United States 93.7% of residents of Glendale speak English at home.
1.1% of residents speak Spanish at home 23 63.9% Speak English very well13 36.1% Speak English less than very well5.1% of residents speak other language at home 135 81.8% Speak English very well30 18.2% Speak English less than very well
English speakers - Native, born elsewhere 94.9% of residents of Glendale speak English at home.
11.9% of residents speak Spanish at home 7 100.0% Speak English very well
English speakers - Foreign-born 17.8% of residents of Glendale speak English at home.
2.3% of residents speak Spanish at home 28 80.0% Speak English very well7 20.0% Speak English less than very well78.6% of residents speak other language at home 649 53.8% Speak English very well558 46.2% Speak English less than very well
White (Caucasian) - Speak only English Native:
98.2% (7,481)Foreign-born:
31.6% (110)
White (Caucasian) - Speak another language Native:
2.6% (197)Foreign-born:
69.3% (241)
Black or African American - Speak only English Native:
96.7% (1,898)Foreign-born:
17.4% (20)
Black or African American - Speak another language Native:
2.4% (47)Foreign-born:
84.1% (97)
Asian - Speak only English Native:
23.9% (45)Foreign-born:
9.1% (66)
Asian - Speak another language Native:
77.5% (146)Foreign-born:
91.2% (660)
Other race - Speak only English Native:
100.0% (240)Foreign-born:
100.0% (35)
Other race - Speak another language Native:
1.3% (3)Foreign-born:
32.6% (11)
Two or more races - Speak another language Native:
12.2% (66)Foreign-born:
100.0% (77)
White alone - Speak only English Native:
97.5% (7,469)Foreign-born:
22.8% (117)
White alone - Speak another language Native:
2.5% (193)Foreign-born:
77.8% (398)
Hispanic or Latino - Speak only English Native:
77.6% (407)Foreign-born:
50.8% (45)
Hispanic or Latino - Speak another language Native:
23.5% (123)Foreign-born:
54.9% (49)
Foreign-born residents in Glendale 1,494 residents are foreign born (6.8% Asia , 3.0% Europe ).
This city:
11.5%Wisconsin:
5.0%
Marital status for residents in Glendale Marital status - White (Caucasian) population 15 years and over
Males 31.6% Never married55.2% Now married0.0% Separated5.5% Widowed7.7% DivorcedFemales 28.3% Never married43.8% Now married0.4% Separated9.5% Widowed18.0% DivorcedWomen who gave birth in the past 12 months Now married:
90.7% (108)Unmarried:
9.3% (11)
Women who did not give birth in the past 12 months Now married:
42.7% (662)Unmarried:
57.3% (890)
Marital status - Black or African American population 15 years and over
Males 41.2% Never married41.7% Now married3.2% Separated3.6% Widowed10.3% DivorcedFemales 50.7% Never married24.5% Now married0.7% Separated8.5% Widowed15.6% DivorcedWomen who did not give birth in the past 12 months Now married:
25.1% (134)Unmarried:
74.9% (399)
Marital status - American Indian / Alaska Native population 15 years and over
Males 100.0% Never married0.0% Now married0.0% Separated0.0% Widowed0.0% DivorcedFemales 0.0% Never married0.0% Now married0.0% Separated0.0% Widowed100.0% DivorcedMarital status - Asian population 15 years and over
Males 15.7% Never married84.3% Now married0.0% Separated0.0% Widowed0.0% DivorcedFemales 13.7% Never married82.5% Now married0.0% Separated0.0% Widowed3.8% DivorcedWomen who did not give birth in the past 12 months Now married:
73.5% (164)Unmarried:
26.5% (59)
Marital status - Other race population 15 years and over
Males 87.8% Never married12.2% Now married0.0% Separated0.0% Widowed0.0% DivorcedFemales 48.2% Never married51.8% Now married0.0% Separated0.0% Widowed0.0% DivorcedWomen who gave birth in the past 12 months Now married:
100.0% (1)Unmarried:
0.0% (0)
Women who did not give birth in the past 12 months Now married:
66.7% (12)Unmarried:
33.3% (6)
Marital status - Two or more races population 15 years and over
Males 73.0% Never married27.0% Now married0.0% Separated0.0% Widowed0.0% DivorcedFemales 55.3% Never married27.4% Now married4.1% Separated10.5% Widowed2.7% DivorcedWomen who did not give birth in the past 12 months Now married:
31.0% (93)Unmarried:
69.0% (206)
Marital status - White alone, not Hispanic / Latino population 15 years and over
Males 30.1% Never married56.3% Now married0.0% Separated5.7% Widowed8.0% DivorcedFemales 27.6% Never married44.3% Now married0.4% Separated9.6% Widowed18.0% DivorcedWomen who gave birth in the past 12 months Now married:
90.7% (114)Unmarried:
9.3% (12)
Women who did not give birth in the past 12 months Now married:
43.6% (691)Unmarried:
56.4% (893)
Marital status - Hispanic or Latino population 15 years and over
Males 81.6% Never married18.4% Now married0.0% Separated0.0% Widowed0.0% DivorcedFemales 39.3% Never married52.8% Now married2.5% Separated0.0% Widowed5.4% DivorcedWomen who did not give birth in the past 12 months Now married:
33.9% (67)Unmarried:
66.1% (131)
Ancestries in Glendale
1,091 16.2% German223 3.3% Russian207 3.1% Italian201 3.0% European199 3.0% American197 2.9% Polish183 2.7% English106 1.6% Ukrainian103 1.5% Irish44 0.7% Croatian41 0.6% Eastern European32 0.5% Scottish31 0.5% Norwegian29 0.4% Swedish26 0.4% Dutch19 0.3% African19 0.3% Slovak19 0.3% Danish18 0.3% Somali16 0.2% Czech13 0.2% Jamaican13 0.2% Iraqi12 0.2% Scotch-Irish11 0.2% Israeli11 0.2% Serbian10 0.1% Swiss10 0.1% Latvian9 0.1% Belgian8 0.1% Austrian7 0.1% Hungarian7 0.1% Romanian7 0.1% French6 0.09% Greek6 0.09% Welsh6 0.09% Alsatian5 0.07% Northern European5 0.07% Slovene5 0.07% British2 0.03% Nigerian1 0.01% Czechoslovakian
Children Nativity (place of birth) in Glendale
Children under 6 years - Living with two parents Both parents native 429 100.0% NativeBoth parents foreign-born 82 100.0% NativeOne native, one foreign-born parent 90 100.0% NativeChildren under 6 years - Living with one parent Native parent 100 100.0% NativeForeign-born parent 19 100.0% NativeChildren 6 to 17 years - Living with two parents Both parents native 1,081 100.0% NativeBoth parents foreign-born 47 78.4% Native13 21.6% Foreign-bornOne native, one foreign-born parent 38 100.0% NativeChildren 6 to 17 years - Living with one parent Native parent 539 100.0% NativeForeign-born parent 35 48.9% Native37 51.1% Foreign-born