Races in Fort Worth, Texas (TX) Detailed Stats
Data:
Races - White alone (%)
Races - White alone (% change since 2000)
Races - Black alone (%)
Races - Black alone (% change since 2000)
Races - American Indian alone (%)
Races - American Indian alone (% change since 2000)
Races - Asian alone (%)
Races - Asian alone (% change since 2000)
Races - Hispanic (%)
Races - Hispanic (% change since 2000)
Races - Native Hawaiian and Other Pacific Islander alone (%)
Races - Native Hawaiian and Other Pacific Islander alone (% change since 2000)
Races - Two or more races(%)
Races - Two or more races(% change since 2000)
Races - Other race alone (%)
Races - Other race alone (% change since 2000)
Racial diversity
Place of birth - Born in state of residence (%)
Place of birth - Born in state of residence (%) - White
Place of birth - Born in state of residence (%) - Black or African American
Place of birth - Born in state of residence (%) - Asian
Place of birth - Born in state of residence (%) - Hispanic or Latino
Place of birth - Born in state of residence (%) - American Indian and Alaska Native
Place of birth - Born in state of residence (%) - Multirace
Place of birth - Born in state of residence (%) - Other Race
Place of birth - Born in other state (%)
Place of birth - Born in other state (%) - White
Place of birth - Born in other state (%) - Black or African American
Place of birth - Born in other state (%) - Asian
Place of birth - Born in other state (%) - Hispanic or Latino
Place of birth - Born in other state (%) - American Indian and Alaska Native
Place of birth - Born in other state (%) - Multirace
Place of birth - Born in other state (%) - Other Race
Place of birth - Native, outside of US (%)
Place of birth - Native, outside of US (%) - White
Place of birth - Native, outside of US (%) - Black or African American
Place of birth - Native, outside of US (%) - Asian
Place of birth - Native, outside of US (%) - Hispanic or Latino
Place of birth - Native, outside of US (%) - American Indian and Alaska Native
Place of birth - Native, outside of US (%) - Multirace
Place of birth - Native, outside of US (%) - Other Race
Place of birth - Foreign born (%)
Place of birth - Foreign born (%) - White
Place of birth - Foreign born (%) - Black or African American
Place of birth - Foreign born (%) - Asian
Place of birth - Foreign born (%) - Hispanic or Latino
Place of birth - Foreign born (%) - American Indian and Alaska Native
Place of birth - Foreign born (%) - Multirace
Place of birth - Foreign born (%) - Other Race
Residents speaking English at home (%)
Residents speaking English at home - Born in the United States (%)
Residents speaking English at home - Native, born elsewhere (%)
Residents speaking English at home - Foreign born (%)
Residents speaking Spanish at home (%)
Residents speaking Spanish at home - Born in the United States (%)
Residents speaking Spanish at home - Native, born elsewhere (%)
Residents speaking Spanish at home - Foreign born (%)
Residents speaking other language at home (%)
Residents speaking other language at home - Born in the United States (%)
Residents speaking other language at home - Native, born elsewhere (%)
Residents speaking other language at home - Foreign born (%)
Marital status - Never married (%)
Marital status - Now married (%)
Marital status - Separated (%)
Marital status - Widowed (%)
Marital status - Divorced (%)
Ancestries Reported - Arab (%)
Ancestries Reported - Czech (%)
Ancestries Reported - Danish (%)
Ancestries Reported - Dutch (%)
Ancestries Reported - English (%)
Ancestries Reported - French (%)
Ancestries Reported - French Canadian (%)
Ancestries Reported - German (%)
Ancestries Reported - Greek (%)
Ancestries Reported - Hungarian (%)
Ancestries Reported - Irish (%)
Ancestries Reported - Italian (%)
Ancestries Reported - Lithuanian (%)
Ancestries Reported - Norwegian (%)
Ancestries Reported - Polish (%)
Ancestries Reported - Portuguese (%)
Ancestries Reported - Russian (%)
Ancestries Reported - Scotch-Irish (%)
Ancestries Reported - Scottish (%)
Ancestries Reported - Slovak (%)
Ancestries Reported - Subsaharan African (%)
Ancestries Reported - Swedish (%)
Ancestries Reported - Swiss (%)
Ancestries Reported - Ukrainian (%)
Ancestries Reported - United States (%)
Ancestries Reported - Welsh (%)
Ancestries Reported - West Indian (%)
Ancestries Reported - Other (%)
Geographical mobility - Same house 1 year ago (%)
Geographical mobility - Same house 1 year ago (%) - White
Geographical mobility - Same house 1 year ago (%) - Black or African American
Geographical mobility - Same house 1 year ago (%) - Asian
Geographical mobility - Same house 1 year ago (%) - Hispanic or Latino
Geographical mobility - Same house 1 year ago (%) - American Indian and Alaska Native
Geographical mobility - Same house 1 year ago (%) - Multirace
Geographical mobility - Same house 1 year ago (%) - Other Race
Geographical mobility - Moved within same county (%)
Geographical mobility - Moved within same county (%) - White
Geographical mobility - Moved within same county (%) - Black or African American
Geographical mobility - Moved within same county (%) - Asian
Geographical mobility - Moved within same county (%) - Hispanic or Latino
Geographical mobility - Moved within same county (%) - American Indian and Alaska Native
Geographical mobility - Moved within same county (%) - Multirace
Geographical mobility - Moved within same county (%) - Other Race
Geographical mobility - Moved from different county within same state (%)
Geographical mobility - Moved from different county within same state (%) - White
Geographical mobility - Moved from different county within same state (%) - Black or African American
Geographical mobility - Moved from different county within same state (%) - Asian
Geographical mobility - Moved from different county within same state (%) - Hispanic or Latino
Geographical mobility - Moved from different county within same state (%) - American Indian and Alaska Native
Geographical mobility - Moved from different county within same state (%) - Multirace
Geographical mobility - Moved from different county within same state (%) - Other Race
Geographical mobility - Moved from different state (%)
Geographical mobility - Moved from different state (%) - White
Geographical mobility - Moved from different state (%) - Black or African American
Geographical mobility - Moved from different state (%) - Asian
Geographical mobility - Moved from different state (%) - Hispanic or Latino
Geographical mobility - Moved from different state (%) - American Indian and Alaska Native
Geographical mobility - Moved from different state (%) - Multirace
Geographical mobility - Moved from different state (%) - Other Race
Geographical mobility - Moved from abroad (%)
Geographical mobility - Moved from abroad (%) - White
Geographical mobility - Moved from abroad (%) - Black or African American
Geographical mobility - Moved from abroad (%) - Asian
Geographical mobility - Moved from abroad (%) - Hispanic or Latino
Geographical mobility - Moved from abroad (%) - American Indian and Alaska Native
Geographical mobility - Moved from abroad (%) - Multirace
Geographical mobility - Moved from abroad (%) - Other Race
Place of birth for the foreign-born population - Ireland (%)
Place of birth for the foreign-born population - Denmark (%)
Place of birth for the foreign-born population - Norway (%)
Place of birth for the foreign-born population - Sweden (%)
Place of birth for the foreign-born population - United Kingdom (%)
Place of birth for the foreign-born population - England (%)
Place of birth for the foreign-born population - Scotland (%)
Place of birth for the foreign-born population - Other Northern Europe (%)
Place of birth for the foreign-born population - Austria (%)
Place of birth for the foreign-born population - Belgium (%)
Place of birth for the foreign-born population - France (%)
Place of birth for the foreign-born population - Germany (%)
Place of birth for the foreign-born population - Netherlands (%)
Place of birth for the foreign-born population - Switzerland (%)
Place of birth for the foreign-born population - Other Western Europe (%)
Place of birth for the foreign-born population - Greece (%)
Place of birth for the foreign-born population - Italy (%)
Place of birth for the foreign-born population - Portugal (%)
Place of birth for the foreign-born population - Spain (%)
Place of birth for the foreign-born population - Other Southern Europe (%)
Place of birth for the foreign-born population - Albania (%)
Place of birth for the foreign-born population - Belarus (%)
Place of birth for the foreign-born population - Bosnia and Herzegovina (%)
Place of birth for the foreign-born population - Bulgaria (%)
Place of birth for the foreign-born population - Croatia (%)
Place of birth for the foreign-born population - Czechoslovakia (%)
Place of birth for the foreign-born population - Hungary (%)
Place of birth for the foreign-born population - Latvia (%)
Place of birth for the foreign-born population - Lithuania (%)
Place of birth for the foreign-born population - North Macedonia (Macedonia) (%)
Place of birth for the foreign-born population - Moldova (%)
Place of birth for the foreign-born population - Poland (%)
Place of birth for the foreign-born population - Romania (%)
Place of birth for the foreign-born population - Russia (%)
Place of birth for the foreign-born population - Serbia (%)
Place of birth for the foreign-born population - Ukraine (%)
Place of birth for the foreign-born population - Other Eastern Europe (%)
Place of birth for the foreign-born population - China (%)
Place of birth for the foreign-born population - Hong Kong (%)
Place of birth for the foreign-born population - Taiwan (%)
Place of birth for the foreign-born population - Japan (%)
Place of birth for the foreign-born population - Korea (%)
Place of birth for the foreign-born population - Other Eastern Asia (%)
Place of birth for the foreign-born population - Afghanistan (%)
Place of birth for the foreign-born population - Bangladesh (%)
Place of birth for the foreign-born population - India (%)
Place of birth for the foreign-born population - Iran (%)
Place of birth for the foreign-born population - Kazakhstan (%)
Place of birth for the foreign-born population - Nepal (%)
Place of birth for the foreign-born population - Pakistan (%)
Place of birth for the foreign-born population - Sri Lanka (%)
Place of birth for the foreign-born population - Uzbekistan (%)
Place of birth for the foreign-born population - Other South Central Asia (%)
Place of birth for the foreign-born population - Burma (%)
Place of birth for the foreign-born population - Cambodia (%)
Place of birth for the foreign-born population - Indonesia (%)
Place of birth for the foreign-born population - Laos (%)
Place of birth for the foreign-born population - Malaysia (%)
Place of birth for the foreign-born population - Philippines (%)
Place of birth for the foreign-born population - Singapore (%)
Place of birth for the foreign-born population - Thailand (%)
Place of birth for the foreign-born population - Vietnam (%)
Place of birth for the foreign-born population - Other South Eastern Asia (%)
Place of birth for the foreign-born population - Armenia (%)
Place of birth for the foreign-born population - Iraq (%)
Place of birth for the foreign-born population - Israel (%)
Place of birth for the foreign-born population - Jordan (%)
Place of birth for the foreign-born population - Kuwait (%)
Place of birth for the foreign-born population - Lebanon (%)
Place of birth for the foreign-born population - Saudi Arabia (%)
Place of birth for the foreign-born population - Syria (%)
Place of birth for the foreign-born population - Turkey (%)
Place of birth for the foreign-born population - Yemen (%)
Place of birth for the foreign-born population - Other Western Asia (%)
Place of birth for the foreign-born population - Eritrea (%)
Place of birth for the foreign-born population - Ethiopia (%)
Place of birth for the foreign-born population - Kenya (%)
Place of birth for the foreign-born population - Somalia (%)
Place of birth for the foreign-born population - Uganda (%)
Place of birth for the foreign-born population - Zimbabwe (%)
Place of birth for the foreign-born population - Other Eastern Africa (%)
Place of birth for the foreign-born population - Cameroon (%)
Place of birth for the foreign-born population - Congo (%)
Place of birth for the foreign-born population - Democratic Republic of Congo (Zaire) (%)
Place of birth for the foreign-born population - Other Middle Africa (%)
Place of birth for the foreign-born population - Egypt (%)
Place of birth for the foreign-born population - Morocco (%)
Place of birth for the foreign-born population - Sudan (%)
Place of birth for the foreign-born population - Other Northern Africa (%)
Place of birth for the foreign-born population - South Africa (%)
Place of birth for the foreign-born population - Other Southern Africa (%)
Place of birth for the foreign-born population - Cabo Verde (%)
Place of birth for the foreign-born population - Ghana (%)
Place of birth for the foreign-born population - Liberia (%)
Place of birth for the foreign-born population - Nigeria (%)
Place of birth for the foreign-born population - Senegal (%)
Place of birth for the foreign-born population - Sierra Leone (%)
Place of birth for the foreign-born population - Other Western Africa (%)
Place of birth for the foreign-born population - Australia (%)
Place of birth for the foreign-born population - New Zealand (%)
Place of birth for the foreign-born population - Fiji (%)
Place of birth for the foreign-born population - Micronesia (%)
Place of birth for the foreign-born population - Bahamas (%)
Place of birth for the foreign-born population - Barbados (%)
Place of birth for the foreign-born population - Cuba (%)
Place of birth for the foreign-born population - Dominica (%)
Place of birth for the foreign-born population - Dominican Republic (%)
Place of birth for the foreign-born population - Grenada (%)
Place of birth for the foreign-born population - Haiti (%)
Place of birth for the foreign-born population - Jamaica (%)
Place of birth for the foreign-born population - St. Vincent and the Grenadines (%)
Place of birth for the foreign-born population - Trinidad and Tobago (%)
Place of birth for the foreign-born population - West Indies (%)
Place of birth for the foreign-born population - Other Caribbean (%)
Place of birth for the foreign-born population - Belize (%)
Place of birth for the foreign-born population - Costa Rica (%)
Place of birth for the foreign-born population - El Salvador (%)
Place of birth for the foreign-born population - Guatemala (%)
Place of birth for the foreign-born population - Honduras (%)
Place of birth for the foreign-born population - Mexico (%)
Place of birth for the foreign-born population - Nicaragua (%)
Place of birth for the foreign-born population - Panama (%)
Place of birth for the foreign-born population - Other Central America (%)
Place of birth for the foreign-born population - Argentina (%)
Place of birth for the foreign-born population - Bolivia (%)
Place of birth for the foreign-born population - Brazil (%)
Place of birth for the foreign-born population - Chile (%)
Place of birth for the foreign-born population - Colombia (%)
Place of birth for the foreign-born population - Ecuador (%)
Place of birth for the foreign-born population - Guyana (%)
Place of birth for the foreign-born population - Peru (%)
Place of birth for the foreign-born population - Uruguay (%)
Place of birth for the foreign-born population - Venezuela (%)
Place of birth for the foreign-born population - Other South America (%)
Place of birth for the foreign-born population - Canada (%)
Place of birth for the foreign-born population - Other Northern America (%)
Place of birth for the foreign-born population - Other (%)
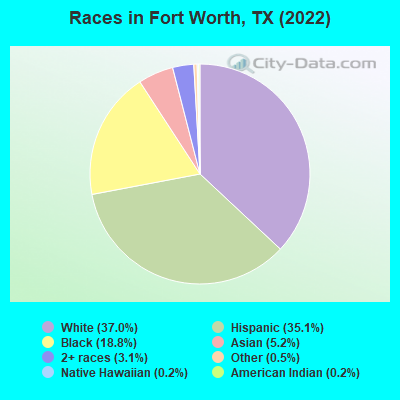
According to 2022 data, the most numerous races in Fort Worth, TX are Hispanic (336,893 residents), White alone (355,363 residents), and Black alone (180,998 residents). 67.2% of Fort Worth residents speak English at home. 16.9% of Fort Worth, TX residents are foreign-born (10.6% born in Latin America, 3.8% born in Asia), which is about the same as the foreign-born rate of 17.0% across the entire state of Texas.
Race distribution in Fort Worth
2000 2022
244,966 45.8% White alone 159,368 29.8% Hispanic 106,988 20.0% Black alone 13,895 2.6% Asian alone 6,873 1.3% Two or more races 1,828 0.3% American Indian alone 523 0.10% Other race alone 253 0.05% Native Hawaiian and Other
355,363 37.0% White alone 336,893 35.1% Hispanic 180,998 18.8% Black alone 49,909 5.2% Asian alone 29,761 3.1% Two or more races 4,474 0.5% Other race alone 1,576 0.2% American Indian alone 2,186 0.2% Native Hawaiian and Other
2000 2022
10,933,313 52.4% White alone 6,669,666 32.0% Hispanic 2,364,255 11.3% Black alone 554,445 2.7% Asian alone 230,567 1.1% Two or more races 68,859 0.3% American Indian alone 19,958 0.10% Other race alone 10,757 0.05% Native Hawaiian and Other
12,070,642 40.2% Hispanic 11,683,430 38.9% White alone 3,508,706 11.7% Black alone 1,608,173 5.4% Asian alone 956,560 3.2% Two or more races 125,763 0.4% Other race alone 47,023 0.2% American Indian alone 29,275 0.10% Native Hawaiian and Other
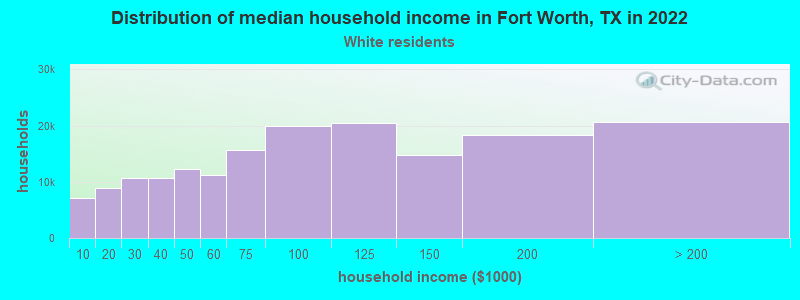
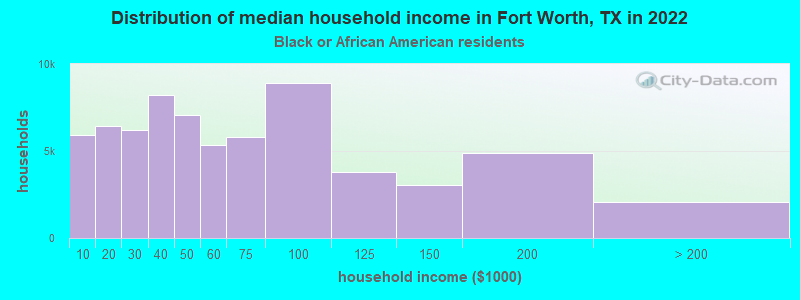
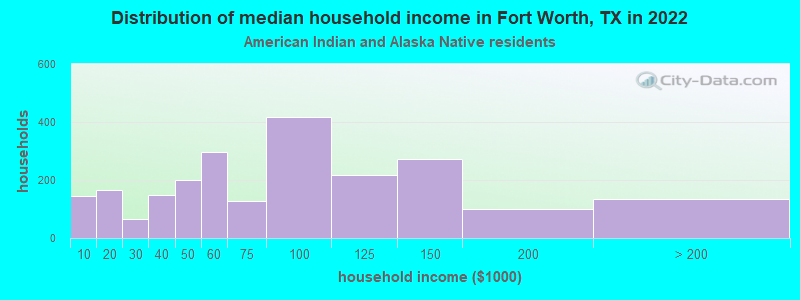
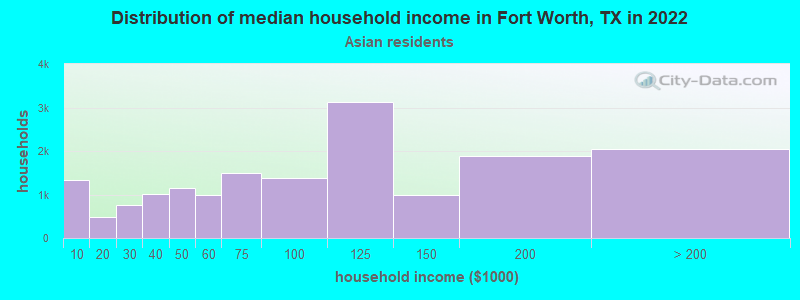
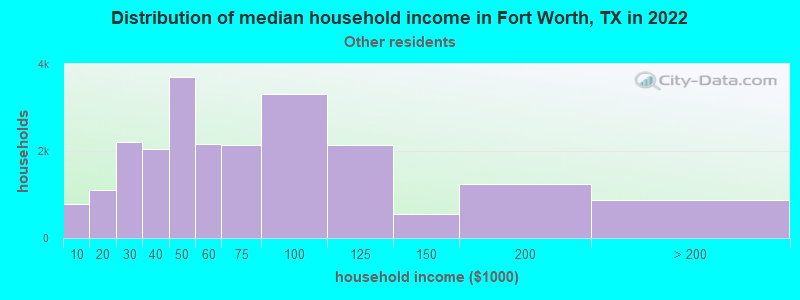
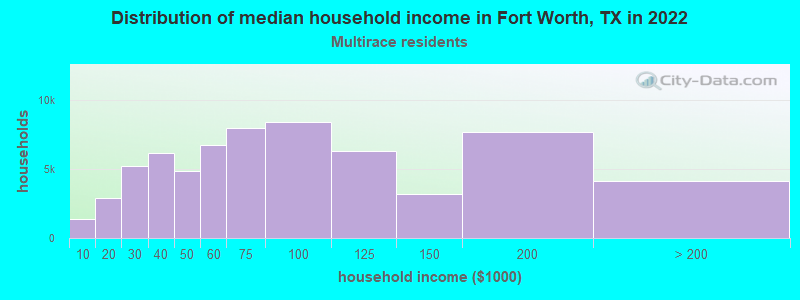
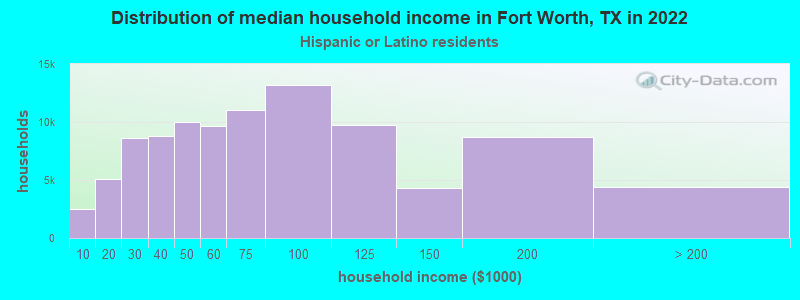
Income and house value in Fort Worth Median household income in 2022 $90,271 White non-Hispanic householders$50,005 Black householders$85,774 American Indian and Alaska Native householders$92,235 Asian householders$54,578 Some other race householders$70,762 Two or more races householders$64,517 Hispanic or Latino race householdersMedian 2022 house value $359,312 White Non-Hispanic householders$199,243 Black or African American householders$319,295 American Indian or Alaska Native householders $372,370 Asian householders$315,925 Native Hawaiian and other Pacific Islander householders$184,921 Some other race householders$286,017 Two or more races householders$192,082 Hispanic or Latino householders
Median age by race in Fort Worth
37.5 Median age for White residents36.7 38.3 32.7 Median age for Black or African American residents31.4 34.1 43.7 Median age for American Indian / Alaska Native residents45.5 41.6 36.8 Median age for Asian residents37.5 36.5 27.9 Median age for Native Hawaiian / Pacific Islander residents14.8 28.0 29.6 Median age for Other race residents30.4 29.1 30.1 Median age for Two or more races residents29.9 30.4 39.4 Median age for White alone residents38.6 40.2 29.5 Median age for Hispanic or Latino residents29.3 29.7
Owner/renter occupied households by race in Fort Worth
House owners and renters - White residents 111,473 65.4% Owner occupied59,072 34.6% Renter occupiedHouse owners and renters - Black or African American residents 28,558 42.2% Owner occupied39,111 57.8% Renter occupiedHouse owners and renters - American Indian / Alaska Native residents 1,472 66.1% Owner occupied755 33.9% Renter occupiedHouse owners and renters - Asian residents 11,787 70.8% Owner occupied4,870 29.2% Renter occupiedHouse owners and renters - Native Hawaiian / Pacific Islander residents 153 24.9% Owner occupied461 75.1% Renter occupiedHouse owners and renters - Other race residents 12,642 56.8% Owner occupied9,622 43.2% Renter occupiedHouse owners and renters - Two or more races residents 39,944 61.4% Owner occupied25,068 38.6% Renter occupiedHouse owners and renters - White alone residents 101,822 66.0% Owner occupied52,528 34.0% Renter occupiedHouse owners and renters - Hispanic or Latino residents 59,007 61.4% Owner occupied37,124 38.6% Renter occupied
Language usage in Fort Worth
English speakers - Total 67.2% of residents of Fort Worth speak English at home.
25.0% of residents speak Spanish at home 140,289 62.5% Speak English very well84,024 37.5% Speak English less than very well7.8% of residents speak other language at home 43,645 62.2% Speak English very well26,511 37.8% Speak English less than very well
English speakers - Born in the United States 85.7% of residents of Fort Worth speak English at home.
11.3% of residents speak Spanish at home 22,037 79.0% Speak English very well5,843 21.0% Speak English less than very well3.0% of residents speak other language at home 6,268 85.3% Speak English very well1,080 14.7% Speak English less than very well
English speakers - Native, born elsewhere 43.4% of residents of Fort Worth speak English at home.
51.5% of residents speak Spanish at home 7,559 77.8% Speak English very well2,162 22.2% Speak English less than very well5.2% of residents speak other language at home 599 61.4% Speak English very well376 38.6% Speak English less than very well
English speakers - Foreign-born 10.6% of residents of Fort Worth speak English at home.
56.0% of residents speak Spanish at home 25,456 28.7% Speak English very well63,304 71.3% Speak English less than very well33.4% of residents speak other language at home 28,931 54.6% Speak English very well24,067 45.4% Speak English less than very well
White (Caucasian) - Speak only English Native:
92.4% (339,973)Foreign-born:
18.9% (4,164)
White (Caucasian) - Speak another language Native:
7.6% (28,097)Foreign-born:
81.1% (17,835)
Black or African American - Speak only English Native:
95.9% (147,072)Foreign-born:
26.1% (4,427)
Black or African American - Speak another language Native:
4.1% (6,360)Foreign-born:
73.9% (12,553)
American Indian / Alaska Native - Speak only English Native:
64.2% (1,969)Foreign-born:
2.5% (62)
American Indian / Alaska Native - Speak another language Native:
35.8% (1,098)Foreign-born:
97.5% (2,423)
Asian - Speak only English Native:
47.5% (7,268)Foreign-born:
9.6% (3,096)
Asian - Speak another language Native:
52.5% (8,018)Foreign-born:
90.4% (29,083)
Native Hawaiian / Pacific Islander - Speak another language Native:
30.7% (303)Foreign-born:
100.0% (194)
Other race - Speak only English Native:
39.1% (21,093)Foreign-born:
10.3% (2,541)
Other race - Speak another language Native:
60.9% (32,883)Foreign-born:
89.7% (22,249)
Two or more races - Speak only English Native:
47.1% (67,443)Foreign-born:
4.3% (2,558)
Two or more races - Speak another language Native:
52.9% (75,687)Foreign-born:
95.7% (56,671)
White alone - Speak only English Native:
97.6% (317,500)Foreign-born:
28.0% (2,860)
White alone - Speak another language Native:
2.4% (7,940)Foreign-born:
72.0% (7,338)
Hispanic or Latino - Speak only English Native:
40.2% (87,990)Foreign-born:
6.9% (6,605)
Hispanic or Latino - Speak another language Native:
59.8% (130,663)Foreign-born:
93.1% (88,775)
Foreign-born residents in Fort Worth 159,504 residents are foreign born (10.6% Latin America , 3.8% Asia ).
This city:
16.9%Texas:
17.1%
Marital status for residents in Fort Worth Marital status - White (Caucasian) population 15 years and over
Males 33.1% Never married53.5% Now married1.1% Separated2.6% Widowed9.7% DivorcedFemales 28.2% Never married49.8% Now married1.6% Separated7.9% Widowed12.6% DivorcedWomen who gave birth in the past 12 months Now married:
74.1% (3,429)Unmarried:
25.9% (1,199)
Women who did not give birth in the past 12 months Now married:
49.4% (49,377)Unmarried:
50.6% (50,567)
Marital status - Black or African American population 15 years and over
Males 45.4% Never married39.3% Now married2.2% Separated2.7% Widowed10.4% DivorcedFemales 42.6% Never married29.9% Now married4.7% Separated7.6% Widowed15.3% DivorcedWomen who gave birth in the past 12 months Now married:
63.6% (2,282)Unmarried:
36.4% (1,307)
Women who did not give birth in the past 12 months Now married:
31.6% (14,118)Unmarried:
68.4% (30,519)
Marital status - American Indian / Alaska Native population 15 years and over
Males 33.7% Never married55.0% Now married5.6% Separated0.0% Widowed5.6% DivorcedFemales 31.5% Never married43.1% Now married0.0% Separated3.3% Widowed22.0% DivorcedWomen who gave birth in the past 12 months Now married:
0.0% (0)Unmarried:
100.0% (11)
Women who did not give birth in the past 12 months Now married:
49.5% (1,012)Unmarried:
50.5% (1,031)
Marital status - Asian population 15 years and over
Males 25.8% Never married69.4% Now married0.5% Separated2.0% Widowed2.3% DivorcedFemales 21.3% Never married64.4% Now married1.5% Separated8.1% Widowed4.7% DivorcedWomen who gave birth in the past 12 months Now married:
100.0% (973)Unmarried:
0.0% (0)
Women who did not give birth in the past 12 months Now married:
63.0% (9,596)Unmarried:
37.0% (5,641)
Marital status - Native Hawaiian / Pacific Islander population 15 years and over
Males 3.4% Never married96.6% Now married0.0% Separated0.0% Widowed0.0% DivorcedFemales 20.6% Never married28.9% Now married8.7% Separated18.9% Widowed23.0% DivorcedWomen who did not give birth in the past 12 months Now married:
52.1% (195)Unmarried:
47.9% (179)
Marital status - Other race population 15 years and over
Males 44.2% Never married41.4% Now married3.4% Separated1.4% Widowed9.6% DivorcedFemales 42.7% Never married41.4% Now married3.2% Separated4.1% Widowed8.7% DivorcedWomen who gave birth in the past 12 months Now married:
71.1% (911)Unmarried:
28.9% (370)
Women who did not give birth in the past 12 months Now married:
40.2% (9,050)Unmarried:
59.8% (13,480)
Marital status - Two or more races population 15 years and over
Males 41.5% Never married49.2% Now married1.7% Separated1.9% Widowed5.8% DivorcedFemales 38.7% Never married44.3% Now married3.3% Separated5.4% Widowed8.2% DivorcedWomen who gave birth in the past 12 months Now married:
63.1% (1,914)Unmarried:
36.9% (1,120)
Women who did not give birth in the past 12 months Now married:
40.5% (22,039)Unmarried:
59.5% (32,416)
Marital status - White alone, not Hispanic / Latino population 15 years and over
Males 32.1% Never married54.5% Now married1.0% Separated2.4% Widowed10.1% DivorcedFemales 26.9% Never married50.9% Now married0.9% Separated8.5% Widowed12.9% DivorcedWomen who gave birth in the past 12 months Now married:
89.2% (3,162)Unmarried:
10.8% (381)
Women who did not give birth in the past 12 months Now married:
50.5% (42,521)Unmarried:
49.5% (41,679)
Marital status - Hispanic or Latino population 15 years and over
Males 42.6% Never married46.5% Now married2.2% Separated2.1% Widowed6.6% DivorcedFemales 39.2% Never married43.6% Now married4.2% Separated4.8% Widowed8.3% DivorcedWomen who gave birth in the past 12 months Now married:
56.7% (2,841)Unmarried:
43.3% (2,170)
Women who did not give birth in the past 12 months Now married:
41.6% (36,001)Unmarried:
58.4% (50,539)
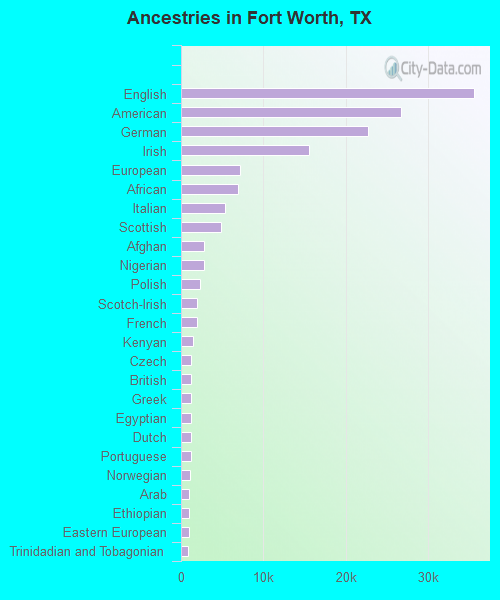
Ancestries in Fort Worth
35,620 6.4% English26,735 4.8% American22,687 4.1% German15,505 2.8% Irish7,137 1.3% European6,888 1.2% African5,364 1.0% Italian4,806 0.9% Scottish2,838 0.5% Afghan2,763 0.5% Nigerian2,329 0.4% Polish1,963 0.4% Scotch-Irish1,954 0.4% French1,473 0.3% Kenyan1,273 0.2% Czech1,252 0.2% British1,250 0.2% Greek1,234 0.2% Egyptian1,210 0.2% Dutch1,154 0.2% Portuguese1,077 0.2% Norwegian1,009 0.2% Arab972 0.2% Ethiopian927 0.2% Eastern European811 0.1% Trinidadian and Tobagonian804 0.1% Jamaican757 0.1% French Canadian628 0.1% Swedish540 0.10% Russian500 0.09% Lebanese500 0.09% Brazilian481 0.09% Somali474 0.09% Sudanese470 0.08% Yugoslavian449 0.08% Ukrainian444 0.08% Welsh414 0.07% Turkish368 0.07% Canadian368 0.07% South African363 0.07% Iraqi349 0.06% Scandinavian328 0.06% Austrian296 0.05% Northern European251 0.05% Haitian250 0.04% Albanian238 0.04% Dutch West Indian237 0.04% Iranian234 0.04% Liberian224 0.04% Slavic221 0.04% British West Indian182 0.03% Swiss164 0.03% Danish157 0.03% West Indian141 0.03% Ghanaian131 0.02% Zimbabwean126 0.02% Hungarian118 0.02% Serbian118 0.02% Barbadian104 0.02% Bahamian102 0.02% Israeli102 0.02% Syrian99 0.02% Jordanian79 0.01% Czechoslovakian79 0.01% Latvian79 0.01% Armenian72 0.01% Belgian68 0.01% Lithuanian67 0.01% German Russian59 0.01% Moroccan58 0.01% Croatian57 0.01% Slovak53 0.01% Guyanese53 0.01% Pennsylvania German52 0.01% Bulgarian44 0.01% Icelander42 0.01% Romanian36 0.01% Cajun35 0.01% Palestinian29 0.01% Cypriot29 0.01% Finnish29 0.01% Ugandan
Geographical mobility in Fort Worth Same house 1 year ago 354,335 86.2% White (Caucasian)149,911 81.6% Black or African American5,022 73.7% American Indian / Alaska Native45,632 90.4% Asian636 50.9% Native Hawaiian / Pacific Islander73,808 89.3% Other race186,252 87.1% Two or more races303,072 86.0% White alone, not Hispanic / Latino294,879 88.9% Hispanic or LatinoMoved within same county 28,084 6.8% White / Caucasian25,210 13.7% Black or African American780 11.4% American Indian / Alaska Native3,038 6.0% Asian104 8.4% Native Hawaiian / Pacific Islander6,167 7.5% Other race15,183 7.1% Two or more races23,949 6.8% White alone, not Hispanic / Latino23,373 7.0% Hispanic or LatinoMoved within same state 19,424 4.7% White / Caucasian4,025 2.2% Black or African American473 6.9% American Indian / Alaska Native664 1.3% Asian169 13.5% Native Hawaiian / Pacific Islander1,294 1.6% Other race4,528 2.1% Two or more races17,553 5.0% White alone, not Hispanic / Latino5,461 1.6% Hispanic or LatinoMoved from different state 8,038 2.0% White / Caucasian4,181 2.3% Black or African American500 7.3% American Indian / Alaska Native939 1.9% Asian467 37.3% Native Hawaiian / Pacific Islander577 0.7% Other race3,334 1.6% Two or more races6,655 1.9% White alone, not Hispanic / Latino3,325 1.0% Hispanic or LatinoMoved from abroad 1,387 0.3% White465 0.3% Black or African American18 0.3% American Indian / Alaska Native191 0.4% Asian771 0.9% Other race4,567 2.1% Two or more races1,228 0.3% White alone, not Hispanic / Latino4,509 1.4% Hispanic or Latino
Children Nativity (place of birth) in Fort Worth
Children under 6 years - Living with two parents Both parents native 30,965 100.0% NativeBoth parents foreign-born 12,108 92.9% Native926 7.1% Foreign-bornOne native, one foreign-born parent 8,247 100.0% NativeChildren under 6 years - Living with one parent Native parent 18,228 99.3% Native123 0.7% Foreign-bornForeign-born parent 3,739 87.6% Native528 12.4% Foreign-bornChildren 6 to 17 years - Living with two parents Both parents native 70,332 99.8% Native113 0.2% Foreign-bornBoth parents foreign-born 21,658 80.6% Native5,217 19.4% Foreign-bornOne native, one foreign-born parent 14,156 96.2% Native556 3.8% Foreign-bornChildren 6 to 17 years - Living with one parent Native parent 40,511 100.0% NativeForeign-born parent 13,528 53.4% Native11,793 46.6% Foreign-born
Place of birth for residents in Fort Worth 102,732 Americas101,557 Latin America92,862 Central America36,048 Asia15,228 Africa14,531 South Central Asia12,457 South Eastern Asia5,759 South America5,436 Eastern Asia5,116 Europe4,331 Eastern Africa4,178 Western Africa3,425 Western Asia2,934 Caribbean2,797 Middle Africa2,489 Northern Africa2,187 China1,655 Eastern Europe1,366 Northern Europe1,175 Northern America1,172 Western Europe879 Southern Europe592 Southern Africa379 Oceania214 Australia and New Zealand Subregion85,102 Mexico5,849 India5,015 Vietnam3,955 Nepal3,513 Honduras3,150 Philippines2,819 Nigeria2,689 Korea2,192 El Salvador1,970 Laos1,688 Pakistan1,686 China1,636 Colombia1,605 Venezuela1,591 Cuba1,530 Congo1,480 Kenya1,474 Guatemala1,452 Egypt1,373 Iraq1,297 Afghanistan1,175 Canada999 Democratic Republic of Congo (Zaire)971 Burma (Myanmar)807 Ethiopia755 Brazil668 Liberia628 Bhutan625 Peru587 Thailand560 England559 Japan558 South Africa539 Sudan515 Bangladesh506 Jordan499 Ghana487 Argentina486 France480 Bosnia and Herzegovina460 United Kingdom455 Germany443 Jamaica439 Spain367 Syria353 Sri Lanka336 Malaysia319 Tanzania315 Taiwan315 Lebanon301 Ecuador279 Dominican Republic267 Cameroon244 Iran238 Cambodia237 Somalia236 Costa Rica209 Kuwait200 Turkey197 Chile196 Russia192 Saudi Arabia191 Haiti189 Scotland186 Hong Kong177 Albania162 Italy161 Nicaragua151 Zimbabwe149 Portugal147 Australia146 Trinidad and Tobago128 Greece128 Indonesia124 Eritrea120 Panama119 Ukraine115 Croatia115 United Arab Emirates105 Poland92 Austria88 Micronesia86 Algeria83 Morocco81 Uganda80 Togo77 Sweden77 Uruguay74 Israel72 Barbados71 Serbia70 Switzerland67 New Zealand61 Belize56 Romania54 Czechoslovakia51 Grenada48 Ireland47 Guyana47 Netherlands46 Singapore46 Latvia27 Senegal25 Bahamas24 Bolivia19 Lithuania18 Dominica17 Hungary14 Ivory Coast13 Yemen12 North Macedonia (Macedonia)12 Sierra Leone10 Moldova10 Bulgaria10 Belarus8 Armenia
Grandparents responsible for own grandchildren in Fort Worth
Grandparents (30 to 59 years) White / Caucasian 1,232 69.6% Responsible for grandchildren537 30.4% Not responsible for grandchildrenBlack or African American 1,295 65.7% Responsible for grandchildren677 34.3% Not responsible for grandchildrenAmerican Indian / Alaska Native 81 70.3% Responsible for grandchildren34 29.7% Not responsible for grandchildrenAsian 72 23.7% Responsible for grandchildren230 76.3% Not responsible for grandchildrenNative Hawaiian / Pacific Islander 62 100.0% Not responsible for grandchildrenOther race 341 26.1% Responsible for grandchildren965 73.9% Not responsible for grandchildrenTwo or more races 1,163 38.7% Responsible for grandchildren1,842 61.3% Not responsible for grandchildrenWhite alone, not Hispanic / Latino 641 59.4% Responsible for grandchildren438 40.6% Not responsible for grandchildrenHispanic or Latino 2,095 46.3% Responsible for grandchildren2,434 53.7% Not responsible for grandchildrenGrandparents (60 years and over) White / Caucasian 1,013 27.9% Responsible for grandchildren2,616 72.1% Not responsible for grandchildrenBlack or African American 199 10.3% Responsible for grandchildren1,725 89.7% Not responsible for grandchildrenAmerican Indian / Alaska Native 20 17.9% Responsible for grandchildren93 82.1% Not responsible for grandchildrenAsian 74 8.0% Responsible for grandchildren844 92.0% Not responsible for grandchildrenOther race 286 15.3% Responsible for grandchildren1,589 84.7% Not responsible for grandchildrenTwo or more races 357 14.1% Responsible for grandchildren2,168 85.9% Not responsible for grandchildrenWhite alone, not Hispanic / Latino 609 25.6% Responsible for grandchildren1,773 74.4% Not responsible for grandchildrenHispanic or Latino 1,047 20.7% Responsible for grandchildren4,003 79.3% Not responsible for grandchildren
Zip codes: 76052 , 76102 , 76103 , 76104 , 76105 , 76106 , 76107 , 76108 , 76110 , 76111 , 76114 , 76115 , 76117 , 76118 , 76123 , 76127 , 76129 , 76133 , 76135 , 76137 , 76148 , 76164 , 76177 , 76244 , 76248 .