Races in Fort Lee, New Jersey (NJ) Detailed Stats
Data:
Races - White alone (%)
Races - White alone (% change since 2000)
Races - Black alone (%)
Races - Black alone (% change since 2000)
Races - American Indian alone (%)
Races - American Indian alone (% change since 2000)
Races - Asian alone (%)
Races - Asian alone (% change since 2000)
Races - Hispanic (%)
Races - Hispanic (% change since 2000)
Races - Native Hawaiian and Other Pacific Islander alone (%)
Races - Native Hawaiian and Other Pacific Islander alone (% change since 2000)
Races - Two or more races(%)
Races - Two or more races(% change since 2000)
Races - Other race alone (%)
Races - Other race alone (% change since 2000)
Racial diversity
Place of birth - Born in state of residence (%)
Place of birth - Born in state of residence (%) - White
Place of birth - Born in state of residence (%) - Black or African American
Place of birth - Born in state of residence (%) - Asian
Place of birth - Born in state of residence (%) - Hispanic or Latino
Place of birth - Born in state of residence (%) - American Indian and Alaska Native
Place of birth - Born in state of residence (%) - Multirace
Place of birth - Born in state of residence (%) - Other Race
Place of birth - Born in other state (%)
Place of birth - Born in other state (%) - White
Place of birth - Born in other state (%) - Black or African American
Place of birth - Born in other state (%) - Asian
Place of birth - Born in other state (%) - Hispanic or Latino
Place of birth - Born in other state (%) - American Indian and Alaska Native
Place of birth - Born in other state (%) - Multirace
Place of birth - Born in other state (%) - Other Race
Place of birth - Native, outside of US (%)
Place of birth - Native, outside of US (%) - White
Place of birth - Native, outside of US (%) - Black or African American
Place of birth - Native, outside of US (%) - Asian
Place of birth - Native, outside of US (%) - Hispanic or Latino
Place of birth - Native, outside of US (%) - American Indian and Alaska Native
Place of birth - Native, outside of US (%) - Multirace
Place of birth - Native, outside of US (%) - Other Race
Place of birth - Foreign born (%)
Place of birth - Foreign born (%) - White
Place of birth - Foreign born (%) - Black or African American
Place of birth - Foreign born (%) - Asian
Place of birth - Foreign born (%) - Hispanic or Latino
Place of birth - Foreign born (%) - American Indian and Alaska Native
Place of birth - Foreign born (%) - Multirace
Place of birth - Foreign born (%) - Other Race
Residents speaking English at home (%)
Residents speaking English at home - Born in the United States (%)
Residents speaking English at home - Native, born elsewhere (%)
Residents speaking English at home - Foreign born (%)
Residents speaking Spanish at home (%)
Residents speaking Spanish at home - Born in the United States (%)
Residents speaking Spanish at home - Native, born elsewhere (%)
Residents speaking Spanish at home - Foreign born (%)
Residents speaking other language at home (%)
Residents speaking other language at home - Born in the United States (%)
Residents speaking other language at home - Native, born elsewhere (%)
Residents speaking other language at home - Foreign born (%)
Marital status - Never married (%)
Marital status - Now married (%)
Marital status - Separated (%)
Marital status - Widowed (%)
Marital status - Divorced (%)
Ancestries Reported - Arab (%)
Ancestries Reported - Czech (%)
Ancestries Reported - Danish (%)
Ancestries Reported - Dutch (%)
Ancestries Reported - English (%)
Ancestries Reported - French (%)
Ancestries Reported - French Canadian (%)
Ancestries Reported - German (%)
Ancestries Reported - Greek (%)
Ancestries Reported - Hungarian (%)
Ancestries Reported - Irish (%)
Ancestries Reported - Italian (%)
Ancestries Reported - Lithuanian (%)
Ancestries Reported - Norwegian (%)
Ancestries Reported - Polish (%)
Ancestries Reported - Portuguese (%)
Ancestries Reported - Russian (%)
Ancestries Reported - Scotch-Irish (%)
Ancestries Reported - Scottish (%)
Ancestries Reported - Slovak (%)
Ancestries Reported - Subsaharan African (%)
Ancestries Reported - Swedish (%)
Ancestries Reported - Swiss (%)
Ancestries Reported - Ukrainian (%)
Ancestries Reported - United States (%)
Ancestries Reported - Welsh (%)
Ancestries Reported - West Indian (%)
Ancestries Reported - Other (%)
Geographical mobility - Same house 1 year ago (%)
Geographical mobility - Same house 1 year ago (%) - White
Geographical mobility - Same house 1 year ago (%) - Black or African American
Geographical mobility - Same house 1 year ago (%) - Asian
Geographical mobility - Same house 1 year ago (%) - Hispanic or Latino
Geographical mobility - Same house 1 year ago (%) - American Indian and Alaska Native
Geographical mobility - Same house 1 year ago (%) - Multirace
Geographical mobility - Same house 1 year ago (%) - Other Race
Geographical mobility - Moved within same county (%)
Geographical mobility - Moved within same county (%) - White
Geographical mobility - Moved within same county (%) - Black or African American
Geographical mobility - Moved within same county (%) - Asian
Geographical mobility - Moved within same county (%) - Hispanic or Latino
Geographical mobility - Moved within same county (%) - American Indian and Alaska Native
Geographical mobility - Moved within same county (%) - Multirace
Geographical mobility - Moved within same county (%) - Other Race
Geographical mobility - Moved from different county within same state (%)
Geographical mobility - Moved from different county within same state (%) - White
Geographical mobility - Moved from different county within same state (%) - Black or African American
Geographical mobility - Moved from different county within same state (%) - Asian
Geographical mobility - Moved from different county within same state (%) - Hispanic or Latino
Geographical mobility - Moved from different county within same state (%) - American Indian and Alaska Native
Geographical mobility - Moved from different county within same state (%) - Multirace
Geographical mobility - Moved from different county within same state (%) - Other Race
Geographical mobility - Moved from different state (%)
Geographical mobility - Moved from different state (%) - White
Geographical mobility - Moved from different state (%) - Black or African American
Geographical mobility - Moved from different state (%) - Asian
Geographical mobility - Moved from different state (%) - Hispanic or Latino
Geographical mobility - Moved from different state (%) - American Indian and Alaska Native
Geographical mobility - Moved from different state (%) - Multirace
Geographical mobility - Moved from different state (%) - Other Race
Geographical mobility - Moved from abroad (%)
Geographical mobility - Moved from abroad (%) - White
Geographical mobility - Moved from abroad (%) - Black or African American
Geographical mobility - Moved from abroad (%) - Asian
Geographical mobility - Moved from abroad (%) - Hispanic or Latino
Geographical mobility - Moved from abroad (%) - American Indian and Alaska Native
Geographical mobility - Moved from abroad (%) - Multirace
Geographical mobility - Moved from abroad (%) - Other Race
Place of birth for the foreign-born population - Ireland (%)
Place of birth for the foreign-born population - Denmark (%)
Place of birth for the foreign-born population - Norway (%)
Place of birth for the foreign-born population - Sweden (%)
Place of birth for the foreign-born population - United Kingdom (%)
Place of birth for the foreign-born population - England (%)
Place of birth for the foreign-born population - Scotland (%)
Place of birth for the foreign-born population - Other Northern Europe (%)
Place of birth for the foreign-born population - Austria (%)
Place of birth for the foreign-born population - Belgium (%)
Place of birth for the foreign-born population - France (%)
Place of birth for the foreign-born population - Germany (%)
Place of birth for the foreign-born population - Netherlands (%)
Place of birth for the foreign-born population - Switzerland (%)
Place of birth for the foreign-born population - Other Western Europe (%)
Place of birth for the foreign-born population - Greece (%)
Place of birth for the foreign-born population - Italy (%)
Place of birth for the foreign-born population - Portugal (%)
Place of birth for the foreign-born population - Spain (%)
Place of birth for the foreign-born population - Other Southern Europe (%)
Place of birth for the foreign-born population - Albania (%)
Place of birth for the foreign-born population - Belarus (%)
Place of birth for the foreign-born population - Bosnia and Herzegovina (%)
Place of birth for the foreign-born population - Bulgaria (%)
Place of birth for the foreign-born population - Croatia (%)
Place of birth for the foreign-born population - Czechoslovakia (%)
Place of birth for the foreign-born population - Hungary (%)
Place of birth for the foreign-born population - Latvia (%)
Place of birth for the foreign-born population - Lithuania (%)
Place of birth for the foreign-born population - North Macedonia (Macedonia) (%)
Place of birth for the foreign-born population - Moldova (%)
Place of birth for the foreign-born population - Poland (%)
Place of birth for the foreign-born population - Romania (%)
Place of birth for the foreign-born population - Russia (%)
Place of birth for the foreign-born population - Serbia (%)
Place of birth for the foreign-born population - Ukraine (%)
Place of birth for the foreign-born population - Other Eastern Europe (%)
Place of birth for the foreign-born population - China (%)
Place of birth for the foreign-born population - Hong Kong (%)
Place of birth for the foreign-born population - Taiwan (%)
Place of birth for the foreign-born population - Japan (%)
Place of birth for the foreign-born population - Korea (%)
Place of birth for the foreign-born population - Other Eastern Asia (%)
Place of birth for the foreign-born population - Afghanistan (%)
Place of birth for the foreign-born population - Bangladesh (%)
Place of birth for the foreign-born population - India (%)
Place of birth for the foreign-born population - Iran (%)
Place of birth for the foreign-born population - Kazakhstan (%)
Place of birth for the foreign-born population - Nepal (%)
Place of birth for the foreign-born population - Pakistan (%)
Place of birth for the foreign-born population - Sri Lanka (%)
Place of birth for the foreign-born population - Uzbekistan (%)
Place of birth for the foreign-born population - Other South Central Asia (%)
Place of birth for the foreign-born population - Burma (%)
Place of birth for the foreign-born population - Cambodia (%)
Place of birth for the foreign-born population - Indonesia (%)
Place of birth for the foreign-born population - Laos (%)
Place of birth for the foreign-born population - Malaysia (%)
Place of birth for the foreign-born population - Philippines (%)
Place of birth for the foreign-born population - Singapore (%)
Place of birth for the foreign-born population - Thailand (%)
Place of birth for the foreign-born population - Vietnam (%)
Place of birth for the foreign-born population - Other South Eastern Asia (%)
Place of birth for the foreign-born population - Armenia (%)
Place of birth for the foreign-born population - Iraq (%)
Place of birth for the foreign-born population - Israel (%)
Place of birth for the foreign-born population - Jordan (%)
Place of birth for the foreign-born population - Kuwait (%)
Place of birth for the foreign-born population - Lebanon (%)
Place of birth for the foreign-born population - Saudi Arabia (%)
Place of birth for the foreign-born population - Syria (%)
Place of birth for the foreign-born population - Turkey (%)
Place of birth for the foreign-born population - Yemen (%)
Place of birth for the foreign-born population - Other Western Asia (%)
Place of birth for the foreign-born population - Eritrea (%)
Place of birth for the foreign-born population - Ethiopia (%)
Place of birth for the foreign-born population - Kenya (%)
Place of birth for the foreign-born population - Somalia (%)
Place of birth for the foreign-born population - Uganda (%)
Place of birth for the foreign-born population - Zimbabwe (%)
Place of birth for the foreign-born population - Other Eastern Africa (%)
Place of birth for the foreign-born population - Cameroon (%)
Place of birth for the foreign-born population - Congo (%)
Place of birth for the foreign-born population - Democratic Republic of Congo (Zaire) (%)
Place of birth for the foreign-born population - Other Middle Africa (%)
Place of birth for the foreign-born population - Egypt (%)
Place of birth for the foreign-born population - Morocco (%)
Place of birth for the foreign-born population - Sudan (%)
Place of birth for the foreign-born population - Other Northern Africa (%)
Place of birth for the foreign-born population - South Africa (%)
Place of birth for the foreign-born population - Other Southern Africa (%)
Place of birth for the foreign-born population - Cabo Verde (%)
Place of birth for the foreign-born population - Ghana (%)
Place of birth for the foreign-born population - Liberia (%)
Place of birth for the foreign-born population - Nigeria (%)
Place of birth for the foreign-born population - Senegal (%)
Place of birth for the foreign-born population - Sierra Leone (%)
Place of birth for the foreign-born population - Other Western Africa (%)
Place of birth for the foreign-born population - Australia (%)
Place of birth for the foreign-born population - New Zealand (%)
Place of birth for the foreign-born population - Fiji (%)
Place of birth for the foreign-born population - Micronesia (%)
Place of birth for the foreign-born population - Bahamas (%)
Place of birth for the foreign-born population - Barbados (%)
Place of birth for the foreign-born population - Cuba (%)
Place of birth for the foreign-born population - Dominica (%)
Place of birth for the foreign-born population - Dominican Republic (%)
Place of birth for the foreign-born population - Grenada (%)
Place of birth for the foreign-born population - Haiti (%)
Place of birth for the foreign-born population - Jamaica (%)
Place of birth for the foreign-born population - St. Vincent and the Grenadines (%)
Place of birth for the foreign-born population - Trinidad and Tobago (%)
Place of birth for the foreign-born population - West Indies (%)
Place of birth for the foreign-born population - Other Caribbean (%)
Place of birth for the foreign-born population - Belize (%)
Place of birth for the foreign-born population - Costa Rica (%)
Place of birth for the foreign-born population - El Salvador (%)
Place of birth for the foreign-born population - Guatemala (%)
Place of birth for the foreign-born population - Honduras (%)
Place of birth for the foreign-born population - Mexico (%)
Place of birth for the foreign-born population - Nicaragua (%)
Place of birth for the foreign-born population - Panama (%)
Place of birth for the foreign-born population - Other Central America (%)
Place of birth for the foreign-born population - Argentina (%)
Place of birth for the foreign-born population - Bolivia (%)
Place of birth for the foreign-born population - Brazil (%)
Place of birth for the foreign-born population - Chile (%)
Place of birth for the foreign-born population - Colombia (%)
Place of birth for the foreign-born population - Ecuador (%)
Place of birth for the foreign-born population - Guyana (%)
Place of birth for the foreign-born population - Peru (%)
Place of birth for the foreign-born population - Uruguay (%)
Place of birth for the foreign-born population - Venezuela (%)
Place of birth for the foreign-born population - Other South America (%)
Place of birth for the foreign-born population - Canada (%)
Place of birth for the foreign-born population - Other Northern America (%)
Place of birth for the foreign-born population - Other (%)
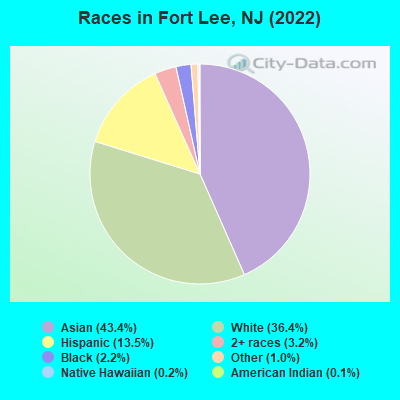
According to 2022 data, the most numerous races in Fort Lee, NJ are White alone (14,500 residents), Hispanic (5,383 residents), and Black alone (862 residents). 38.9% of Fort Lee residents speak English at home. 51.7% of Fort Lee, NJ residents are foreign-born (36.3% born in Asia, 6.7% born in Europe, 6.5% born in Latin America), which is 55.5% greater than the foreign-born rate of 23.0% across the entire state of New Jersey.
Race distribution in Fort Lee
2000 2022
5,557,209 66.0% White alone 1,117,191 13.3% Hispanic 1,096,171 13.0% Black alone 477,012 5.7% Asian alone 133,689 1.6% Two or more races 19,565 0.2% Other race alone 11,338 0.1% American Indian alone 2,175 0.03% Native Hawaiian and Other
4,766,476 51.5% White alone 2,028,470 21.9% Hispanic 1,111,632 12.0% Black alone 923,546 10.0% Asian alone 332,237 3.6% Two or more races 89,847 1.0% Other race alone 8,557 0.09% American Indian alone 934 0.01% Native Hawaiian and Other
Income and house value in Fort Lee Median household income in 2022 $87,233 White non-Hispanic householders$154,578 Black householders$141,997 American Indian and Alaska Native householders$102,786 Asian householders$81,473 Some other race householders$74,581 Two or more races householders$86,839 Hispanic or Latino race householdersMedian 2022 house value $615,754 White Non-Hispanic householders$479,559 Black or African American householders$479,559 American Indian or Alaska Native householders $624,919 Asian householders$346,348 Some other race householders$539,877 Two or more races householders$578,881 Hispanic or Latino householders
Median age by race in Fort Lee
59.9 Median age for White residents55.5 64.0 40.2 Median age for Black or African American residents45.2 36.0 35.3 Median age for American Indian / Alaska Native residents-686,322,685.6 9.9 43.7 Median age for Asian residents41.2 47.2 39.2 Median age for Native Hawaiian / Pacific Islander residents9.0 -713,070,378.3 33.2 Median age for Other race residents30.3 39.2 37.4 Median age for Two or more races residents36.7 37.1 60.0 Median age for White alone residents56.4 62.9 38.6 Median age for Hispanic or Latino residents35.5 40.8
Owner/renter occupied households by race in Fort Lee
House owners and renters - White residents 5,926 68.3% Owner occupied2,749 31.7% Renter occupiedHouse owners and renters - Black or African American residents 121 30.1% Owner occupied282 69.9% Renter occupiedHouse owners and renters - American Indian / Alaska Native residents 15 30.3% Owner occupied34 69.7% Renter occupiedHouse owners and renters - Asian residents 3,703 52.9% Owner occupied3,294 47.1% Renter occupiedHouse owners and renters - Native Hawaiian / Pacific Islander residents 17 100.0% Renter occupiedHouse owners and renters - Other race residents 305 42.2% Owner occupied418 57.8% Renter occupiedHouse owners and renters - Two or more races residents 670 48.0% Owner occupied725 52.0% Renter occupiedHouse owners and renters - White alone residents 5,824 70.1% Owner occupied2,488 29.9% Renter occupiedHouse owners and renters - Hispanic or Latino residents 987 41.8% Owner occupied1,375 58.2% Renter occupied
Language usage in Fort Lee
English speakers - Total 38.9% of residents of Fort Lee speak English at home.
9.6% of residents speak Spanish at home 2,545 70.8% Speak English very well1,048 29.2% Speak English less than very well51.7% of residents speak other language at home 10,142 52.2% Speak English very well9,290 47.8% Speak English less than very well
English speakers - Born in the United States 72.0% of residents of Fort Lee speak English at home.
6.6% of residents speak Spanish at home 651 94.2% Speak English very well40 5.8% Speak English less than very well21.2% of residents speak other language at home 2,111 94.8% Speak English very well116 5.2% Speak English less than very well
English speakers - Native, born elsewhere 34.0% of residents of Fort Lee speak English at home.
36.8% of residents speak Spanish at home 239 76.1% Speak English very well75 23.9% Speak English less than very well31.1% of residents speak other language at home 111 41.7% Speak English very well155 58.3% Speak English less than very well
English speakers - Foreign-born 13.2% of residents of Fort Lee speak English at home.
10.1% of residents speak Spanish at home 1,162 56.8% Speak English very well884 43.2% Speak English less than very well75.9% of residents speak other language at home 6,597 43.0% Speak English very well8,742 57.0% Speak English less than very well
White (Caucasian) - Speak only English Native:
84.6% (8,552)Foreign-born:
23.5% (936)
White (Caucasian) - Speak another language Native:
14.1% (1,429)Foreign-born:
76.9% (3,059)
Black or African American - Speak only English Native:
81.6% (691)Foreign-born:
66.9% (134)
Black or African American - Speak another language Native:
18.5% (157)Foreign-born:
33.5% (67)
Asian - Speak only English Native:
36.9% (1,384)Foreign-born:
10.0% (1,257)
Asian - Speak another language Native:
62.7% (2,353)Foreign-born:
90.0% (11,272)
Native Hawaiian / Pacific Islander - Speak only English Native:
99.5% (32)Foreign-born:
53.9% (14)
Other race - Speak only English Native:
25.4% (232)Foreign-born:
3.8% (31)
Other race - Speak another language Native:
74.1% (676)Foreign-born:
97.3% (801)
Two or more races - Speak only English Native:
56.9% (1,119)Foreign-born:
15.5% (299)
Two or more races - Speak another language Native:
43.3% (851)Foreign-born:
83.9% (1,619)
White alone - Speak only English Native:
84.9% (8,122)Foreign-born:
20.4% (886)
White alone - Speak another language Native:
14.7% (1,406)Foreign-born:
79.7% (3,464)
Hispanic or Latino - Speak only English Native:
44.1% (1,179)Foreign-born:
14.2% (333)
Hispanic or Latino - Speak another language Native:
54.7% (1,461)Foreign-born:
86.7% (2,032)
Foreign-born residents in Fort Lee 20,559 residents are foreign born (36.3% Asia , 6.7% Europe , 6.5% Latin America ).
This city:
51.7%New Jersey:
23.2%
Marital status for residents in Fort Lee Marital status - White (Caucasian) population 15 years and over
Males 25.6% Never married53.1% Now married2.6% Separated5.0% Widowed13.6% DivorcedFemales 21.9% Never married44.8% Now married0.6% Separated17.2% Widowed15.4% DivorcedWomen who gave birth in the past 12 months Now married:
100.0% (191)Unmarried:
0.0% (0)
Women who did not give birth in the past 12 months Now married:
44.3% (967)Unmarried:
55.7% (1,216)
Marital status - Black or African American population 15 years and over
Males 40.2% Never married46.2% Now married13.6% Separated0.0% Widowed0.0% DivorcedFemales 41.2% Never married27.6% Now married9.1% Separated1.6% Widowed20.4% DivorcedWomen who gave birth in the past 12 months Now married:
100.0% (21)Unmarried:
0.0% (0)
Women who did not give birth in the past 12 months Now married:
22.3% (61)Unmarried:
77.7% (211)
Marital status - American Indian / Alaska Native population 15 years and over
Males 100.0% Never married0.0% Now married0.0% Separated0.0% Widowed0.0% DivorcedFemales 14.3% Never married66.7% Now married0.0% Separated0.0% Widowed19.0% DivorcedWomen who did not give birth in the past 12 months Now married:
100.0% (22)Unmarried:
0.0% (0)
Marital status - Asian population 15 years and over
Males 27.2% Never married67.1% Now married1.2% Separated2.1% Widowed2.5% DivorcedFemales 20.3% Never married62.0% Now married3.3% Separated4.1% Widowed10.3% DivorcedWomen who gave birth in the past 12 months Now married:
95.7% (282)Unmarried:
4.3% (13)
Women who did not give birth in the past 12 months Now married:
62.8% (2,346)Unmarried:
37.2% (1,389)
Marital status - Native Hawaiian / Pacific Islander population 15 years and over
Males 0.0% Never married0.0% Now married100.0% Separated0.0% Widowed0.0% DivorcedFemales 0.0% Never married0.0% Now married0.0% Separated0.0% Widowed100.0% DivorcedMarital status - Other race population 15 years and over
Males 48.9% Never married40.9% Now married0.0% Separated4.1% Widowed6.1% DivorcedFemales 25.9% Never married40.2% Now married6.2% Separated0.0% Widowed27.6% DivorcedWomen who gave birth in the past 12 months Now married:
100.0% (99)Unmarried:
0.0% (0)
Women who did not give birth in the past 12 months Now married:
45.0% (246)Unmarried:
55.0% (300)
Marital status - Two or more races population 15 years and over
Males 45.5% Never married41.8% Now married2.4% Separated0.0% Widowed10.4% DivorcedFemales 39.2% Never married38.1% Now married7.6% Separated2.9% Widowed12.1% DivorcedWomen who gave birth in the past 12 months Now married:
18.9% (20)Unmarried:
81.1% (88)
Women who did not give birth in the past 12 months Now married:
32.5% (289)Unmarried:
67.5% (601)
Marital status - White alone, not Hispanic / Latino population 15 years and over
Males 25.3% Never married54.6% Now married1.6% Separated4.8% Widowed13.7% DivorcedFemales 20.1% Never married45.0% Now married0.7% Separated19.1% Widowed15.1% DivorcedWomen who gave birth in the past 12 months Now married:
100.0% (175)Unmarried:
0.0% (0)
Women who did not give birth in the past 12 months Now married:
48.4% (1,003)Unmarried:
51.6% (1,068)
Marital status - Hispanic or Latino population 15 years and over
Males 38.6% Never married42.8% Now married5.5% Separated3.7% Widowed9.3% DivorcedFemales 34.0% Never married39.7% Now married4.3% Separated2.4% Widowed19.7% DivorcedWomen who gave birth in the past 12 months Now married:
72.8% (123)Unmarried:
27.2% (46)
Women who did not give birth in the past 12 months Now married:
32.0% (379)Unmarried:
68.0% (803)
Ancestries in Fort Lee
1,218 4.6% Italian806 3.0% Russian634 2.4% American541 2.0% Armenian515 1.9% Greek503 1.9% Polish410 1.5% Turkish342 1.3% European320 1.2% English295 1.1% Romanian276 1.0% Irish251 0.9% German185 0.7% Eastern European176 0.7% Moroccan175 0.7% Jordanian168 0.6% Ukrainian139 0.5% Brazilian120 0.5% Croatian111 0.4% Albanian96 0.4% Egyptian77 0.3% Iranian75 0.3% Jamaican60 0.2% Syrian57 0.2% African48 0.2% Bulgarian36 0.1% Lebanese31 0.1% Hungarian30 0.1% Israeli29 0.1% Trinidadian and Tobagonian25 0.09% Scottish23 0.09% Iraqi14 0.05% Serbian13 0.05% French Canadian11 0.04% Cypriot10 0.04% Austrian8 0.03% Guyanese8 0.03% Danish8 0.03% Scandinavian7 0.03% West Indian7 0.03% British5 0.02% Canadian5 0.02% Swedish3 0.01% Swiss2 0.01% Macedonian
Geographical mobility in Fort Lee Same house 1 year ago 13,775 92.6% White (Caucasian)1,033 94.9% Black or African American53 96.6% American Indian / Alaska Native14,501 84.8% Asian59 100.0% Native Hawaiian / Pacific Islander1,774 90.7% Other race3,609 88.5% Two or more races13,356 92.8% White alone, not Hispanic / Latino4,668 87.4% Hispanic or LatinoMoved within same county 704 4.7% White / Caucasian948 5.5% Asian114 5.8% Other race213 5.2% Two or more races662 4.6% White alone, not Hispanic / Latino388 7.3% Hispanic or LatinoMoved within same state 123 0.8% White / Caucasian34 3.1% Black or African American131 0.8% Asian73 1.8% Two or more races91 0.6% White alone, not Hispanic / Latino173 3.2% Hispanic or LatinoMoved from different state 250 1.7% White / Caucasian62 5.7% Black or African American1,091 6.4% Asian21 1.1% Other race96 2.3% Two or more races226 1.6% White alone, not Hispanic / Latino73 1.4% Hispanic or LatinoMoved from abroad 53 0.4% White609 3.6% Asian30 1.6% Other race72 1.8% Two or more races76 0.5% White alone, not Hispanic / Latino70 1.3% Hispanic or Latino
Children Nativity (place of birth) in Fort Lee
Children under 6 years - Living with two parents Both parents native 498 100.0% NativeBoth parents foreign-born 1,028 69.4% Native454 30.6% Foreign-bornOne native, one foreign-born parent 367 96.1% Native15 3.9% Foreign-bornChildren under 6 years - Living with one parent Native parent 63 100.0% NativeForeign-born parent 82 100.0% NativeChildren 6 to 17 years - Living with two parents Both parents native 419 88.0% Native57 12.0% Foreign-bornBoth parents foreign-born 1,736 75.8% Native554 24.2% Foreign-bornOne native, one foreign-born parent 333 95.2% Native17 4.8% Foreign-bornChildren 6 to 17 years - Living with one parent Native parent 466 100.0% NativeForeign-born parent 644 53.3% Native565 46.7% Foreign-born
Place of birth for residents in Fort Lee 14,824 Asia11,213 Eastern Asia3,316 China2,750 Americas2,718 Europe2,645 Latin America1,863 Eastern Europe1,389 South Central Asia1,213 South America1,172 Western Asia1,004 South Eastern Asia962 Caribbean469 Central America466 Southern Europe266 Africa257 Western Europe185 Northern Africa104 Northern America65 Northern Europe57 Western Africa23 Eastern Africa6,730 Korea2,791 China1,166 Japan929 India738 Philippines675 Russia639 Turkey617 Colombia575 Dominican Republic434 Ukraine296 Taiwan255 Italy232 Cuba228 Hong Kong204 Romania201 Germany197 Uzbekistan189 Guatemala188 Argentina179 Israel177 Brazil163 Poland147 Ecuador130 Syria125 Pakistan121 El Salvador116 Egypt111 Greece107 Belarus104 Mexico104 Canada99 Malaysia99 Spain99 Jamaica89 Vietnam73 Kazakhstan69 Albania61 Peru52 Morocco52 Indonesia51 Iran50 Nigeria48 Croatia47 Bulgaria47 Kuwait45 Georgia45 Trinidad and Tobago38 Moldova37 France35 United Kingdom34 Nicaragua33 Lebanon31 Jordan26 Armenia23 Zimbabwe22 Iraq17 Singapore17 Austria14 North Macedonia (Macedonia)13 Serbia13 Guyana12 Sweden11 Nepal11 Ireland11 Honduras10 Dominica10 Saudi Arabia8 Burma (Myanmar)8 Venezuela7 Panama6 England5 Latvia
Grandparents responsible for own grandchildren in Fort Lee
Grandparents (30 to 59 years) Asian 4 100.0% Not responsible for grandchildrenOther race 9 100.0% Not responsible for grandchildrenHispanic or Latino 4 100.0% Not responsible for grandchildrenGrandparents (60 years and over) Asian 16 7.6% Responsible for grandchildren194 92.4% Not responsible for grandchildrenOther race 21 100.0% Not responsible for grandchildrenHispanic or Latino 34 100.0% Not responsible for grandchildren