Races in Fort Bliss, Texas (TX) Detailed Stats
Data:
Races - White alone (%)
Races - White alone (% change since 2000)
Races - Black alone (%)
Races - Black alone (% change since 2000)
Races - American Indian alone (%)
Races - American Indian alone (% change since 2000)
Races - Asian alone (%)
Races - Asian alone (% change since 2000)
Races - Hispanic (%)
Races - Hispanic (% change since 2000)
Races - Native Hawaiian and Other Pacific Islander alone (%)
Races - Native Hawaiian and Other Pacific Islander alone (% change since 2000)
Races - Two or more races(%)
Races - Two or more races(% change since 2000)
Races - Other race alone (%)
Races - Other race alone (% change since 2000)
Racial diversity
Place of birth - Born in state of residence (%)
Place of birth - Born in state of residence (%) - White
Place of birth - Born in state of residence (%) - Black or African American
Place of birth - Born in state of residence (%) - Asian
Place of birth - Born in state of residence (%) - Hispanic or Latino
Place of birth - Born in state of residence (%) - American Indian and Alaska Native
Place of birth - Born in state of residence (%) - Multirace
Place of birth - Born in state of residence (%) - Other Race
Place of birth - Born in other state (%)
Place of birth - Born in other state (%) - White
Place of birth - Born in other state (%) - Black or African American
Place of birth - Born in other state (%) - Asian
Place of birth - Born in other state (%) - Hispanic or Latino
Place of birth - Born in other state (%) - American Indian and Alaska Native
Place of birth - Born in other state (%) - Multirace
Place of birth - Born in other state (%) - Other Race
Place of birth - Native, outside of US (%)
Place of birth - Native, outside of US (%) - White
Place of birth - Native, outside of US (%) - Black or African American
Place of birth - Native, outside of US (%) - Asian
Place of birth - Native, outside of US (%) - Hispanic or Latino
Place of birth - Native, outside of US (%) - American Indian and Alaska Native
Place of birth - Native, outside of US (%) - Multirace
Place of birth - Native, outside of US (%) - Other Race
Place of birth - Foreign born (%)
Place of birth - Foreign born (%) - White
Place of birth - Foreign born (%) - Black or African American
Place of birth - Foreign born (%) - Asian
Place of birth - Foreign born (%) - Hispanic or Latino
Place of birth - Foreign born (%) - American Indian and Alaska Native
Place of birth - Foreign born (%) - Multirace
Place of birth - Foreign born (%) - Other Race
Residents speaking English at home (%)
Residents speaking English at home - Born in the United States (%)
Residents speaking English at home - Native, born elsewhere (%)
Residents speaking English at home - Foreign born (%)
Residents speaking Spanish at home (%)
Residents speaking Spanish at home - Born in the United States (%)
Residents speaking Spanish at home - Native, born elsewhere (%)
Residents speaking Spanish at home - Foreign born (%)
Residents speaking other language at home (%)
Residents speaking other language at home - Born in the United States (%)
Residents speaking other language at home - Native, born elsewhere (%)
Residents speaking other language at home - Foreign born (%)
Marital status - Never married (%)
Marital status - Now married (%)
Marital status - Separated (%)
Marital status - Widowed (%)
Marital status - Divorced (%)
Ancestries Reported - Arab (%)
Ancestries Reported - Czech (%)
Ancestries Reported - Danish (%)
Ancestries Reported - Dutch (%)
Ancestries Reported - English (%)
Ancestries Reported - French (%)
Ancestries Reported - French Canadian (%)
Ancestries Reported - German (%)
Ancestries Reported - Greek (%)
Ancestries Reported - Hungarian (%)
Ancestries Reported - Irish (%)
Ancestries Reported - Italian (%)
Ancestries Reported - Lithuanian (%)
Ancestries Reported - Norwegian (%)
Ancestries Reported - Polish (%)
Ancestries Reported - Portuguese (%)
Ancestries Reported - Russian (%)
Ancestries Reported - Scotch-Irish (%)
Ancestries Reported - Scottish (%)
Ancestries Reported - Slovak (%)
Ancestries Reported - Subsaharan African (%)
Ancestries Reported - Swedish (%)
Ancestries Reported - Swiss (%)
Ancestries Reported - Ukrainian (%)
Ancestries Reported - United States (%)
Ancestries Reported - Welsh (%)
Ancestries Reported - West Indian (%)
Ancestries Reported - Other (%)
Geographical mobility - Same house 1 year ago (%)
Geographical mobility - Same house 1 year ago (%) - White
Geographical mobility - Same house 1 year ago (%) - Black or African American
Geographical mobility - Same house 1 year ago (%) - Asian
Geographical mobility - Same house 1 year ago (%) - Hispanic or Latino
Geographical mobility - Same house 1 year ago (%) - American Indian and Alaska Native
Geographical mobility - Same house 1 year ago (%) - Multirace
Geographical mobility - Same house 1 year ago (%) - Other Race
Geographical mobility - Moved within same county (%)
Geographical mobility - Moved within same county (%) - White
Geographical mobility - Moved within same county (%) - Black or African American
Geographical mobility - Moved within same county (%) - Asian
Geographical mobility - Moved within same county (%) - Hispanic or Latino
Geographical mobility - Moved within same county (%) - American Indian and Alaska Native
Geographical mobility - Moved within same county (%) - Multirace
Geographical mobility - Moved within same county (%) - Other Race
Geographical mobility - Moved from different county within same state (%)
Geographical mobility - Moved from different county within same state (%) - White
Geographical mobility - Moved from different county within same state (%) - Black or African American
Geographical mobility - Moved from different county within same state (%) - Asian
Geographical mobility - Moved from different county within same state (%) - Hispanic or Latino
Geographical mobility - Moved from different county within same state (%) - American Indian and Alaska Native
Geographical mobility - Moved from different county within same state (%) - Multirace
Geographical mobility - Moved from different county within same state (%) - Other Race
Geographical mobility - Moved from different state (%)
Geographical mobility - Moved from different state (%) - White
Geographical mobility - Moved from different state (%) - Black or African American
Geographical mobility - Moved from different state (%) - Asian
Geographical mobility - Moved from different state (%) - Hispanic or Latino
Geographical mobility - Moved from different state (%) - American Indian and Alaska Native
Geographical mobility - Moved from different state (%) - Multirace
Geographical mobility - Moved from different state (%) - Other Race
Geographical mobility - Moved from abroad (%)
Geographical mobility - Moved from abroad (%) - White
Geographical mobility - Moved from abroad (%) - Black or African American
Geographical mobility - Moved from abroad (%) - Asian
Geographical mobility - Moved from abroad (%) - Hispanic or Latino
Geographical mobility - Moved from abroad (%) - American Indian and Alaska Native
Geographical mobility - Moved from abroad (%) - Multirace
Geographical mobility - Moved from abroad (%) - Other Race
Place of birth for the foreign-born population - Ireland (%)
Place of birth for the foreign-born population - Denmark (%)
Place of birth for the foreign-born population - Norway (%)
Place of birth for the foreign-born population - Sweden (%)
Place of birth for the foreign-born population - United Kingdom (%)
Place of birth for the foreign-born population - England (%)
Place of birth for the foreign-born population - Scotland (%)
Place of birth for the foreign-born population - Other Northern Europe (%)
Place of birth for the foreign-born population - Austria (%)
Place of birth for the foreign-born population - Belgium (%)
Place of birth for the foreign-born population - France (%)
Place of birth for the foreign-born population - Germany (%)
Place of birth for the foreign-born population - Netherlands (%)
Place of birth for the foreign-born population - Switzerland (%)
Place of birth for the foreign-born population - Other Western Europe (%)
Place of birth for the foreign-born population - Greece (%)
Place of birth for the foreign-born population - Italy (%)
Place of birth for the foreign-born population - Portugal (%)
Place of birth for the foreign-born population - Spain (%)
Place of birth for the foreign-born population - Other Southern Europe (%)
Place of birth for the foreign-born population - Albania (%)
Place of birth for the foreign-born population - Belarus (%)
Place of birth for the foreign-born population - Bosnia and Herzegovina (%)
Place of birth for the foreign-born population - Bulgaria (%)
Place of birth for the foreign-born population - Croatia (%)
Place of birth for the foreign-born population - Czechoslovakia (%)
Place of birth for the foreign-born population - Hungary (%)
Place of birth for the foreign-born population - Latvia (%)
Place of birth for the foreign-born population - Lithuania (%)
Place of birth for the foreign-born population - North Macedonia (Macedonia) (%)
Place of birth for the foreign-born population - Moldova (%)
Place of birth for the foreign-born population - Poland (%)
Place of birth for the foreign-born population - Romania (%)
Place of birth for the foreign-born population - Russia (%)
Place of birth for the foreign-born population - Serbia (%)
Place of birth for the foreign-born population - Ukraine (%)
Place of birth for the foreign-born population - Other Eastern Europe (%)
Place of birth for the foreign-born population - China (%)
Place of birth for the foreign-born population - Hong Kong (%)
Place of birth for the foreign-born population - Taiwan (%)
Place of birth for the foreign-born population - Japan (%)
Place of birth for the foreign-born population - Korea (%)
Place of birth for the foreign-born population - Other Eastern Asia (%)
Place of birth for the foreign-born population - Afghanistan (%)
Place of birth for the foreign-born population - Bangladesh (%)
Place of birth for the foreign-born population - India (%)
Place of birth for the foreign-born population - Iran (%)
Place of birth for the foreign-born population - Kazakhstan (%)
Place of birth for the foreign-born population - Nepal (%)
Place of birth for the foreign-born population - Pakistan (%)
Place of birth for the foreign-born population - Sri Lanka (%)
Place of birth for the foreign-born population - Uzbekistan (%)
Place of birth for the foreign-born population - Other South Central Asia (%)
Place of birth for the foreign-born population - Burma (%)
Place of birth for the foreign-born population - Cambodia (%)
Place of birth for the foreign-born population - Indonesia (%)
Place of birth for the foreign-born population - Laos (%)
Place of birth for the foreign-born population - Malaysia (%)
Place of birth for the foreign-born population - Philippines (%)
Place of birth for the foreign-born population - Singapore (%)
Place of birth for the foreign-born population - Thailand (%)
Place of birth for the foreign-born population - Vietnam (%)
Place of birth for the foreign-born population - Other South Eastern Asia (%)
Place of birth for the foreign-born population - Armenia (%)
Place of birth for the foreign-born population - Iraq (%)
Place of birth for the foreign-born population - Israel (%)
Place of birth for the foreign-born population - Jordan (%)
Place of birth for the foreign-born population - Kuwait (%)
Place of birth for the foreign-born population - Lebanon (%)
Place of birth for the foreign-born population - Saudi Arabia (%)
Place of birth for the foreign-born population - Syria (%)
Place of birth for the foreign-born population - Turkey (%)
Place of birth for the foreign-born population - Yemen (%)
Place of birth for the foreign-born population - Other Western Asia (%)
Place of birth for the foreign-born population - Eritrea (%)
Place of birth for the foreign-born population - Ethiopia (%)
Place of birth for the foreign-born population - Kenya (%)
Place of birth for the foreign-born population - Somalia (%)
Place of birth for the foreign-born population - Uganda (%)
Place of birth for the foreign-born population - Zimbabwe (%)
Place of birth for the foreign-born population - Other Eastern Africa (%)
Place of birth for the foreign-born population - Cameroon (%)
Place of birth for the foreign-born population - Congo (%)
Place of birth for the foreign-born population - Democratic Republic of Congo (Zaire) (%)
Place of birth for the foreign-born population - Other Middle Africa (%)
Place of birth for the foreign-born population - Egypt (%)
Place of birth for the foreign-born population - Morocco (%)
Place of birth for the foreign-born population - Sudan (%)
Place of birth for the foreign-born population - Other Northern Africa (%)
Place of birth for the foreign-born population - South Africa (%)
Place of birth for the foreign-born population - Other Southern Africa (%)
Place of birth for the foreign-born population - Cabo Verde (%)
Place of birth for the foreign-born population - Ghana (%)
Place of birth for the foreign-born population - Liberia (%)
Place of birth for the foreign-born population - Nigeria (%)
Place of birth for the foreign-born population - Senegal (%)
Place of birth for the foreign-born population - Sierra Leone (%)
Place of birth for the foreign-born population - Other Western Africa (%)
Place of birth for the foreign-born population - Australia (%)
Place of birth for the foreign-born population - New Zealand (%)
Place of birth for the foreign-born population - Fiji (%)
Place of birth for the foreign-born population - Micronesia (%)
Place of birth for the foreign-born population - Bahamas (%)
Place of birth for the foreign-born population - Barbados (%)
Place of birth for the foreign-born population - Cuba (%)
Place of birth for the foreign-born population - Dominica (%)
Place of birth for the foreign-born population - Dominican Republic (%)
Place of birth for the foreign-born population - Grenada (%)
Place of birth for the foreign-born population - Haiti (%)
Place of birth for the foreign-born population - Jamaica (%)
Place of birth for the foreign-born population - St. Vincent and the Grenadines (%)
Place of birth for the foreign-born population - Trinidad and Tobago (%)
Place of birth for the foreign-born population - West Indies (%)
Place of birth for the foreign-born population - Other Caribbean (%)
Place of birth for the foreign-born population - Belize (%)
Place of birth for the foreign-born population - Costa Rica (%)
Place of birth for the foreign-born population - El Salvador (%)
Place of birth for the foreign-born population - Guatemala (%)
Place of birth for the foreign-born population - Honduras (%)
Place of birth for the foreign-born population - Mexico (%)
Place of birth for the foreign-born population - Nicaragua (%)
Place of birth for the foreign-born population - Panama (%)
Place of birth for the foreign-born population - Other Central America (%)
Place of birth for the foreign-born population - Argentina (%)
Place of birth for the foreign-born population - Bolivia (%)
Place of birth for the foreign-born population - Brazil (%)
Place of birth for the foreign-born population - Chile (%)
Place of birth for the foreign-born population - Colombia (%)
Place of birth for the foreign-born population - Ecuador (%)
Place of birth for the foreign-born population - Guyana (%)
Place of birth for the foreign-born population - Peru (%)
Place of birth for the foreign-born population - Uruguay (%)
Place of birth for the foreign-born population - Venezuela (%)
Place of birth for the foreign-born population - Other South America (%)
Place of birth for the foreign-born population - Canada (%)
Place of birth for the foreign-born population - Other Northern America (%)
Place of birth for the foreign-born population - Other (%)
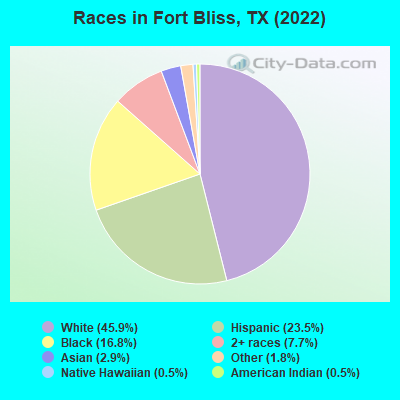
According to 2022 data, the most numerous races in Fort Bliss, TX are Hispanic (2,952 residents), White alone (5,773 residents), and Black alone (2,115 residents). 82.9% of Fort Bliss residents speak English at home. 5.4% of Fort Bliss, TX residents are foreign-born (3.0% born in Latin America, 1.3% born in Asia, 0.7% born in Africa), which is 216.4% less than the foreign-born rate of 17.0% across the entire state of Texas.
Race distribution in Fort Bliss
2000 2022
10,933,313 52.4% White alone 6,669,666 32.0% Hispanic 2,364,255 11.3% Black alone 554,445 2.7% Asian alone 230,567 1.1% Two or more races 68,859 0.3% American Indian alone 19,958 0.10% Other race alone 10,757 0.05% Native Hawaiian and Other
12,070,642 40.2% Hispanic 11,683,430 38.9% White alone 3,508,706 11.7% Black alone 1,608,173 5.4% Asian alone 956,560 3.2% Two or more races 125,763 0.4% Other race alone 47,023 0.2% American Indian alone 29,275 0.10% Native Hawaiian and Other
Income and house value in Fort Bliss Median household income in 2022 $59,024 White non-Hispanic householders$50,063 Black householders$59,402 Asian householders$34,049 Some other race householders$46,841 Two or more races householders$48,612 Hispanic or Latino race householdersMedian 2022 house value $-660,432,704 White Non-Hispanic householders$-780,511,378 Hispanic or Latino householders
Median age by race in Fort Bliss
22.5 Median age for White residents23.2 21.9 22.8 Median age for Black or African American residents23.9 18.3 17.4 Median age for American Indian / Alaska Native residents21.3 23.7 24.5 Median age for Asian residents26.4 21.9 21.0 Median age for Native Hawaiian / Pacific Islander residents22.3 -577,777,777.2 20.5 Median age for Other race residents20.9 20.5 19.1 Median age for Two or more races residents20.4 15.7 23.1 Median age for White alone residents23.2 23.3 21.3 Median age for Hispanic or Latino residents21.2 21.6
Owner/renter occupied households by race in Fort Bliss
House owners and renters - White residents 913 100.0% Renter occupiedHouse owners and renters - Black or African American residents 436 100.0% Renter occupiedHouse owners and renters - American Indian / Alaska Native residents 52 100.0% Renter occupiedHouse owners and renters - Asian residents 47 100.0% Renter occupiedHouse owners and renters - Native Hawaiian / Pacific Islander residents 18 100.0% Renter occupiedHouse owners and renters - Other race residents 121 100.0% Renter occupiedHouse owners and renters - Two or more races residents 342 100.0% Renter occupiedHouse owners and renters - White alone residents 1,158 100.0% Renter occupiedHouse owners and renters - Hispanic or Latino residents 550 100.0% Renter occupied
Language usage in Fort Bliss
English speakers - Total 82.9% of residents of Fort Bliss speak English at home.
10.8% of residents speak Spanish at home 546 45.8% Speak English very well646 54.2% Speak English less than very well6.9% of residents speak other language at home 496 64.9% Speak English very well268 35.1% Speak English less than very well
English speakers - Born in the United States 90.8% of residents of Fort Bliss speak English at home.
5.5% of residents speak Spanish at home 281 66.1% Speak English very well144 33.9% Speak English less than very well5.2% of residents speak other language at home 129 32.2% Speak English very well272 67.8% Speak English less than very well
English speakers - Native, born elsewhere 37.1% of residents of Fort Bliss speak English at home.
38.8% of residents speak Spanish at home 56 29.5% Speak English very well134 70.5% Speak English less than very well27.6% of residents speak other language at home 88 65.2% Speak English very well47 34.8% Speak English less than very well
English speakers - Foreign-born 38.4% of residents of Fort Bliss speak English at home.
31.8% of residents speak Spanish at home 120 56.6% Speak English very well92 43.4% Speak English less than very well42.8% of residents speak other language at home 239 83.9% Speak English very well46 16.1% Speak English less than very well
White (Caucasian) - Speak only English Native:
100.0% (3,665)Foreign-born:
19.2% (9)
White (Caucasian) - Speak another language Native:
8.4% (307)Foreign-born:
75.9% (37)
Black or African American - Speak only English Native:
95.1% (1,744)Foreign-born:
52.1% (173)
Black or African American - Speak another language Native:
4.6% (84)Foreign-born:
19.1% (64)
Asian - Speak only English Native:
54.1% (84)Foreign-born:
9.0% (16)
Asian - Speak another language Native:
45.6% (71)Foreign-born:
90.1% (159)
Native Hawaiian / Pacific Islander - Speak only English Native:
98.9% (60)Foreign-born:
51.5% (9)
Other race - Speak another language Native:
61.3% (426)Foreign-born:
98.0% (75)
Two or more races - Speak only English Native:
76.8% (2,040)Foreign-born:
12.7% (13)
Two or more races - Speak another language Native:
14.6% (388)Foreign-born:
84.9% (90)
White alone - Speak another language Native:
3.3% (161)Foreign-born:
100.0% (14)
Hispanic or Latino - Speak only English Native:
61.2% (1,504)Foreign-born:
6.9% (15)
Hispanic or Latino - Speak another language Native:
39.3% (965)Foreign-born:
93.2% (207)
Foreign-born residents in Fort Bliss 676 residents are foreign born (3.0% Latin America , 1.3% Asia , 0.7% Africa ).
This city:
5.4%Texas:
17.1%
Marital status for residents in Fort Bliss Marital status - White (Caucasian) population 15 years and over
Males 47.0% Never married50.0% Now married0.0% Separated0.0% Widowed2.9% DivorcedFemales 12.2% Never married84.8% Now married1.2% Separated0.6% Widowed1.2% DivorcedWomen who gave birth in the past 12 months Now married:
100.0% (56)Unmarried:
0.0% (0)
Women who did not give birth in the past 12 months Now married:
85.0% (643)Unmarried:
15.0% (113)
Marital status - Black or African American population 15 years and over
Males 50.0% Never married45.8% Now married0.0% Separated0.0% Widowed4.2% DivorcedFemales 51.9% Never married44.6% Now married0.0% Separated0.0% Widowed3.4% DivorcedWomen who gave birth in the past 12 months Now married:
100.0% (63)Unmarried:
0.0% (0)
Women who did not give birth in the past 12 months Now married:
37.3% (169)Unmarried:
62.7% (284)
Marital status - American Indian / Alaska Native population 15 years and over
Males 84.6% Never married15.4% Now married0.0% Separated0.0% Widowed0.0% DivorcedFemales 36.8% Never married63.2% Now married0.0% Separated0.0% Widowed0.0% DivorcedWomen who gave birth in the past 12 months Now married:
0.0% (0)Unmarried:
100.0% (20)
Women who did not give birth in the past 12 months Now married:
100.0% (34)Unmarried:
0.0% (0)
Marital status - Asian population 15 years and over
Males 70.3% Never married29.7% Now married0.0% Separated0.0% Widowed0.0% DivorcedFemales 27.4% Never married72.6% Now married0.0% Separated0.0% Widowed0.0% DivorcedWomen who gave birth in the past 12 months Now married:
100.0% (29)Unmarried:
0.0% (0)
Women who did not give birth in the past 12 months Now married:
65.1% (68)Unmarried:
34.9% (37)
Marital status - Native Hawaiian / Pacific Islander population 15 years and over
Males 100.0% Never married0.0% Now married0.0% Separated0.0% Widowed0.0% DivorcedFemales 0.0% Never married100.0% Now married0.0% Separated0.0% Widowed0.0% DivorcedWomen who did not give birth in the past 12 months Now married:
100.0% (18)Unmarried:
0.0% (0)
Marital status - Other race population 15 years and over
Males 65.3% Never married34.7% Now married0.0% Separated0.0% Widowed0.0% DivorcedFemales 12.9% Never married87.1% Now married0.0% Separated0.0% Widowed0.0% DivorcedWomen who gave birth in the past 12 months Now married:
100.0% (7)Unmarried:
0.0% (0)
Women who did not give birth in the past 12 months Now married:
86.4% (115)Unmarried:
13.6% (18)
Marital status - Two or more races population 15 years and over
Males 67.3% Never married32.7% Now married0.0% Separated0.0% Widowed0.0% DivorcedFemales 26.4% Never married73.2% Now married0.0% Separated0.4% Widowed0.0% DivorcedWomen who gave birth in the past 12 months Now married:
100.0% (42)Unmarried:
0.0% (0)
Women who did not give birth in the past 12 months Now married:
71.1% (480)Unmarried:
28.9% (195)
Marital status - White alone, not Hispanic / Latino population 15 years and over
Males 45.9% Never married50.6% Now married0.0% Separated0.0% Widowed3.4% DivorcedFemales 12.4% Never married85.7% Now married0.0% Separated0.8% Widowed1.1% DivorcedWomen who gave birth in the past 12 months Now married:
100.0% (78)Unmarried:
0.0% (0)
Women who did not give birth in the past 12 months Now married:
85.0% (975)Unmarried:
15.0% (172)
Marital status - Hispanic or Latino population 15 years and over
Males 57.4% Never married42.6% Now married0.0% Separated0.0% Widowed0.0% DivorcedFemales 17.3% Never married79.2% Now married2.9% Separated0.0% Widowed0.6% DivorcedWomen who gave birth in the past 12 months Now married:
100.0% (23)Unmarried:
0.0% (0)
Women who did not give birth in the past 12 months Now married:
80.9% (471)Unmarried:
19.1% (111)
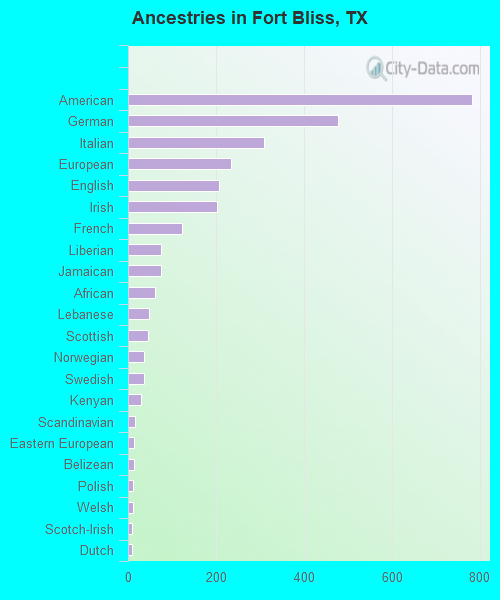
Ancestries in Fort Bliss
782 11.6% American478 7.1% German309 4.6% Italian234 3.5% European207 3.1% English202 3.0% Irish123 1.8% French76 1.1% Liberian76 1.1% Jamaican62 0.9% African47 0.7% Lebanese45 0.7% Scottish36 0.5% Norwegian36 0.5% Swedish29 0.4% Kenyan15 0.2% Scandinavian14 0.2% Eastern European13 0.2% Belizean12 0.2% Polish11 0.2% Welsh10 0.1% Scotch-Irish8 0.1% Dutch7 0.1% Brazilian7 0.1% Swiss5 0.07% Belgian5 0.07% Hungarian5 0.07% Nigerian4 0.06% Luxembourger3 0.04% Czechoslovakian
Geographical mobility in Fort Bliss Same house 1 year ago 2,266 58.1% White (Caucasian)1,209 50.9% Black or African American45 16.7% American Indian / Alaska Native176 49.9% Asian384 49.2% Other race2,194 68.9% Two or more races3,484 61.7% White alone, not Hispanic / Latino1,587 54.6% Hispanic or LatinoMoved within same county 178 4.6% White / Caucasian108 4.6% Black or African American71 26.6% American Indian / Alaska Native5 1.5% Asian99 3.1% Two or more races202 3.6% White alone, not Hispanic / Latino164 5.7% Hispanic or LatinoMoved within same state 229 5.9% White / Caucasian326 13.7% Black or African American13 3.7% Asian49 6.3% Other race42 1.3% Two or more races65 1.2% White alone, not Hispanic / Latino262 9.0% Hispanic or LatinoMoved from different state 1,458 37.4% White / Caucasian498 21.0% Black or African American127 47.4% American Indian / Alaska Native39 11.0% Asian145 100.0% Native Hawaiian / Pacific Islander327 41.9% Other race482 15.2% Two or more races1,535 27.2% White alone, not Hispanic / Latino574 19.7% Hispanic or LatinoMoved from abroad 282 7.2% White21 0.9% Black or African American55 20.6% American Indian / Alaska Native123 34.9% Asian32 4.1% Other race76 2.4% Two or more races378 6.7% White alone, not Hispanic / Latino95 3.3% Hispanic or Latino
Children Nativity (place of birth) in Fort Bliss
Children under 6 years - Living with two parents Both parents native 1,587 100.0% NativeBoth parents foreign-born 69 100.0% NativeOne native, one foreign-born parent 74 100.0% NativeChildren under 6 years - Living with one parent Native parent 72 100.0% NativeChildren 6 to 17 years - Living with two parents Both parents native 1,697 99.6% Native6 0.4% Foreign-bornBoth parents foreign-born 224 93.5% Native16 6.5% Foreign-bornOne native, one foreign-born parent 190 100.0% NativeChildren 6 to 17 years - Living with one parent Native parent 101 100.0% Native
Grandparents responsible for own grandchildren in Fort Bliss
Grandparents (30 to 59 years) Black or African American 16 100.0% Not responsible for grandchildrenOther race 6 100.0% Responsible for grandchildrenHispanic or Latino 6 100.0% Responsible for grandchildren
Grandparents (60 years and over) Black or African American 14 100.0% Not responsible for grandchildrenHispanic or Latino 19 100.0% Not responsible for grandchildren