Races in Fern Creek, Kentucky (KY) Detailed Stats
Ancestries, Foreign-born residents, place of birth

Recent posts about races in Fern Creek, Kentucky on our local forum with over 2,400,000 registered users:
 | Home prices - can we even afford a house in a nice are of Louisville? (22 replies) |
| Possible relocation to Louisville... (5 replies) |
| Moving to Louisville from Argentina next year (125 replies) |
| House Hunting in Louisville (2 replies) |
| NEWCOMERS please read before posting so we may assist you in your move (170 replies) |
| Eastern Parkway, a block from U of L; nice area? (29 replies) |
2.7% of Fern Creek, KY residents are foreign-born (1.3% born in Asia, 1.0% born in Latin America, 0.4% born in Europe), which is 45.9% less than the foreign-born rate of 4.0% across the entire state of Kentucky.
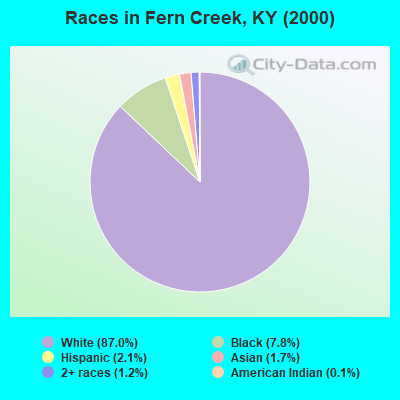
Race distribution in Fern Creek

- 15,54587.0%White alone
- 1,3857.8%Black alone
- 3692.1%Hispanic
- 3051.7%Asian alone
- 2231.2%Two or more races
- 240.1%American Indian alone
- 160.09%Other race alone
- 30.02%Native Hawaiian and Other
Pacific Islander alone
2000
2022
-
- 3,608,01389.3%White alone
- 293,6397.3%Black alone
- 59,9391.5%Hispanic
- 37,7500.9%Two or more races
- 29,3680.7%Asian alone
- 7,9390.2%American Indian alone
- 3,8460.10%Other race alone
- 1,2750.03%Native Hawaiian and Other
Pacific Islander alone

-
- 3,710,99882.2%White alone
- 343,1947.6%Black alone
- 187,4834.2%Hispanic
- 187,3944.2%Two or more races
- 62,2401.4%Asian alone
- 13,5290.3%Other race alone
- 4,3020.10%American Indian alone
- 3,1700.07%Native Hawaiian and Other
Pacific Islander alone

Income and house value in Fern Creek
- Median household income in 2022
- $90,934White non-Hispanic householders
- $93,682Black householders
- $129,326American Indian and Alaska Native householders
- $81,282Asian householders
- $110,992Some other race householders
- $50,422Two or more races householders
- $88,818Hispanic or Latino race householders
- Median 2022 house value
- $272,298White Non-Hispanic householders
- $266,274Black or African American householders
- $257,599Asian householders
- $271,093Some other race householders
- $331,336Two or more races householders
- $258,804Hispanic or Latino householders
Household income for White non-Hispanic householders

Household income for Black householders

Household income for American Indian and Alaska Native householders

Household income for Asian householders

Household income for Two or more races householders

Household income for Hispanic or Latino race householders

Foreign-born residents in Fern Creek
490 residents are foreign born (1.3% Asia, 1.0% Latin America, 0.4% Europe).
| This city: | 2.7% |
| Kentucky: | 2.0% |
Ancestries in Fern Creek

- 4,52024.4%German
- 3,37718.2%Other
- 3,18617.2%Irish
- 2,07511.2%English
- 2,03511.0%United States
- 5483.0%Scottish
- 5102.8%French
- 4702.5%Italian
- 4162.2%Dutch
- 2421.3%Scotch-Irish
- 2361.3%Polish
- 1100.6%Swedish
- 860.5%Swiss
- 820.4%Arab
- 800.4%Subsaharan African
- 780.4%French Canadian
- 760.4%Russian
- 720.4%Welsh
- 690.4%Norwegian
- 520.3%Czech
- 480.3%Ukrainian
- 450.2%Hungarian
- 420.2%Danish
- 270.1%Greek
- 180.10%Slovak
- 70.04%Lithuanian

Zip codes: 40291.