Races in Elgin, Texas (TX) Detailed Stats
Data:
Races - White alone (%)
Races - White alone (% change since 2000)
Races - Black alone (%)
Races - Black alone (% change since 2000)
Races - American Indian alone (%)
Races - American Indian alone (% change since 2000)
Races - Asian alone (%)
Races - Asian alone (% change since 2000)
Races - Hispanic (%)
Races - Hispanic (% change since 2000)
Races - Native Hawaiian and Other Pacific Islander alone (%)
Races - Native Hawaiian and Other Pacific Islander alone (% change since 2000)
Races - Two or more races(%)
Races - Two or more races(% change since 2000)
Races - Other race alone (%)
Races - Other race alone (% change since 2000)
Racial diversity
Place of birth - Born in state of residence (%)
Place of birth - Born in state of residence (%) - White
Place of birth - Born in state of residence (%) - Black or African American
Place of birth - Born in state of residence (%) - Asian
Place of birth - Born in state of residence (%) - Hispanic or Latino
Place of birth - Born in state of residence (%) - American Indian and Alaska Native
Place of birth - Born in state of residence (%) - Multirace
Place of birth - Born in state of residence (%) - Other Race
Place of birth - Born in other state (%)
Place of birth - Born in other state (%) - White
Place of birth - Born in other state (%) - Black or African American
Place of birth - Born in other state (%) - Asian
Place of birth - Born in other state (%) - Hispanic or Latino
Place of birth - Born in other state (%) - American Indian and Alaska Native
Place of birth - Born in other state (%) - Multirace
Place of birth - Born in other state (%) - Other Race
Place of birth - Native, outside of US (%)
Place of birth - Native, outside of US (%) - White
Place of birth - Native, outside of US (%) - Black or African American
Place of birth - Native, outside of US (%) - Asian
Place of birth - Native, outside of US (%) - Hispanic or Latino
Place of birth - Native, outside of US (%) - American Indian and Alaska Native
Place of birth - Native, outside of US (%) - Multirace
Place of birth - Native, outside of US (%) - Other Race
Place of birth - Foreign born (%)
Place of birth - Foreign born (%) - White
Place of birth - Foreign born (%) - Black or African American
Place of birth - Foreign born (%) - Asian
Place of birth - Foreign born (%) - Hispanic or Latino
Place of birth - Foreign born (%) - American Indian and Alaska Native
Place of birth - Foreign born (%) - Multirace
Place of birth - Foreign born (%) - Other Race
Residents speaking English at home (%)
Residents speaking English at home - Born in the United States (%)
Residents speaking English at home - Native, born elsewhere (%)
Residents speaking English at home - Foreign born (%)
Residents speaking Spanish at home (%)
Residents speaking Spanish at home - Born in the United States (%)
Residents speaking Spanish at home - Native, born elsewhere (%)
Residents speaking Spanish at home - Foreign born (%)
Residents speaking other language at home (%)
Residents speaking other language at home - Born in the United States (%)
Residents speaking other language at home - Native, born elsewhere (%)
Residents speaking other language at home - Foreign born (%)
Marital status - Never married (%)
Marital status - Now married (%)
Marital status - Separated (%)
Marital status - Widowed (%)
Marital status - Divorced (%)
Ancestries Reported - Arab (%)
Ancestries Reported - Czech (%)
Ancestries Reported - Danish (%)
Ancestries Reported - Dutch (%)
Ancestries Reported - English (%)
Ancestries Reported - French (%)
Ancestries Reported - French Canadian (%)
Ancestries Reported - German (%)
Ancestries Reported - Greek (%)
Ancestries Reported - Hungarian (%)
Ancestries Reported - Irish (%)
Ancestries Reported - Italian (%)
Ancestries Reported - Lithuanian (%)
Ancestries Reported - Norwegian (%)
Ancestries Reported - Polish (%)
Ancestries Reported - Portuguese (%)
Ancestries Reported - Russian (%)
Ancestries Reported - Scotch-Irish (%)
Ancestries Reported - Scottish (%)
Ancestries Reported - Slovak (%)
Ancestries Reported - Subsaharan African (%)
Ancestries Reported - Swedish (%)
Ancestries Reported - Swiss (%)
Ancestries Reported - Ukrainian (%)
Ancestries Reported - United States (%)
Ancestries Reported - Welsh (%)
Ancestries Reported - West Indian (%)
Ancestries Reported - Other (%)
Geographical mobility - Same house 1 year ago (%)
Geographical mobility - Same house 1 year ago (%) - White
Geographical mobility - Same house 1 year ago (%) - Black or African American
Geographical mobility - Same house 1 year ago (%) - Asian
Geographical mobility - Same house 1 year ago (%) - Hispanic or Latino
Geographical mobility - Same house 1 year ago (%) - American Indian and Alaska Native
Geographical mobility - Same house 1 year ago (%) - Multirace
Geographical mobility - Same house 1 year ago (%) - Other Race
Geographical mobility - Moved within same county (%)
Geographical mobility - Moved within same county (%) - White
Geographical mobility - Moved within same county (%) - Black or African American
Geographical mobility - Moved within same county (%) - Asian
Geographical mobility - Moved within same county (%) - Hispanic or Latino
Geographical mobility - Moved within same county (%) - American Indian and Alaska Native
Geographical mobility - Moved within same county (%) - Multirace
Geographical mobility - Moved within same county (%) - Other Race
Geographical mobility - Moved from different county within same state (%)
Geographical mobility - Moved from different county within same state (%) - White
Geographical mobility - Moved from different county within same state (%) - Black or African American
Geographical mobility - Moved from different county within same state (%) - Asian
Geographical mobility - Moved from different county within same state (%) - Hispanic or Latino
Geographical mobility - Moved from different county within same state (%) - American Indian and Alaska Native
Geographical mobility - Moved from different county within same state (%) - Multirace
Geographical mobility - Moved from different county within same state (%) - Other Race
Geographical mobility - Moved from different state (%)
Geographical mobility - Moved from different state (%) - White
Geographical mobility - Moved from different state (%) - Black or African American
Geographical mobility - Moved from different state (%) - Asian
Geographical mobility - Moved from different state (%) - Hispanic or Latino
Geographical mobility - Moved from different state (%) - American Indian and Alaska Native
Geographical mobility - Moved from different state (%) - Multirace
Geographical mobility - Moved from different state (%) - Other Race
Geographical mobility - Moved from abroad (%)
Geographical mobility - Moved from abroad (%) - White
Geographical mobility - Moved from abroad (%) - Black or African American
Geographical mobility - Moved from abroad (%) - Asian
Geographical mobility - Moved from abroad (%) - Hispanic or Latino
Geographical mobility - Moved from abroad (%) - American Indian and Alaska Native
Geographical mobility - Moved from abroad (%) - Multirace
Geographical mobility - Moved from abroad (%) - Other Race
Place of birth for the foreign-born population - Ireland (%)
Place of birth for the foreign-born population - Denmark (%)
Place of birth for the foreign-born population - Norway (%)
Place of birth for the foreign-born population - Sweden (%)
Place of birth for the foreign-born population - United Kingdom (%)
Place of birth for the foreign-born population - England (%)
Place of birth for the foreign-born population - Scotland (%)
Place of birth for the foreign-born population - Other Northern Europe (%)
Place of birth for the foreign-born population - Austria (%)
Place of birth for the foreign-born population - Belgium (%)
Place of birth for the foreign-born population - France (%)
Place of birth for the foreign-born population - Germany (%)
Place of birth for the foreign-born population - Netherlands (%)
Place of birth for the foreign-born population - Switzerland (%)
Place of birth for the foreign-born population - Other Western Europe (%)
Place of birth for the foreign-born population - Greece (%)
Place of birth for the foreign-born population - Italy (%)
Place of birth for the foreign-born population - Portugal (%)
Place of birth for the foreign-born population - Spain (%)
Place of birth for the foreign-born population - Other Southern Europe (%)
Place of birth for the foreign-born population - Albania (%)
Place of birth for the foreign-born population - Belarus (%)
Place of birth for the foreign-born population - Bosnia and Herzegovina (%)
Place of birth for the foreign-born population - Bulgaria (%)
Place of birth for the foreign-born population - Croatia (%)
Place of birth for the foreign-born population - Czechoslovakia (%)
Place of birth for the foreign-born population - Hungary (%)
Place of birth for the foreign-born population - Latvia (%)
Place of birth for the foreign-born population - Lithuania (%)
Place of birth for the foreign-born population - North Macedonia (Macedonia) (%)
Place of birth for the foreign-born population - Moldova (%)
Place of birth for the foreign-born population - Poland (%)
Place of birth for the foreign-born population - Romania (%)
Place of birth for the foreign-born population - Russia (%)
Place of birth for the foreign-born population - Serbia (%)
Place of birth for the foreign-born population - Ukraine (%)
Place of birth for the foreign-born population - Other Eastern Europe (%)
Place of birth for the foreign-born population - China (%)
Place of birth for the foreign-born population - Hong Kong (%)
Place of birth for the foreign-born population - Taiwan (%)
Place of birth for the foreign-born population - Japan (%)
Place of birth for the foreign-born population - Korea (%)
Place of birth for the foreign-born population - Other Eastern Asia (%)
Place of birth for the foreign-born population - Afghanistan (%)
Place of birth for the foreign-born population - Bangladesh (%)
Place of birth for the foreign-born population - India (%)
Place of birth for the foreign-born population - Iran (%)
Place of birth for the foreign-born population - Kazakhstan (%)
Place of birth for the foreign-born population - Nepal (%)
Place of birth for the foreign-born population - Pakistan (%)
Place of birth for the foreign-born population - Sri Lanka (%)
Place of birth for the foreign-born population - Uzbekistan (%)
Place of birth for the foreign-born population - Other South Central Asia (%)
Place of birth for the foreign-born population - Burma (%)
Place of birth for the foreign-born population - Cambodia (%)
Place of birth for the foreign-born population - Indonesia (%)
Place of birth for the foreign-born population - Laos (%)
Place of birth for the foreign-born population - Malaysia (%)
Place of birth for the foreign-born population - Philippines (%)
Place of birth for the foreign-born population - Singapore (%)
Place of birth for the foreign-born population - Thailand (%)
Place of birth for the foreign-born population - Vietnam (%)
Place of birth for the foreign-born population - Other South Eastern Asia (%)
Place of birth for the foreign-born population - Armenia (%)
Place of birth for the foreign-born population - Iraq (%)
Place of birth for the foreign-born population - Israel (%)
Place of birth for the foreign-born population - Jordan (%)
Place of birth for the foreign-born population - Kuwait (%)
Place of birth for the foreign-born population - Lebanon (%)
Place of birth for the foreign-born population - Saudi Arabia (%)
Place of birth for the foreign-born population - Syria (%)
Place of birth for the foreign-born population - Turkey (%)
Place of birth for the foreign-born population - Yemen (%)
Place of birth for the foreign-born population - Other Western Asia (%)
Place of birth for the foreign-born population - Eritrea (%)
Place of birth for the foreign-born population - Ethiopia (%)
Place of birth for the foreign-born population - Kenya (%)
Place of birth for the foreign-born population - Somalia (%)
Place of birth for the foreign-born population - Uganda (%)
Place of birth for the foreign-born population - Zimbabwe (%)
Place of birth for the foreign-born population - Other Eastern Africa (%)
Place of birth for the foreign-born population - Cameroon (%)
Place of birth for the foreign-born population - Congo (%)
Place of birth for the foreign-born population - Democratic Republic of Congo (Zaire) (%)
Place of birth for the foreign-born population - Other Middle Africa (%)
Place of birth for the foreign-born population - Egypt (%)
Place of birth for the foreign-born population - Morocco (%)
Place of birth for the foreign-born population - Sudan (%)
Place of birth for the foreign-born population - Other Northern Africa (%)
Place of birth for the foreign-born population - South Africa (%)
Place of birth for the foreign-born population - Other Southern Africa (%)
Place of birth for the foreign-born population - Cabo Verde (%)
Place of birth for the foreign-born population - Ghana (%)
Place of birth for the foreign-born population - Liberia (%)
Place of birth for the foreign-born population - Nigeria (%)
Place of birth for the foreign-born population - Senegal (%)
Place of birth for the foreign-born population - Sierra Leone (%)
Place of birth for the foreign-born population - Other Western Africa (%)
Place of birth for the foreign-born population - Australia (%)
Place of birth for the foreign-born population - New Zealand (%)
Place of birth for the foreign-born population - Fiji (%)
Place of birth for the foreign-born population - Micronesia (%)
Place of birth for the foreign-born population - Bahamas (%)
Place of birth for the foreign-born population - Barbados (%)
Place of birth for the foreign-born population - Cuba (%)
Place of birth for the foreign-born population - Dominica (%)
Place of birth for the foreign-born population - Dominican Republic (%)
Place of birth for the foreign-born population - Grenada (%)
Place of birth for the foreign-born population - Haiti (%)
Place of birth for the foreign-born population - Jamaica (%)
Place of birth for the foreign-born population - St. Vincent and the Grenadines (%)
Place of birth for the foreign-born population - Trinidad and Tobago (%)
Place of birth for the foreign-born population - West Indies (%)
Place of birth for the foreign-born population - Other Caribbean (%)
Place of birth for the foreign-born population - Belize (%)
Place of birth for the foreign-born population - Costa Rica (%)
Place of birth for the foreign-born population - El Salvador (%)
Place of birth for the foreign-born population - Guatemala (%)
Place of birth for the foreign-born population - Honduras (%)
Place of birth for the foreign-born population - Mexico (%)
Place of birth for the foreign-born population - Nicaragua (%)
Place of birth for the foreign-born population - Panama (%)
Place of birth for the foreign-born population - Other Central America (%)
Place of birth for the foreign-born population - Argentina (%)
Place of birth for the foreign-born population - Bolivia (%)
Place of birth for the foreign-born population - Brazil (%)
Place of birth for the foreign-born population - Chile (%)
Place of birth for the foreign-born population - Colombia (%)
Place of birth for the foreign-born population - Ecuador (%)
Place of birth for the foreign-born population - Guyana (%)
Place of birth for the foreign-born population - Peru (%)
Place of birth for the foreign-born population - Uruguay (%)
Place of birth for the foreign-born population - Venezuela (%)
Place of birth for the foreign-born population - Other South America (%)
Place of birth for the foreign-born population - Canada (%)
Place of birth for the foreign-born population - Other Northern America (%)
Place of birth for the foreign-born population - Other (%)
Latest news about races in Elgin, TX collected exclusively by city-data.com from local newspapers, TV, and radio stations
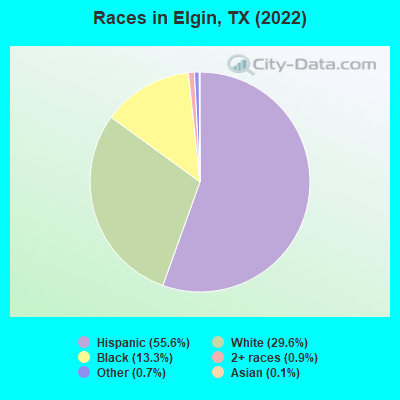
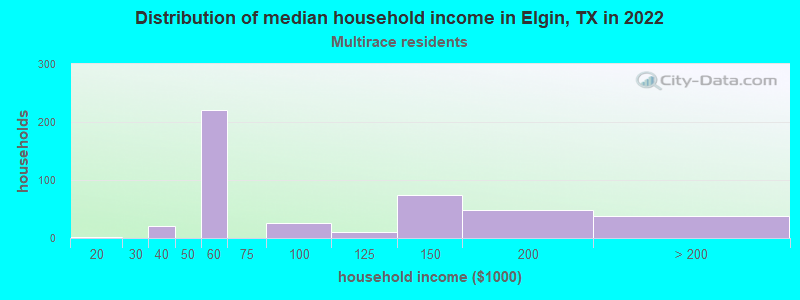
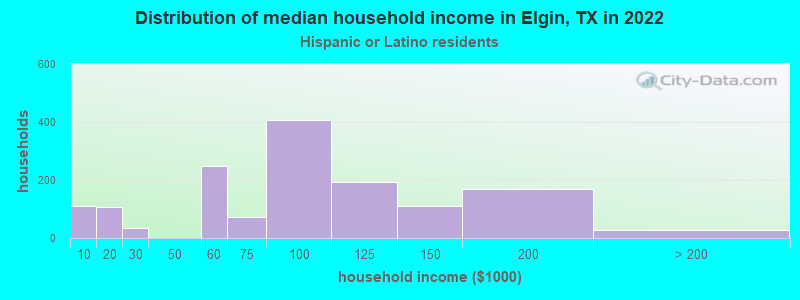
According to 2022 data, the most numerous races in Elgin, TX are Hispanic (6,025 residents), White alone (3,209 residents), and Black alone (1,442 residents). 60.7% of Elgin residents speak English at home. 15.7% of Elgin, TX residents are foreign-born (15.7% born in Latin America), which is 8.6% less than the foreign-born rate of 17.0% across the entire state of Texas.
Race distribution in Elgin
2000 2022
10,933,313 52.4% White alone 6,669,666 32.0% Hispanic 2,364,255 11.3% Black alone 554,445 2.7% Asian alone 230,567 1.1% Two or more races 68,859 0.3% American Indian alone 19,958 0.10% Other race alone 10,757 0.05% Native Hawaiian and Other
12,070,642 40.2% Hispanic 11,683,430 38.9% White alone 3,508,706 11.7% Black alone 1,608,173 5.4% Asian alone 956,560 3.2% Two or more races 125,763 0.4% Other race alone 47,023 0.2% American Indian alone 29,275 0.10% Native Hawaiian and Other
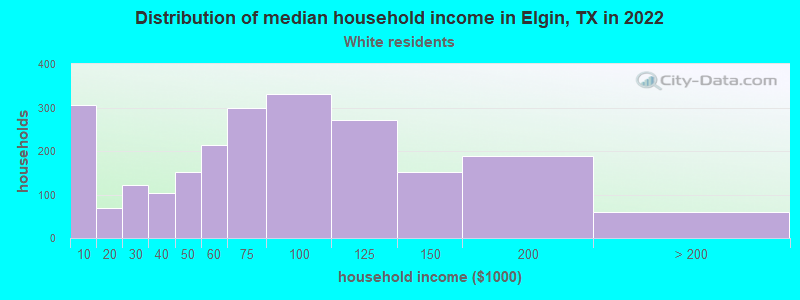
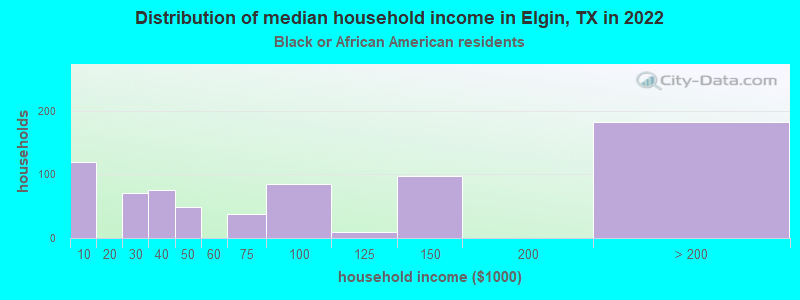
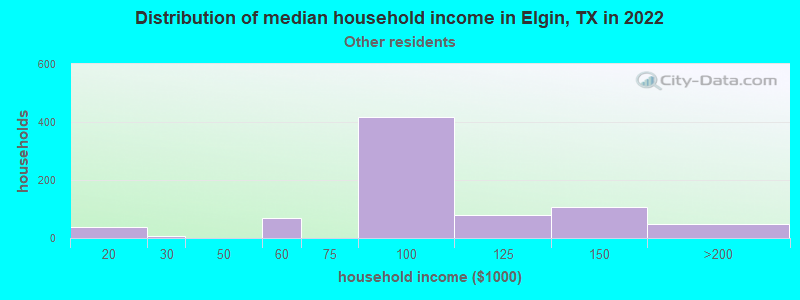
Income and house value in Elgin Median household income in 2022 $68,205 White non-Hispanic householders$85,853 Black householders$95,474 Some other race householders$74,884 Hispanic or Latino race householdersMedian 2022 house value $375,913 White Non-Hispanic householders$210,816 Black or African American householders$74,082 American Indian or Alaska Native householders$168,483 Some other race householders$341,201 Two or more races householders$239,179 Hispanic or Latino householders
Median age by race in Elgin
35.1 Median age for White residents35.3 35.3 39.6 Median age for Black or African American residents19.9 56.1 28.5 Median age for American Indian / Alaska Native residents-682,445,758.7 34.0 -671,111,110.4 Median age for Asian residents-516,539,439.7 -988,988,988.0 -666,666,666.0 Median age for Native Hawaiian / Pacific Islander residents-666,666,666.0 -666,666,666.0 35.9 Median age for Other race residents36.5 44.4 21.9 Median age for Two or more races residents20.1 19.0 39.6 Median age for White alone residents35.5 41.5 34.1 Median age for Hispanic or Latino residents35.8 32.5
Owner/renter occupied households by race in Elgin
House owners and renters - White residents 1,200 56.6% Owner occupied919 43.4% Renter occupiedHouse owners and renters - Black or African American residents 356 45.8% Owner occupied422 54.2% Renter occupiedHouse owners and renters - American Indian / Alaska Native residents 25 100.0% Renter occupiedHouse owners and renters - Asian residents 6 100.0% Owner occupiedHouse owners and renters - Other race residents 266 77.5% Owner occupied77 22.5% Renter occupiedHouse owners and renters - Two or more races residents 488 100.0% Owner occupiedHouse owners and renters - White alone residents 928 64.4% Owner occupied512 35.6% Renter occupiedHouse owners and renters - Hispanic or Latino residents 1,103 67.0% Owner occupied543 33.0% Renter occupied
Language usage in Elgin
English speakers - Total 60.7% of residents of Elgin speak English at home.
41.4% of residents speak Spanish at home 1,976 46.9% Speak English very well2,241 53.1% Speak English less than very well0.3% of residents speak other language at home 27 100.0% Speak English less than very well
English speakers - Born in the United States 83.6% of residents of Elgin speak English at home.
8.5% of residents speak Spanish at home 6 4.4% Speak English very well131 95.6% Speak English less than very well
English speakers - Native, born elsewhere 15.2% of residents of Elgin speak English at home.
78.3% of residents speak Spanish at home 72 100.0% Speak English very well
English speakers - Foreign-born 16.2% of residents of Elgin speak English at home.
93.4% of residents speak Spanish at home 193 10.9% Speak English very well1,574 89.1% Speak English less than very well0.3% of residents speak other language at home 5 100.0% Speak English less than very well
White (Caucasian) - Speak only English Native:
79.5% (3,615)Foreign-born:
3.5% (22)
White (Caucasian) - Speak another language Native:
22.5% (1,022)Foreign-born:
100.0% (629)
Black or African American - Speak only English Native:
100.0% (1,360)Foreign-born:
90.7% (14)
American Indian / Alaska Native - Speak another language Native:
100.0% (99)Foreign-born:
98.9% (47)
Other race - Speak only English Native:
54.6% (421)Foreign-born:
70.3% (358)
Other race - Speak another language Native:
50.1% (386)Foreign-born:
72.7% (370)
Two or more races - Speak only English Native:
28.4% (383)Foreign-born:
3.0% (17)
Two or more races - Speak another language Native:
73.7% (995)Foreign-born:
96.7% (551)
White alone - Speak only English Native:
99.4% (2,829)Foreign-born:
78.5% (17)
White alone - Speak another language Native:
0.7% (21)Foreign-born:
21.7% (5)
Hispanic or Latino - Speak only English Native:
36.9% (1,427)Foreign-born:
20.1% (384)
Hispanic or Latino - Speak another language Native:
63.1% (2,440)Foreign-born:
85.5% (1,636)
Foreign-born residents in Elgin 1,696 residents are foreign born (15.7% Latin America ).
This city:
15.7%Texas:
17.1%
Marital status for residents in Elgin Marital status - White (Caucasian) population 15 years and over
Males 32.5% Never married46.1% Now married0.6% Separated1.4% Widowed19.4% DivorcedFemales 22.6% Never married49.4% Now married0.0% Separated6.3% Widowed21.7% DivorcedWomen who gave birth in the past 12 months Now married:
65.3% (35)Unmarried:
34.7% (19)
Women who did not give birth in the past 12 months Now married:
44.5% (539)Unmarried:
55.5% (671)
Marital status - Black or African American population 15 years and over
Males 61.1% Never married38.9% Now married0.0% Separated0.0% Widowed0.0% DivorcedFemales 50.3% Never married7.3% Now married18.9% Separated0.0% Widowed23.4% DivorcedWomen who did not give birth in the past 12 months Now married:
16.2% (61)Unmarried:
83.8% (313)
Marital status - American Indian / Alaska Native population 15 years and over
Males 21.7% Never married78.3% Now married0.0% Separated0.0% Widowed0.0% DivorcedFemales 52.7% Never married47.3% Now married0.0% Separated0.0% Widowed0.0% DivorcedWomen who did not give birth in the past 12 months Now married:
0.0% (0)Unmarried:
100.0% (42)
Marital status - Asian population 15 years and over
Males 0.0% Never married100.0% Now married0.0% Separated0.0% Widowed0.0% DivorcedFemales 0.0% Never married0.0% Now married0.0% Separated100.0% Widowed0.0% DivorcedMarital status - Other race population 15 years and over
Males 44.9% Never married55.1% Now married0.0% Separated0.0% Widowed0.0% DivorcedFemales 26.9% Never married53.2% Now married0.0% Separated1.6% Widowed18.3% DivorcedWomen who did not give birth in the past 12 months Now married:
58.1% (560)Unmarried:
41.9% (404)
Marital status - Two or more races population 15 years and over
Males 47.7% Never married44.6% Now married0.0% Separated0.0% Widowed7.7% DivorcedFemales 53.8% Never married43.0% Now married0.0% Separated3.1% Widowed0.0% DivorcedWomen who did not give birth in the past 12 months Now married:
42.9% (279)Unmarried:
57.1% (372)
Marital status - White alone, not Hispanic / Latino population 15 years and over
Males 32.9% Never married42.4% Now married0.9% Separated0.0% Widowed23.7% DivorcedFemales 24.8% Never married46.2% Now married0.0% Separated7.5% Widowed21.5% DivorcedWomen who gave birth in the past 12 months Now married:
65.3% (31)Unmarried:
34.7% (16)
Women who did not give birth in the past 12 months Now married:
32.9% (203)Unmarried:
67.1% (415)
Marital status - Hispanic or Latino population 15 years and over
Males 40.5% Never married52.4% Now married0.0% Separated1.3% Widowed5.8% DivorcedFemales 28.3% Never married53.3% Now married0.0% Separated2.1% Widowed16.3% DivorcedWomen who did not give birth in the past 12 months Now married:
56.0% (1,071)Unmarried:
44.0% (841)
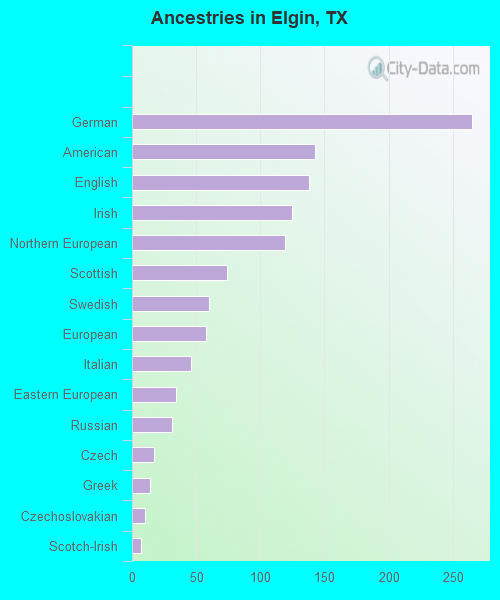
Ancestries in Elgin
265 4.2% German143 2.3% American138 2.2% English125 2.0% Irish119 1.9% Northern European74 1.2% Scottish60 0.9% Swedish58 0.9% European46 0.7% Italian34 0.5% Eastern European31 0.5% Russian17 0.3% Czech14 0.2% Greek10 0.2% Czechoslovakian7 0.1% Scotch-Irish
Geographical mobility in Elgin Same house 1 year ago 4,310 80.5% White (Caucasian)1,065 72.6% Black or African American149 100.0% American Indian / Alaska Native24 99.3% Asian2,891 94.1% Other race1,631 83.8% Two or more races2,681 84.5% White alone, not Hispanic / Latino5,098 85.0% Hispanic or LatinoMoved within same county 540 10.1% White / Caucasian79 5.4% Black or African American22 0.7% Other race100 5.1% Two or more races225 7.1% White alone, not Hispanic / Latino557 9.3% Hispanic or LatinoMoved within same state 544 10.2% White / Caucasian329 22.4% Black or African American160 5.2% Other race179 9.2% Two or more races179 5.6% White alone, not Hispanic / Latino519 8.7% Hispanic or LatinoMoved from different state 11 0.2% White / Caucasian1 0.1% Two or more races11 0.4% White alone, not Hispanic / Latino
Children Nativity (place of birth) in Elgin
Children under 6 years - Living with two parents Both parents native 343 100.0% NativeBoth parents foreign-born 15 100.0% NativeChildren under 6 years - Living with one parent Native parent 326 100.0% NativeForeign-born parent 65 100.0% NativeChildren 6 to 17 years - Living with two parents Both parents native 441 100.0% NativeBoth parents foreign-born 449 100.0% NativeOne native, one foreign-born parent 99 100.0% NativeChildren 6 to 17 years - Living with one parent Native parent 588 100.0% NativeForeign-born parent 32 50.5% Native31 49.5% Foreign-born
Grandparents responsible for own grandchildren in Elgin
Grandparents (30 to 59 years) Other race 171 100.0% Not responsible for grandchildrenHispanic or Latino 131 100.0% Not responsible for grandchildrenGrandparents (60 years and over) Hispanic or Latino 3 6.1% Responsible for grandchildren47 93.9% Not responsible for grandchildren