Races in Del Rio, Texas (TX) Detailed Stats
Data:
Races - White alone (%)
Races - White alone (% change since 2000)
Races - Black alone (%)
Races - Black alone (% change since 2000)
Races - American Indian alone (%)
Races - American Indian alone (% change since 2000)
Races - Asian alone (%)
Races - Asian alone (% change since 2000)
Races - Hispanic (%)
Races - Hispanic (% change since 2000)
Races - Native Hawaiian and Other Pacific Islander alone (%)
Races - Native Hawaiian and Other Pacific Islander alone (% change since 2000)
Races - Two or more races(%)
Races - Two or more races(% change since 2000)
Races - Other race alone (%)
Races - Other race alone (% change since 2000)
Racial diversity
Place of birth - Born in state of residence (%)
Place of birth - Born in state of residence (%) - White
Place of birth - Born in state of residence (%) - Black or African American
Place of birth - Born in state of residence (%) - Asian
Place of birth - Born in state of residence (%) - Hispanic or Latino
Place of birth - Born in state of residence (%) - American Indian and Alaska Native
Place of birth - Born in state of residence (%) - Multirace
Place of birth - Born in state of residence (%) - Other Race
Place of birth - Born in other state (%)
Place of birth - Born in other state (%) - White
Place of birth - Born in other state (%) - Black or African American
Place of birth - Born in other state (%) - Asian
Place of birth - Born in other state (%) - Hispanic or Latino
Place of birth - Born in other state (%) - American Indian and Alaska Native
Place of birth - Born in other state (%) - Multirace
Place of birth - Born in other state (%) - Other Race
Place of birth - Native, outside of US (%)
Place of birth - Native, outside of US (%) - White
Place of birth - Native, outside of US (%) - Black or African American
Place of birth - Native, outside of US (%) - Asian
Place of birth - Native, outside of US (%) - Hispanic or Latino
Place of birth - Native, outside of US (%) - American Indian and Alaska Native
Place of birth - Native, outside of US (%) - Multirace
Place of birth - Native, outside of US (%) - Other Race
Place of birth - Foreign born (%)
Place of birth - Foreign born (%) - White
Place of birth - Foreign born (%) - Black or African American
Place of birth - Foreign born (%) - Asian
Place of birth - Foreign born (%) - Hispanic or Latino
Place of birth - Foreign born (%) - American Indian and Alaska Native
Place of birth - Foreign born (%) - Multirace
Place of birth - Foreign born (%) - Other Race
Residents speaking English at home (%)
Residents speaking English at home - Born in the United States (%)
Residents speaking English at home - Native, born elsewhere (%)
Residents speaking English at home - Foreign born (%)
Residents speaking Spanish at home (%)
Residents speaking Spanish at home - Born in the United States (%)
Residents speaking Spanish at home - Native, born elsewhere (%)
Residents speaking Spanish at home - Foreign born (%)
Residents speaking other language at home (%)
Residents speaking other language at home - Born in the United States (%)
Residents speaking other language at home - Native, born elsewhere (%)
Residents speaking other language at home - Foreign born (%)
Marital status - Never married (%)
Marital status - Now married (%)
Marital status - Separated (%)
Marital status - Widowed (%)
Marital status - Divorced (%)
Ancestries Reported - Arab (%)
Ancestries Reported - Czech (%)
Ancestries Reported - Danish (%)
Ancestries Reported - Dutch (%)
Ancestries Reported - English (%)
Ancestries Reported - French (%)
Ancestries Reported - French Canadian (%)
Ancestries Reported - German (%)
Ancestries Reported - Greek (%)
Ancestries Reported - Hungarian (%)
Ancestries Reported - Irish (%)
Ancestries Reported - Italian (%)
Ancestries Reported - Lithuanian (%)
Ancestries Reported - Norwegian (%)
Ancestries Reported - Polish (%)
Ancestries Reported - Portuguese (%)
Ancestries Reported - Russian (%)
Ancestries Reported - Scotch-Irish (%)
Ancestries Reported - Scottish (%)
Ancestries Reported - Slovak (%)
Ancestries Reported - Subsaharan African (%)
Ancestries Reported - Swedish (%)
Ancestries Reported - Swiss (%)
Ancestries Reported - Ukrainian (%)
Ancestries Reported - United States (%)
Ancestries Reported - Welsh (%)
Ancestries Reported - West Indian (%)
Ancestries Reported - Other (%)
Geographical mobility - Same house 1 year ago (%)
Geographical mobility - Same house 1 year ago (%) - White
Geographical mobility - Same house 1 year ago (%) - Black or African American
Geographical mobility - Same house 1 year ago (%) - Asian
Geographical mobility - Same house 1 year ago (%) - Hispanic or Latino
Geographical mobility - Same house 1 year ago (%) - American Indian and Alaska Native
Geographical mobility - Same house 1 year ago (%) - Multirace
Geographical mobility - Same house 1 year ago (%) - Other Race
Geographical mobility - Moved within same county (%)
Geographical mobility - Moved within same county (%) - White
Geographical mobility - Moved within same county (%) - Black or African American
Geographical mobility - Moved within same county (%) - Asian
Geographical mobility - Moved within same county (%) - Hispanic or Latino
Geographical mobility - Moved within same county (%) - American Indian and Alaska Native
Geographical mobility - Moved within same county (%) - Multirace
Geographical mobility - Moved within same county (%) - Other Race
Geographical mobility - Moved from different county within same state (%)
Geographical mobility - Moved from different county within same state (%) - White
Geographical mobility - Moved from different county within same state (%) - Black or African American
Geographical mobility - Moved from different county within same state (%) - Asian
Geographical mobility - Moved from different county within same state (%) - Hispanic or Latino
Geographical mobility - Moved from different county within same state (%) - American Indian and Alaska Native
Geographical mobility - Moved from different county within same state (%) - Multirace
Geographical mobility - Moved from different county within same state (%) - Other Race
Geographical mobility - Moved from different state (%)
Geographical mobility - Moved from different state (%) - White
Geographical mobility - Moved from different state (%) - Black or African American
Geographical mobility - Moved from different state (%) - Asian
Geographical mobility - Moved from different state (%) - Hispanic or Latino
Geographical mobility - Moved from different state (%) - American Indian and Alaska Native
Geographical mobility - Moved from different state (%) - Multirace
Geographical mobility - Moved from different state (%) - Other Race
Geographical mobility - Moved from abroad (%)
Geographical mobility - Moved from abroad (%) - White
Geographical mobility - Moved from abroad (%) - Black or African American
Geographical mobility - Moved from abroad (%) - Asian
Geographical mobility - Moved from abroad (%) - Hispanic or Latino
Geographical mobility - Moved from abroad (%) - American Indian and Alaska Native
Geographical mobility - Moved from abroad (%) - Multirace
Geographical mobility - Moved from abroad (%) - Other Race
Place of birth for the foreign-born population - Ireland (%)
Place of birth for the foreign-born population - Denmark (%)
Place of birth for the foreign-born population - Norway (%)
Place of birth for the foreign-born population - Sweden (%)
Place of birth for the foreign-born population - United Kingdom (%)
Place of birth for the foreign-born population - England (%)
Place of birth for the foreign-born population - Scotland (%)
Place of birth for the foreign-born population - Other Northern Europe (%)
Place of birth for the foreign-born population - Austria (%)
Place of birth for the foreign-born population - Belgium (%)
Place of birth for the foreign-born population - France (%)
Place of birth for the foreign-born population - Germany (%)
Place of birth for the foreign-born population - Netherlands (%)
Place of birth for the foreign-born population - Switzerland (%)
Place of birth for the foreign-born population - Other Western Europe (%)
Place of birth for the foreign-born population - Greece (%)
Place of birth for the foreign-born population - Italy (%)
Place of birth for the foreign-born population - Portugal (%)
Place of birth for the foreign-born population - Spain (%)
Place of birth for the foreign-born population - Other Southern Europe (%)
Place of birth for the foreign-born population - Albania (%)
Place of birth for the foreign-born population - Belarus (%)
Place of birth for the foreign-born population - Bosnia and Herzegovina (%)
Place of birth for the foreign-born population - Bulgaria (%)
Place of birth for the foreign-born population - Croatia (%)
Place of birth for the foreign-born population - Czechoslovakia (%)
Place of birth for the foreign-born population - Hungary (%)
Place of birth for the foreign-born population - Latvia (%)
Place of birth for the foreign-born population - Lithuania (%)
Place of birth for the foreign-born population - North Macedonia (Macedonia) (%)
Place of birth for the foreign-born population - Moldova (%)
Place of birth for the foreign-born population - Poland (%)
Place of birth for the foreign-born population - Romania (%)
Place of birth for the foreign-born population - Russia (%)
Place of birth for the foreign-born population - Serbia (%)
Place of birth for the foreign-born population - Ukraine (%)
Place of birth for the foreign-born population - Other Eastern Europe (%)
Place of birth for the foreign-born population - China (%)
Place of birth for the foreign-born population - Hong Kong (%)
Place of birth for the foreign-born population - Taiwan (%)
Place of birth for the foreign-born population - Japan (%)
Place of birth for the foreign-born population - Korea (%)
Place of birth for the foreign-born population - Other Eastern Asia (%)
Place of birth for the foreign-born population - Afghanistan (%)
Place of birth for the foreign-born population - Bangladesh (%)
Place of birth for the foreign-born population - India (%)
Place of birth for the foreign-born population - Iran (%)
Place of birth for the foreign-born population - Kazakhstan (%)
Place of birth for the foreign-born population - Nepal (%)
Place of birth for the foreign-born population - Pakistan (%)
Place of birth for the foreign-born population - Sri Lanka (%)
Place of birth for the foreign-born population - Uzbekistan (%)
Place of birth for the foreign-born population - Other South Central Asia (%)
Place of birth for the foreign-born population - Burma (%)
Place of birth for the foreign-born population - Cambodia (%)
Place of birth for the foreign-born population - Indonesia (%)
Place of birth for the foreign-born population - Laos (%)
Place of birth for the foreign-born population - Malaysia (%)
Place of birth for the foreign-born population - Philippines (%)
Place of birth for the foreign-born population - Singapore (%)
Place of birth for the foreign-born population - Thailand (%)
Place of birth for the foreign-born population - Vietnam (%)
Place of birth for the foreign-born population - Other South Eastern Asia (%)
Place of birth for the foreign-born population - Armenia (%)
Place of birth for the foreign-born population - Iraq (%)
Place of birth for the foreign-born population - Israel (%)
Place of birth for the foreign-born population - Jordan (%)
Place of birth for the foreign-born population - Kuwait (%)
Place of birth for the foreign-born population - Lebanon (%)
Place of birth for the foreign-born population - Saudi Arabia (%)
Place of birth for the foreign-born population - Syria (%)
Place of birth for the foreign-born population - Turkey (%)
Place of birth for the foreign-born population - Yemen (%)
Place of birth for the foreign-born population - Other Western Asia (%)
Place of birth for the foreign-born population - Eritrea (%)
Place of birth for the foreign-born population - Ethiopia (%)
Place of birth for the foreign-born population - Kenya (%)
Place of birth for the foreign-born population - Somalia (%)
Place of birth for the foreign-born population - Uganda (%)
Place of birth for the foreign-born population - Zimbabwe (%)
Place of birth for the foreign-born population - Other Eastern Africa (%)
Place of birth for the foreign-born population - Cameroon (%)
Place of birth for the foreign-born population - Congo (%)
Place of birth for the foreign-born population - Democratic Republic of Congo (Zaire) (%)
Place of birth for the foreign-born population - Other Middle Africa (%)
Place of birth for the foreign-born population - Egypt (%)
Place of birth for the foreign-born population - Morocco (%)
Place of birth for the foreign-born population - Sudan (%)
Place of birth for the foreign-born population - Other Northern Africa (%)
Place of birth for the foreign-born population - South Africa (%)
Place of birth for the foreign-born population - Other Southern Africa (%)
Place of birth for the foreign-born population - Cabo Verde (%)
Place of birth for the foreign-born population - Ghana (%)
Place of birth for the foreign-born population - Liberia (%)
Place of birth for the foreign-born population - Nigeria (%)
Place of birth for the foreign-born population - Senegal (%)
Place of birth for the foreign-born population - Sierra Leone (%)
Place of birth for the foreign-born population - Other Western Africa (%)
Place of birth for the foreign-born population - Australia (%)
Place of birth for the foreign-born population - New Zealand (%)
Place of birth for the foreign-born population - Fiji (%)
Place of birth for the foreign-born population - Micronesia (%)
Place of birth for the foreign-born population - Bahamas (%)
Place of birth for the foreign-born population - Barbados (%)
Place of birth for the foreign-born population - Cuba (%)
Place of birth for the foreign-born population - Dominica (%)
Place of birth for the foreign-born population - Dominican Republic (%)
Place of birth for the foreign-born population - Grenada (%)
Place of birth for the foreign-born population - Haiti (%)
Place of birth for the foreign-born population - Jamaica (%)
Place of birth for the foreign-born population - St. Vincent and the Grenadines (%)
Place of birth for the foreign-born population - Trinidad and Tobago (%)
Place of birth for the foreign-born population - West Indies (%)
Place of birth for the foreign-born population - Other Caribbean (%)
Place of birth for the foreign-born population - Belize (%)
Place of birth for the foreign-born population - Costa Rica (%)
Place of birth for the foreign-born population - El Salvador (%)
Place of birth for the foreign-born population - Guatemala (%)
Place of birth for the foreign-born population - Honduras (%)
Place of birth for the foreign-born population - Mexico (%)
Place of birth for the foreign-born population - Nicaragua (%)
Place of birth for the foreign-born population - Panama (%)
Place of birth for the foreign-born population - Other Central America (%)
Place of birth for the foreign-born population - Argentina (%)
Place of birth for the foreign-born population - Bolivia (%)
Place of birth for the foreign-born population - Brazil (%)
Place of birth for the foreign-born population - Chile (%)
Place of birth for the foreign-born population - Colombia (%)
Place of birth for the foreign-born population - Ecuador (%)
Place of birth for the foreign-born population - Guyana (%)
Place of birth for the foreign-born population - Peru (%)
Place of birth for the foreign-born population - Uruguay (%)
Place of birth for the foreign-born population - Venezuela (%)
Place of birth for the foreign-born population - Other South America (%)
Place of birth for the foreign-born population - Canada (%)
Place of birth for the foreign-born population - Other Northern America (%)
Place of birth for the foreign-born population - Other (%)
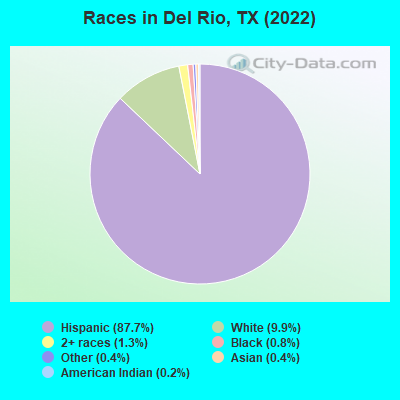
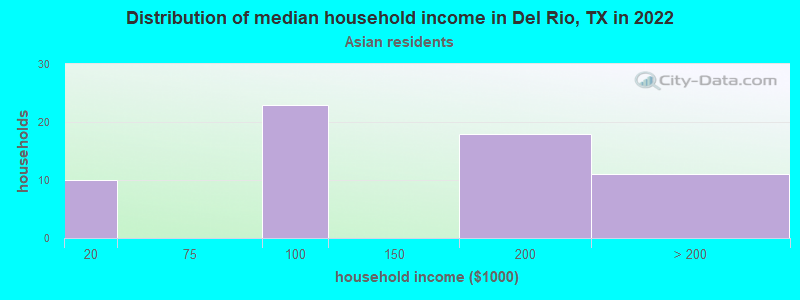
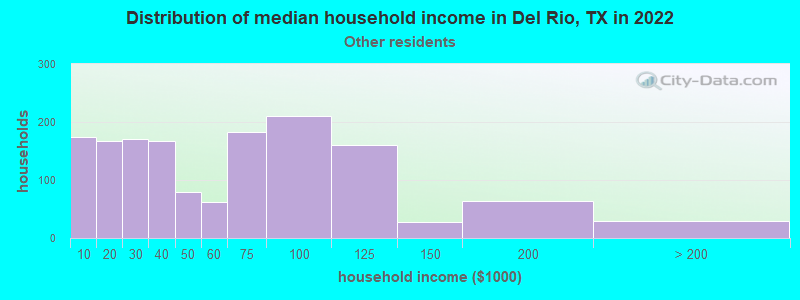
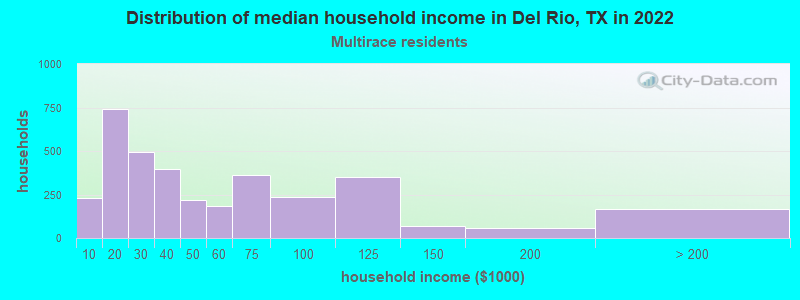
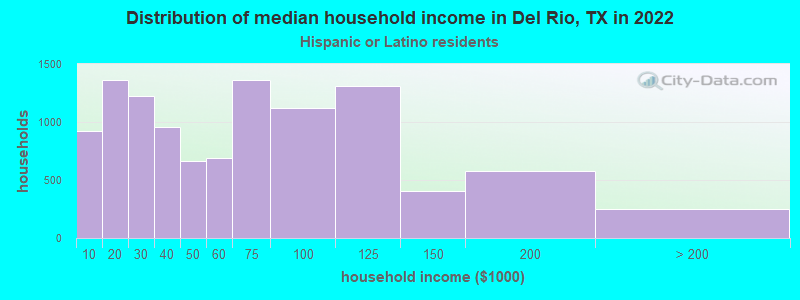
According to 2022 data, the most numerous races in Del Rio, TX are Hispanic (31,275 residents), White alone (3,545 residents), and Black alone (272 residents). 32.6% of Del Rio residents speak English at home. 22.4% of Del Rio, TX residents are foreign-born (21.2% born in Latin America), which is 24.0% greater than the foreign-born rate of 17.0% across the entire state of Texas.
Race distribution in Del Rio
2000 2022
10,933,313 52.4% White alone 6,669,666 32.0% Hispanic 2,364,255 11.3% Black alone 554,445 2.7% Asian alone 230,567 1.1% Two or more races 68,859 0.3% American Indian alone 19,958 0.10% Other race alone 10,757 0.05% Native Hawaiian and Other
12,070,642 40.2% Hispanic 11,683,430 38.9% White alone 3,508,706 11.7% Black alone 1,608,173 5.4% Asian alone 956,560 3.2% Two or more races 125,763 0.4% Other race alone 47,023 0.2% American Indian alone 29,275 0.10% Native Hawaiian and Other
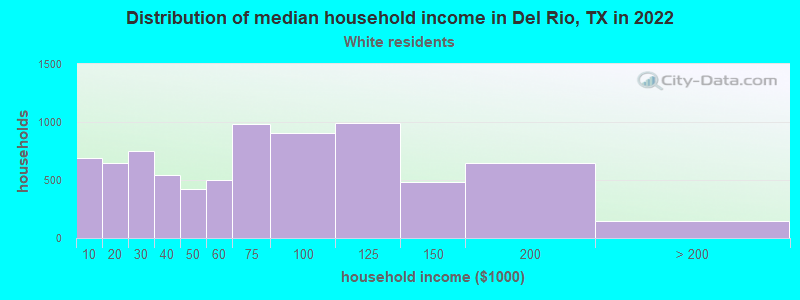
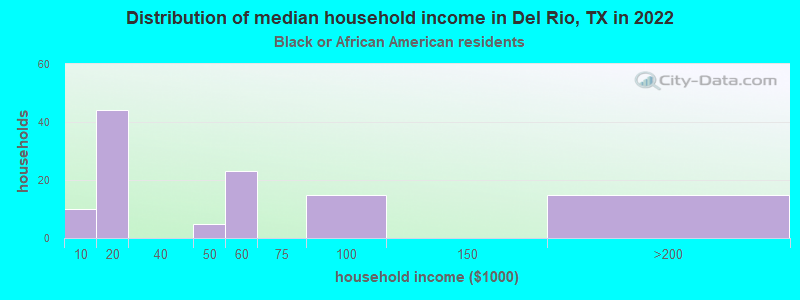
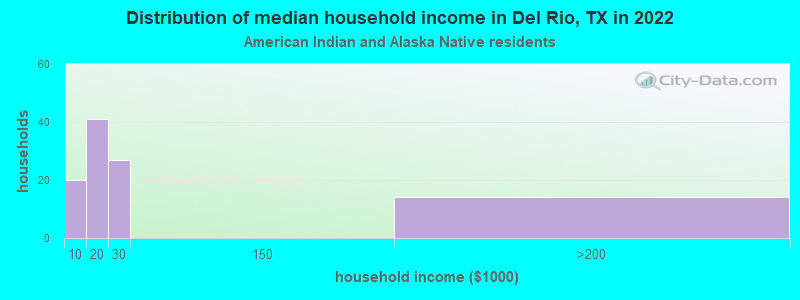
Income and house value in Del Rio Median household income in 2022 $83,862 White non-Hispanic householders$47,568 Some other race householders$31,675 Two or more races householders$53,868 Hispanic or Latino race householdersMedian 2022 house value $210,640 White Non-Hispanic householders$199,554 Black or African American householders$187,147 American Indian or Alaska Native householders $250,762 Asian householders$117,198 Some other race householders$165,767 Two or more races householders$128,020 Hispanic or Latino householders
Median age by race in Del Rio
33.5 Median age for White residents31.2 36.4 31.5 Median age for Black or African American residents40.8 16.9 34.5 Median age for American Indian / Alaska Native residents54.8 31.0 57.5 Median age for Asian residents48.0 74.4 -581,560,283.1 Median age for Native Hawaiian / Pacific Islander residents-612,729,233.5 -577,777,777.2 33.4 Median age for Other race residents33.2 33.4 41.6 Median age for Two or more races residents41.9 41.4 41.1 Median age for White alone residents34.9 46.6 32.4 Median age for Hispanic or Latino residents30.8 35.0
Owner/renter occupied households by race in Del Rio
House owners and renters - White residents 5,115 65.7% Owner occupied2,674 34.3% Renter occupiedHouse owners and renters - Black or African American residents 36 31.6% Owner occupied78 68.4% Renter occupiedHouse owners and renters - American Indian / Alaska Native residents 47 47.1% Owner occupied53 52.9% Renter occupiedHouse owners and renters - Asian residents 53 87.4% Owner occupied8 12.6% Renter occupiedHouse owners and renters - Other race residents 1,134 74.9% Owner occupied380 25.1% Renter occupiedHouse owners and renters - Two or more races residents 2,614 74.7% Owner occupied884 25.3% Renter occupiedHouse owners and renters - White alone residents 1,077 66.0% Owner occupied555 34.0% Renter occupiedHouse owners and renters - Hispanic or Latino residents 7,440 68.0% Owner occupied3,498 32.0% Renter occupied
Language usage in Del Rio
English speakers - Total 32.6% of residents of Del Rio speak English at home.
66.5% of residents speak Spanish at home 14,630 66.7% Speak English very well7,299 33.3% Speak English less than very well0.4% of residents speak other language at home 105 76.6% Speak English very well32 23.4% Speak English less than very well
English speakers - Born in the United States 64.6% of residents of Del Rio speak English at home.
34.6% of residents speak Spanish at home 1,111 88.0% Speak English very well151 12.0% Speak English less than very well0.9% of residents speak other language at home 32 100.0% Speak English very well
English speakers - Native, born elsewhere 27.8% of residents of Del Rio speak English at home.
70.5% of residents speak Spanish at home 211 75.6% Speak English very well68 24.4% Speak English less than very well
English speakers - Foreign-born 10.0% of residents of Del Rio speak English at home.
87.9% of residents speak Spanish at home 2,222 31.7% Speak English very well4,787 68.3% Speak English less than very well1.2% of residents speak other language at home 62 66.0% Speak English very well32 34.0% Speak English less than very well
White (Caucasian) - Speak only English Native:
43.5% (6,858)Foreign-born:
16.1% (369)
White (Caucasian) - Speak another language Native:
35.3% (5,561)Foreign-born:
80.3% (1,839)
Black or African American - Speak another language Native:
5.7% (15)Foreign-born:
100.0% (42)
Asian - Speak only English Native:
90.0% (75)Foreign-born:
42.3% (28)
Asian - Speak another language Native:
10.8% (9)Foreign-born:
58.8% (38)
Other race - Speak only English Native:
24.5% (836)Foreign-born:
4.5% (45)
Other race - Speak another language Native:
74.7% (2,546)Foreign-born:
95.3% (950)
Two or more races - Speak only English Native:
43.7% (2,319)Foreign-born:
13.3% (418)
Two or more races - Speak another language Native:
57.0% (3,025)Foreign-born:
86.2% (2,707)
White alone - Speak only English Native:
88.1% (2,773)Foreign-born:
76.4% (108)
White alone - Speak another language Native:
11.3% (357)Foreign-born:
23.8% (34)
Hispanic or Latino - Speak only English Native:
31.4% (6,691)Foreign-born:
7.9% (603)
Hispanic or Latino - Speak another language Native:
68.3% (14,535)Foreign-born:
92.3% (7,036)
Foreign-born residents in Del Rio 7,971 residents are foreign born (21.2% Latin America ).
This city:
22.4%Texas:
17.1%
Marital status for residents in Del Rio Marital status - White (Caucasian) population 15 years and over
Males 34.6% Never married52.2% Now married1.0% Separated3.3% Widowed9.0% DivorcedFemales 22.5% Never married47.4% Now married4.6% Separated12.6% Widowed12.9% DivorcedWomen who gave birth in the past 12 months Now married:
69.2% (230)Unmarried:
30.8% (103)
Women who did not give birth in the past 12 months Now married:
53.8% (2,183)Unmarried:
46.2% (1,876)
Marital status - Black or African American population 15 years and over
Males 59.4% Never married29.9% Now married0.0% Separated0.0% Widowed10.7% DivorcedFemales 94.2% Never married5.8% Now married0.0% Separated0.0% Widowed0.0% DivorcedWomen who did not give birth in the past 12 months Now married:
0.0% (0)Unmarried:
100.0% (87)
Marital status - American Indian / Alaska Native population 15 years and over
Males 0.0% Never married19.4% Now married0.0% Separated26.9% Widowed53.7% DivorcedFemales 0.0% Never married93.0% Now married0.0% Separated0.0% Widowed7.0% DivorcedWomen who did not give birth in the past 12 months Now married:
100.0% (27)Unmarried:
0.0% (0)
Marital status - Asian population 15 years and over
Males 9.1% Never married64.9% Now married0.0% Separated0.0% Widowed26.0% DivorcedFemales 0.0% Never married86.0% Now married0.0% Separated14.0% Widowed0.0% DivorcedWomen who did not give birth in the past 12 months Now married:
100.0% (14)Unmarried:
0.0% (0)
Marital status - Other race population 15 years and over
Males 26.2% Never married56.7% Now married1.6% Separated5.1% Widowed10.4% DivorcedFemales 29.5% Never married45.1% Now married0.0% Separated13.3% Widowed12.1% DivorcedWomen who gave birth in the past 12 months Now married:
72.7% (22)Unmarried:
27.3% (8)
Women who did not give birth in the past 12 months Now married:
48.0% (378)Unmarried:
52.0% (409)
Marital status - Two or more races population 15 years and over
Males 28.9% Never married46.9% Now married9.3% Separated10.3% Widowed4.6% DivorcedFemales 26.2% Never married39.2% Now married2.1% Separated16.0% Widowed16.5% DivorcedWomen who gave birth in the past 12 months Now married:
17.2% (51)Unmarried:
82.8% (243)
Women who did not give birth in the past 12 months Now married:
46.0% (694)Unmarried:
54.0% (815)
Marital status - White alone, not Hispanic / Latino population 15 years and over
Males 31.5% Never married55.2% Now married1.8% Separated1.1% Widowed10.3% DivorcedFemales 23.1% Never married51.3% Now married0.9% Separated11.2% Widowed13.5% DivorcedWomen who gave birth in the past 12 months Now married:
81.2% (65)Unmarried:
18.8% (15)
Women who did not give birth in the past 12 months Now married:
51.5% (318)Unmarried:
48.5% (299)
Marital status - Hispanic or Latino population 15 years and over
Males 33.0% Never married51.6% Now married2.1% Separated4.9% Widowed8.4% DivorcedFemales 23.6% Never married46.0% Now married4.1% Separated13.4% Widowed12.8% DivorcedWomen who gave birth in the past 12 months Now married:
50.0% (278)Unmarried:
50.0% (278)
Women who did not give birth in the past 12 months Now married:
53.0% (3,207)Unmarried:
47.0% (2,849)
Ancestries in Del Rio
704 2.8% English384 1.5% American346 1.4% German136 0.5% Irish97 0.4% Arab95 0.4% Scottish62 0.2% Italian53 0.2% European38 0.2% African28 0.1% Northern European26 0.1% Norwegian26 0.1% Portuguese15 0.06% Polish14 0.06% Austrian10 0.04% French Canadian9 0.04% French9 0.04% Scotch-Irish5 0.02% Czech5 0.02% Welsh4 0.02% Haitian
Geographical mobility in Del Rio Same house 1 year ago 17,718 85.8% White (Caucasian)235 76.4% Black or African American261 93.0% American Indian / Alaska Native109 74.8% Asian6 98.2% Native Hawaiian / Pacific Islander3,737 81.2% Other race7,562 87.4% Two or more races2,931 83.8% White alone, not Hispanic / Latino26,544 85.7% Hispanic or LatinoMoved within same county 1,597 7.7% White / Caucasian12 3.8% Black or African American19 13.1% Asian114 2.5% Other race819 9.5% Two or more races329 9.4% White alone, not Hispanic / Latino2,345 7.6% Hispanic or LatinoMoved within same state 630 3.1% White / Caucasian18 5.8% Black or African American23 8.2% American Indian / Alaska Native9 6.5% Asian462 10.0% Other race184 2.1% Two or more races119 3.4% White alone, not Hispanic / Latino1,070 3.5% Hispanic or LatinoMoved from different state 193 0.9% White / Caucasian13 4.1% Black or African American7 4.6% Asian282 6.1% Other race36 0.4% Two or more races68 1.9% White alone, not Hispanic / Latino406 1.3% Hispanic or LatinoMoved from abroad 334 1.6% White32 10.3% Black or African American42 0.9% Other race44 0.5% Two or more races36 1.0% White alone, not Hispanic / Latino659 2.1% Hispanic or Latino
Children Nativity (place of birth) in Del Rio
Children under 6 years - Living with two parents Both parents native 1,310 100.0% NativeBoth parents foreign-born 76 100.0% NativeOne native, one foreign-born parent 355 100.0% NativeChildren under 6 years - Living with one parent Native parent 1,302 100.0% NativeForeign-born parent 212 100.0% NativeChildren 6 to 17 years - Living with two parents Both parents native 2,172 100.0% Native0 0.0% Foreign-bornBoth parents foreign-born 298 87.7% Native42 12.3% Foreign-bornOne native, one foreign-born parent 1,063 100.0% NativeChildren 6 to 17 years - Living with one parent Native parent 2,000 100.0% NativeForeign-born parent 590 51.3% Native561 48.7% Foreign-born
Grandparents responsible for own grandchildren in Del Rio
Grandparents (30 to 59 years) White / Caucasian 68 24.6% Responsible for grandchildren207 75.4% Not responsible for grandchildrenOther race 25 16.5% Responsible for grandchildren127 83.5% Not responsible for grandchildrenTwo or more races 18 100.0% Responsible for grandchildrenWhite alone, not Hispanic / Latino 16 100.0% Responsible for grandchildrenHispanic or Latino 115 21.7% Responsible for grandchildren414 78.3% Not responsible for grandchildrenGrandparents (60 years and over) White / Caucasian 50 13.7% Responsible for grandchildren315 86.3% Not responsible for grandchildrenOther race 5 5.6% Responsible for grandchildren92 94.4% Not responsible for grandchildrenTwo or more races 50 57.2% Responsible for grandchildren38 42.8% Not responsible for grandchildrenWhite alone, not Hispanic / Latino 12 100.0% Responsible for grandchildrenHispanic or Latino 92 14.5% Responsible for grandchildren545 85.5% Not responsible for grandchildren