Races in DeSoto, Texas (TX) Detailed Stats
Data:
Races - White alone (%)
Races - White alone (% change since 2000)
Races - Black alone (%)
Races - Black alone (% change since 2000)
Races - American Indian alone (%)
Races - American Indian alone (% change since 2000)
Races - Asian alone (%)
Races - Asian alone (% change since 2000)
Races - Hispanic (%)
Races - Hispanic (% change since 2000)
Races - Native Hawaiian and Other Pacific Islander alone (%)
Races - Native Hawaiian and Other Pacific Islander alone (% change since 2000)
Races - Two or more races(%)
Races - Two or more races(% change since 2000)
Races - Other race alone (%)
Races - Other race alone (% change since 2000)
Racial diversity
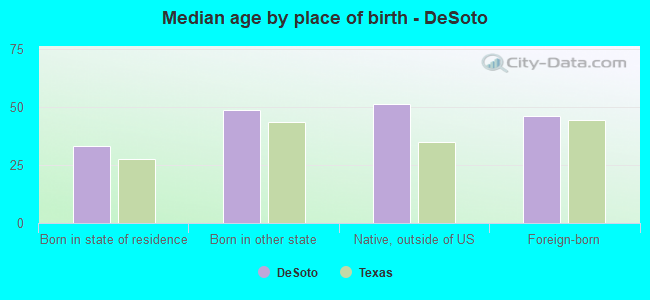
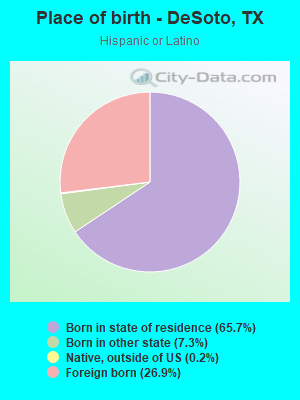
Place of birth - Born in state of residence (%)
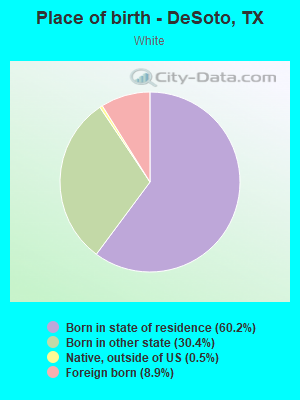
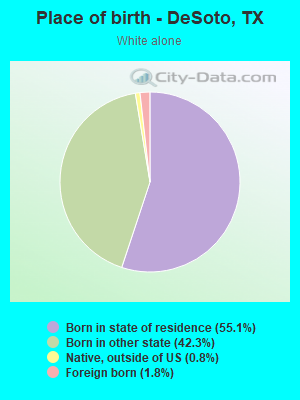
Place of birth - Born in state of residence (%) - White
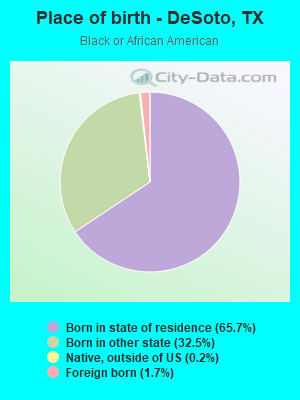
Place of birth - Born in state of residence (%) - Black or African American
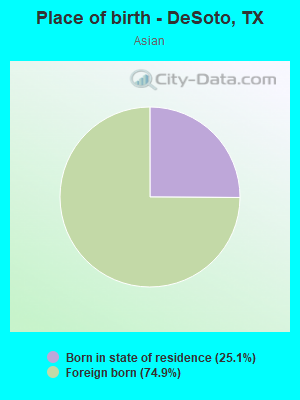
Place of birth - Born in state of residence (%) - Asian
Place of birth - Born in state of residence (%) - Hispanic or Latino
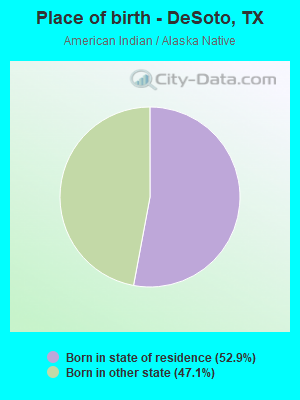
Place of birth - Born in state of residence (%) - American Indian and Alaska Native
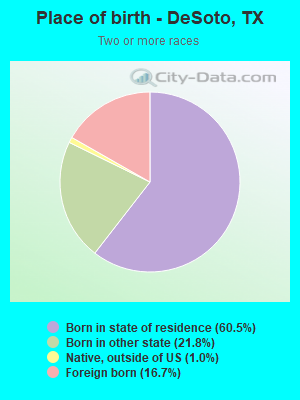
Place of birth - Born in state of residence (%) - Multirace
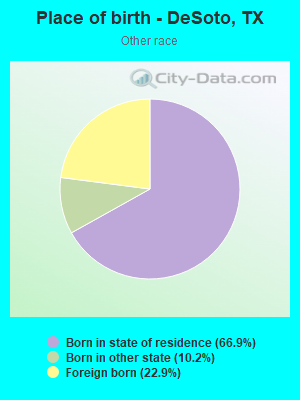
Place of birth - Born in state of residence (%) - Other Race
Place of birth - Born in other state (%)
Place of birth - Born in other state (%) - White
Place of birth - Born in other state (%) - Black or African American
Place of birth - Born in other state (%) - Asian
Place of birth - Born in other state (%) - Hispanic or Latino
Place of birth - Born in other state (%) - American Indian and Alaska Native
Place of birth - Born in other state (%) - Multirace
Place of birth - Born in other state (%) - Other Race
Place of birth - Native, outside of US (%)
Place of birth - Native, outside of US (%) - White
Place of birth - Native, outside of US (%) - Black or African American
Place of birth - Native, outside of US (%) - Asian
Place of birth - Native, outside of US (%) - Hispanic or Latino
Place of birth - Native, outside of US (%) - American Indian and Alaska Native
Place of birth - Native, outside of US (%) - Multirace
Place of birth - Native, outside of US (%) - Other Race
Place of birth - Foreign born (%)
Place of birth - Foreign born (%) - White
Place of birth - Foreign born (%) - Black or African American
Place of birth - Foreign born (%) - Asian
Place of birth - Foreign born (%) - Hispanic or Latino
Place of birth - Foreign born (%) - American Indian and Alaska Native
Place of birth - Foreign born (%) - Multirace
Place of birth - Foreign born (%) - Other Race
Residents speaking English at home (%)
Residents speaking English at home - Born in the United States (%)
Residents speaking English at home - Native, born elsewhere (%)
Residents speaking English at home - Foreign born (%)
Residents speaking Spanish at home (%)
Residents speaking Spanish at home - Born in the United States (%)
Residents speaking Spanish at home - Native, born elsewhere (%)
Residents speaking Spanish at home - Foreign born (%)
Residents speaking other language at home (%)
Residents speaking other language at home - Born in the United States (%)
Residents speaking other language at home - Native, born elsewhere (%)
Residents speaking other language at home - Foreign born (%)
Marital status - Never married (%)
Marital status - Now married (%)
Marital status - Separated (%)
Marital status - Widowed (%)
Marital status - Divorced (%)
Ancestries Reported - Arab (%)
Ancestries Reported - Czech (%)
Ancestries Reported - Danish (%)
Ancestries Reported - Dutch (%)
Ancestries Reported - English (%)
Ancestries Reported - French (%)
Ancestries Reported - French Canadian (%)
Ancestries Reported - German (%)
Ancestries Reported - Greek (%)
Ancestries Reported - Hungarian (%)
Ancestries Reported - Irish (%)
Ancestries Reported - Italian (%)
Ancestries Reported - Lithuanian (%)
Ancestries Reported - Norwegian (%)
Ancestries Reported - Polish (%)
Ancestries Reported - Portuguese (%)
Ancestries Reported - Russian (%)
Ancestries Reported - Scotch-Irish (%)
Ancestries Reported - Scottish (%)
Ancestries Reported - Slovak (%)
Ancestries Reported - Subsaharan African (%)
Ancestries Reported - Swedish (%)
Ancestries Reported - Swiss (%)
Ancestries Reported - Ukrainian (%)
Ancestries Reported - United States (%)
Ancestries Reported - Welsh (%)
Ancestries Reported - West Indian (%)
Ancestries Reported - Other (%)
Geographical mobility - Same house 1 year ago (%)
Geographical mobility - Same house 1 year ago (%) - White
Geographical mobility - Same house 1 year ago (%) - Black or African American
Geographical mobility - Same house 1 year ago (%) - Asian
Geographical mobility - Same house 1 year ago (%) - Hispanic or Latino
Geographical mobility - Same house 1 year ago (%) - American Indian and Alaska Native
Geographical mobility - Same house 1 year ago (%) - Multirace
Geographical mobility - Same house 1 year ago (%) - Other Race
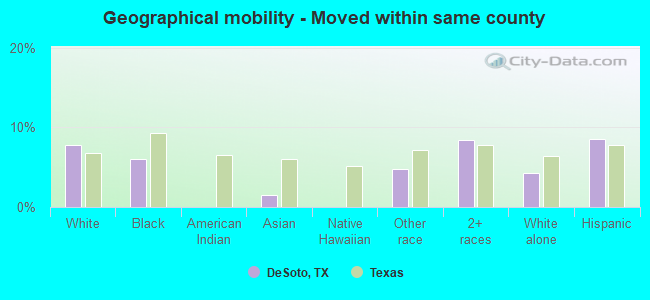
Geographical mobility - Moved within same county (%)
Geographical mobility - Moved within same county (%) - White
Geographical mobility - Moved within same county (%) - Black or African American
Geographical mobility - Moved within same county (%) - Asian
Geographical mobility - Moved within same county (%) - Hispanic or Latino
Geographical mobility - Moved within same county (%) - American Indian and Alaska Native
Geographical mobility - Moved within same county (%) - Multirace
Geographical mobility - Moved within same county (%) - Other Race
Geographical mobility - Moved from different county within same state (%)
Geographical mobility - Moved from different county within same state (%) - White
Geographical mobility - Moved from different county within same state (%) - Black or African American
Geographical mobility - Moved from different county within same state (%) - Asian
Geographical mobility - Moved from different county within same state (%) - Hispanic or Latino
Geographical mobility - Moved from different county within same state (%) - American Indian and Alaska Native
Geographical mobility - Moved from different county within same state (%) - Multirace
Geographical mobility - Moved from different county within same state (%) - Other Race
Geographical mobility - Moved from different state (%)
Geographical mobility - Moved from different state (%) - White
Geographical mobility - Moved from different state (%) - Black or African American
Geographical mobility - Moved from different state (%) - Asian
Geographical mobility - Moved from different state (%) - Hispanic or Latino
Geographical mobility - Moved from different state (%) - American Indian and Alaska Native
Geographical mobility - Moved from different state (%) - Multirace
Geographical mobility - Moved from different state (%) - Other Race
Geographical mobility - Moved from abroad (%)
Geographical mobility - Moved from abroad (%) - White
Geographical mobility - Moved from abroad (%) - Black or African American
Geographical mobility - Moved from abroad (%) - Asian
Geographical mobility - Moved from abroad (%) - Hispanic or Latino
Geographical mobility - Moved from abroad (%) - American Indian and Alaska Native
Geographical mobility - Moved from abroad (%) - Multirace
Geographical mobility - Moved from abroad (%) - Other Race
Place of birth for the foreign-born population - Ireland (%)
Place of birth for the foreign-born population - Denmark (%)
Place of birth for the foreign-born population - Norway (%)
Place of birth for the foreign-born population - Sweden (%)
Place of birth for the foreign-born population - United Kingdom (%)
Place of birth for the foreign-born population - England (%)
Place of birth for the foreign-born population - Scotland (%)
Place of birth for the foreign-born population - Other Northern Europe (%)
Place of birth for the foreign-born population - Austria (%)
Place of birth for the foreign-born population - Belgium (%)
Place of birth for the foreign-born population - France (%)
Place of birth for the foreign-born population - Germany (%)
Place of birth for the foreign-born population - Netherlands (%)
Place of birth for the foreign-born population - Switzerland (%)
Place of birth for the foreign-born population - Other Western Europe (%)
Place of birth for the foreign-born population - Greece (%)
Place of birth for the foreign-born population - Italy (%)
Place of birth for the foreign-born population - Portugal (%)
Place of birth for the foreign-born population - Spain (%)
Place of birth for the foreign-born population - Other Southern Europe (%)
Place of birth for the foreign-born population - Albania (%)
Place of birth for the foreign-born population - Belarus (%)
Place of birth for the foreign-born population - Bosnia and Herzegovina (%)
Place of birth for the foreign-born population - Bulgaria (%)
Place of birth for the foreign-born population - Croatia (%)
Place of birth for the foreign-born population - Czechoslovakia (%)
Place of birth for the foreign-born population - Hungary (%)
Place of birth for the foreign-born population - Latvia (%)
Place of birth for the foreign-born population - Lithuania (%)
Place of birth for the foreign-born population - North Macedonia (Macedonia) (%)
Place of birth for the foreign-born population - Moldova (%)
Place of birth for the foreign-born population - Poland (%)
Place of birth for the foreign-born population - Romania (%)
Place of birth for the foreign-born population - Russia (%)
Place of birth for the foreign-born population - Serbia (%)
Place of birth for the foreign-born population - Ukraine (%)
Place of birth for the foreign-born population - Other Eastern Europe (%)
Place of birth for the foreign-born population - China (%)
Place of birth for the foreign-born population - Hong Kong (%)
Place of birth for the foreign-born population - Taiwan (%)
Place of birth for the foreign-born population - Japan (%)
Place of birth for the foreign-born population - Korea (%)
Place of birth for the foreign-born population - Other Eastern Asia (%)
Place of birth for the foreign-born population - Afghanistan (%)
Place of birth for the foreign-born population - Bangladesh (%)
Place of birth for the foreign-born population - India (%)
Place of birth for the foreign-born population - Iran (%)
Place of birth for the foreign-born population - Kazakhstan (%)
Place of birth for the foreign-born population - Nepal (%)
Place of birth for the foreign-born population - Pakistan (%)
Place of birth for the foreign-born population - Sri Lanka (%)
Place of birth for the foreign-born population - Uzbekistan (%)
Place of birth for the foreign-born population - Other South Central Asia (%)
Place of birth for the foreign-born population - Burma (%)
Place of birth for the foreign-born population - Cambodia (%)
Place of birth for the foreign-born population - Indonesia (%)
Place of birth for the foreign-born population - Laos (%)
Place of birth for the foreign-born population - Malaysia (%)
Place of birth for the foreign-born population - Philippines (%)
Place of birth for the foreign-born population - Singapore (%)
Place of birth for the foreign-born population - Thailand (%)
Place of birth for the foreign-born population - Vietnam (%)
Place of birth for the foreign-born population - Other South Eastern Asia (%)
Place of birth for the foreign-born population - Armenia (%)
Place of birth for the foreign-born population - Iraq (%)
Place of birth for the foreign-born population - Israel (%)
Place of birth for the foreign-born population - Jordan (%)
Place of birth for the foreign-born population - Kuwait (%)
Place of birth for the foreign-born population - Lebanon (%)
Place of birth for the foreign-born population - Saudi Arabia (%)
Place of birth for the foreign-born population - Syria (%)
Place of birth for the foreign-born population - Turkey (%)
Place of birth for the foreign-born population - Yemen (%)
Place of birth for the foreign-born population - Other Western Asia (%)
Place of birth for the foreign-born population - Eritrea (%)
Place of birth for the foreign-born population - Ethiopia (%)
Place of birth for the foreign-born population - Kenya (%)
Place of birth for the foreign-born population - Somalia (%)
Place of birth for the foreign-born population - Uganda (%)
Place of birth for the foreign-born population - Zimbabwe (%)
Place of birth for the foreign-born population - Other Eastern Africa (%)
Place of birth for the foreign-born population - Cameroon (%)
Place of birth for the foreign-born population - Congo (%)
Place of birth for the foreign-born population - Democratic Republic of Congo (Zaire) (%)
Place of birth for the foreign-born population - Other Middle Africa (%)
Place of birth for the foreign-born population - Egypt (%)
Place of birth for the foreign-born population - Morocco (%)
Place of birth for the foreign-born population - Sudan (%)
Place of birth for the foreign-born population - Other Northern Africa (%)
Place of birth for the foreign-born population - South Africa (%)
Place of birth for the foreign-born population - Other Southern Africa (%)
Place of birth for the foreign-born population - Cabo Verde (%)
Place of birth for the foreign-born population - Ghana (%)
Place of birth for the foreign-born population - Liberia (%)
Place of birth for the foreign-born population - Nigeria (%)
Place of birth for the foreign-born population - Senegal (%)
Place of birth for the foreign-born population - Sierra Leone (%)
Place of birth for the foreign-born population - Other Western Africa (%)
Place of birth for the foreign-born population - Australia (%)
Place of birth for the foreign-born population - New Zealand (%)
Place of birth for the foreign-born population - Fiji (%)
Place of birth for the foreign-born population - Micronesia (%)
Place of birth for the foreign-born population - Bahamas (%)
Place of birth for the foreign-born population - Barbados (%)
Place of birth for the foreign-born population - Cuba (%)
Place of birth for the foreign-born population - Dominica (%)
Place of birth for the foreign-born population - Dominican Republic (%)
Place of birth for the foreign-born population - Grenada (%)
Place of birth for the foreign-born population - Haiti (%)
Place of birth for the foreign-born population - Jamaica (%)
Place of birth for the foreign-born population - St. Vincent and the Grenadines (%)
Place of birth for the foreign-born population - Trinidad and Tobago (%)
Place of birth for the foreign-born population - West Indies (%)
Place of birth for the foreign-born population - Other Caribbean (%)
Place of birth for the foreign-born population - Belize (%)
Place of birth for the foreign-born population - Costa Rica (%)
Place of birth for the foreign-born population - El Salvador (%)
Place of birth for the foreign-born population - Guatemala (%)
Place of birth for the foreign-born population - Honduras (%)
Place of birth for the foreign-born population - Mexico (%)
Place of birth for the foreign-born population - Nicaragua (%)
Place of birth for the foreign-born population - Panama (%)
Place of birth for the foreign-born population - Other Central America (%)
Place of birth for the foreign-born population - Argentina (%)
Place of birth for the foreign-born population - Bolivia (%)
Place of birth for the foreign-born population - Brazil (%)
Place of birth for the foreign-born population - Chile (%)
Place of birth for the foreign-born population - Colombia (%)
Place of birth for the foreign-born population - Ecuador (%)
Place of birth for the foreign-born population - Guyana (%)
Place of birth for the foreign-born population - Peru (%)
Place of birth for the foreign-born population - Uruguay (%)
Place of birth for the foreign-born population - Venezuela (%)
Place of birth for the foreign-born population - Other South America (%)
Place of birth for the foreign-born population - Canada (%)
Place of birth for the foreign-born population - Other Northern America (%)
Place of birth for the foreign-born population - Other (%)
Latest news about races in DeSoto, TX collected exclusively by city-data.com from local newspapers, TV, and radio stations
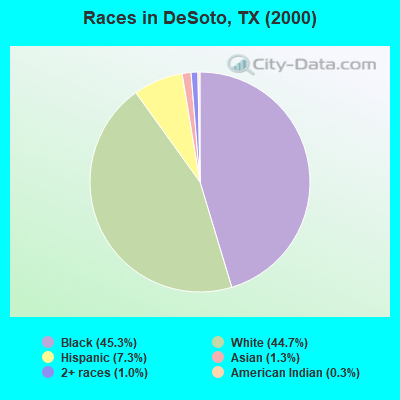
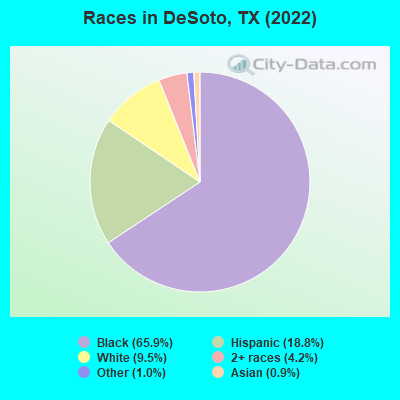
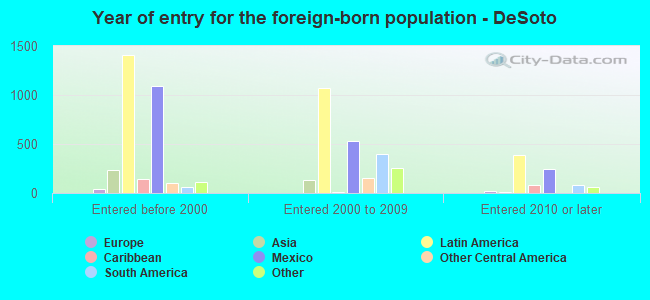
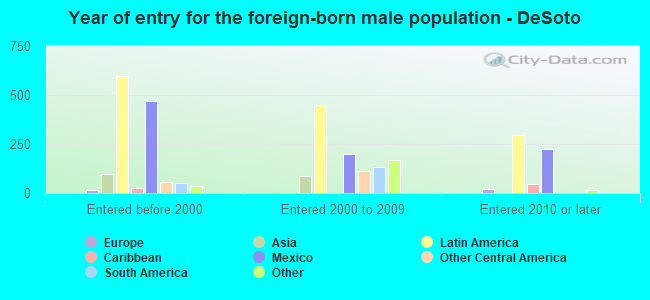
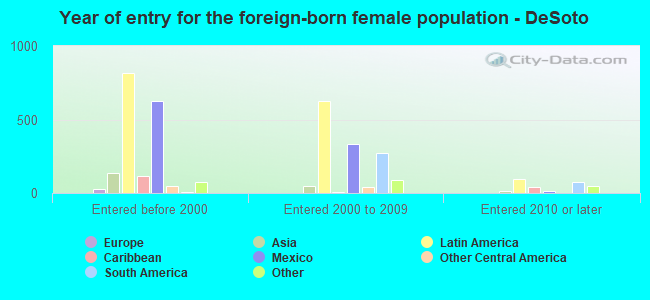
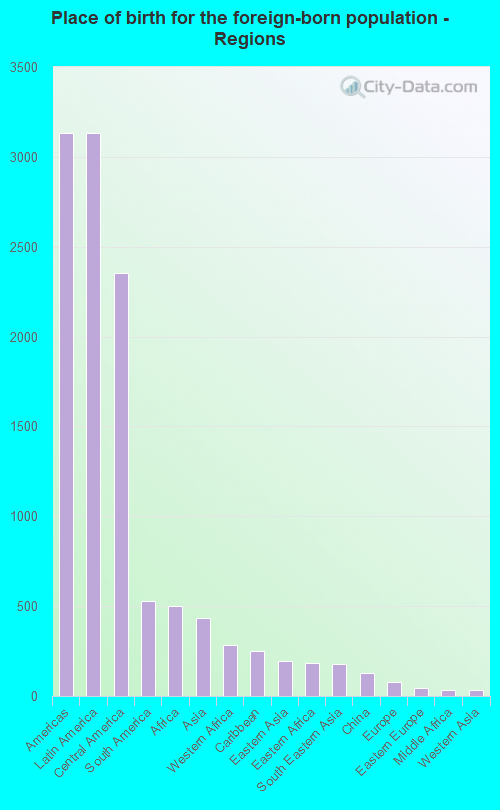
According to 2022 data, the most numerous races in DeSoto, TX are Hispanic (10,465 residents), White alone (5,306 residents), and Black alone (36,754 residents). 86.0% of DeSoto residents speak English at home. 7.4% of DeSoto, TX residents are foreign-born (5.4% born in Latin America, 0.9% born in Africa, 0.8% born in Asia), which is 128.5% less than the foreign-born rate of 17.0% across the entire state of Texas.
Race distribution in DeSoto
2000 2022
10,933,313 52.4% White alone 6,669,666 32.0% Hispanic 2,364,255 11.3% Black alone 554,445 2.7% Asian alone 230,567 1.1% Two or more races 68,859 0.3% American Indian alone 19,958 0.10% Other race alone 10,757 0.05% Native Hawaiian and Other
12,070,642 40.2% Hispanic 11,683,430 38.9% White alone 3,508,706 11.7% Black alone 1,608,173 5.4% Asian alone 956,560 3.2% Two or more races 125,763 0.4% Other race alone 47,023 0.2% American Indian alone 29,275 0.10% Native Hawaiian and Other
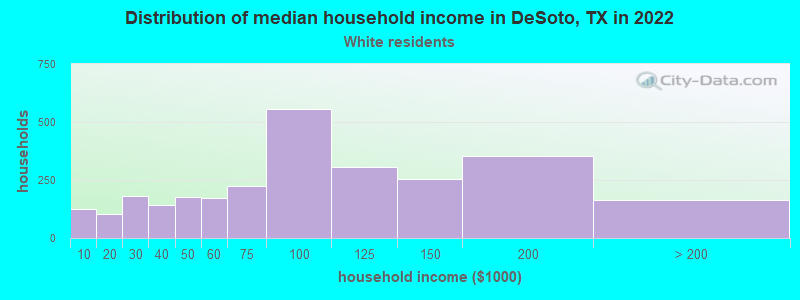
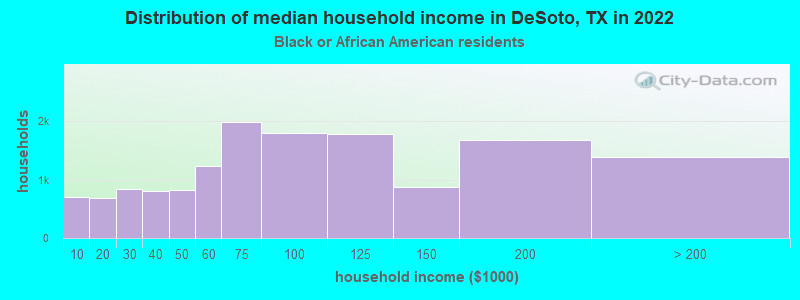
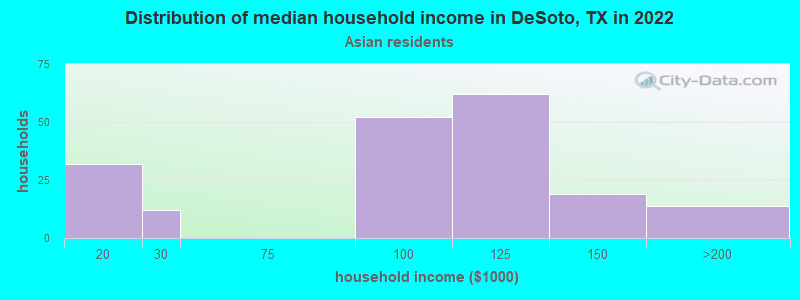
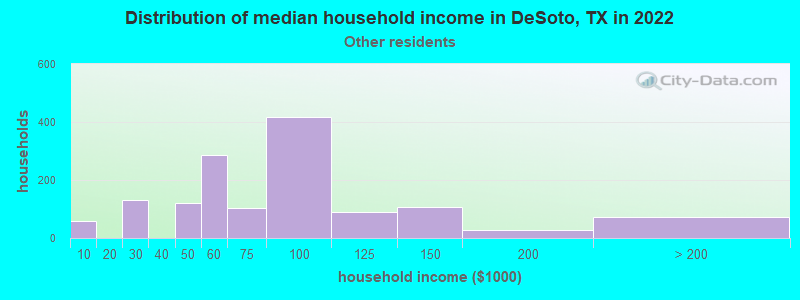
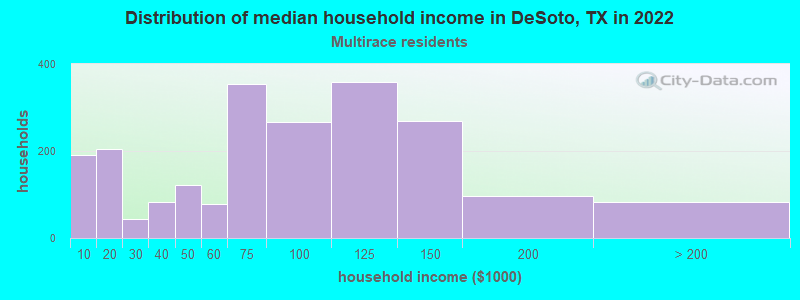
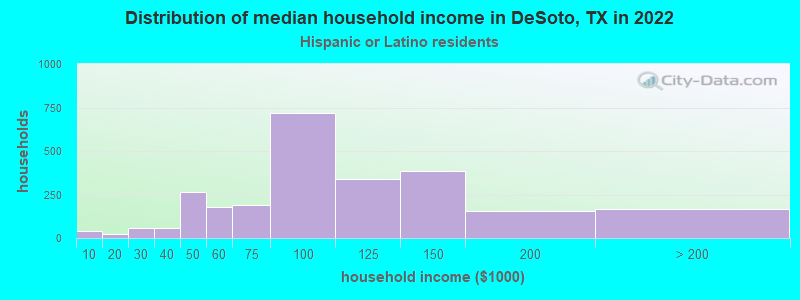
Income and house value in DeSoto Median household income in 2022 $77,325 White non-Hispanic householders$78,475 Black householders$96,855 Asian householders$77,210 Some other race householders$73,385 Two or more races householders$95,332 Hispanic or Latino race householdersMedian 2022 house value $298,119 White Non-Hispanic householders$320,708 Black or African American householders$283,896 American Indian or Alaska Native householders $329,074 Asian householders$242,901 Some other race householders$285,012 Two or more races householders$280,829 Hispanic or Latino householders
Median age by race in DeSoto
41.0 Median age for White residents42.0 40.8 44.4 Median age for Black or African American residents42.0 46.9 -740,518,961.3 Median age for American Indian / Alaska Native residents-670,422,534.5 -820,846,904.7 52.3 Median age for Asian residents52.6 51.9 -711,469,533.3 Median age for Native Hawaiian / Pacific Islander residents-815,813,116.9 -464,594,127.3 27.0 Median age for Other race residents18.8 27.0 29.1 Median age for Two or more races residents28.6 29.5 57.4 Median age for White alone residents56.1 58.2 26.5 Median age for Hispanic or Latino residents24.1 27.6
Owner/renter occupied households by race in DeSoto
House owners and renters - White residents 2,364 82.2% Owner occupied512 17.8% Renter occupiedHouse owners and renters - Black or African American residents 9,918 66.9% Owner occupied4,901 33.1% Renter occupiedHouse owners and renters - American Indian / Alaska Native residents 30 100.0% Renter occupiedHouse owners and renters - Asian residents 126 70.1% Owner occupied54 29.9% Renter occupiedHouse owners and renters - Native Hawaiian / Pacific Islander residents 103 100.0% Owner occupiedHouse owners and renters - Other race residents 1,048 74.0% Owner occupied368 26.0% Renter occupiedHouse owners and renters - Two or more races residents 1,306 61.1% Owner occupied832 38.9% Renter occupiedHouse owners and renters - White alone residents 1,942 78.4% Owner occupied535 21.6% Renter occupiedHouse owners and renters - Hispanic or Latino residents 2,222 88.6% Owner occupied285 11.4% Renter occupied
Language usage in DeSoto
English speakers - Total 86.0% of residents of DeSoto speak English at home.
11.8% of residents speak Spanish at home 3,846 61.4% Speak English very well2,419 38.6% Speak English less than very well2.6% of residents speak other language at home 1,063 78.7% Speak English very well288 21.3% Speak English less than very well
English speakers - Born in the United States 94.1% of residents of DeSoto speak English at home.
2.2% of residents speak Spanish at home 367 100.0% Speak English very well2.0% of residents speak other language at home 295 92.2% Speak English very well25 7.8% Speak English less than very well
English speakers - Native, born elsewhere 88.8% of residents of DeSoto speak English at home.
5.1% of residents speak Spanish at home 10 100.0% Speak English very well15.8% of residents speak other language at home 31 100.0% Speak English very well
English speakers - Foreign-born 11.6% of residents of DeSoto speak English at home.
70.4% of residents speak Spanish at home 1,039 37.5% Speak English very well1,731 62.5% Speak English less than very well18.2% of residents speak other language at home 445 62.3% Speak English very well269 37.7% Speak English less than very well
White (Caucasian) - Speak only English Native:
89.9% (5,563)Foreign-born:
5.9% (39)
White (Caucasian) - Speak another language Native:
11.4% (708)Foreign-born:
85.1% (561)
Black or African American - Speak only English Native:
98.4% (34,453)Foreign-born:
44.9% (276)
Black or African American - Speak another language Native:
1.7% (578)Foreign-born:
51.8% (318)
Asian - Speak only English Native:
79.1% (121)Foreign-born:
11.3% (43)
Asian - Speak another language Native:
16.5% (25)Foreign-born:
88.6% (339)
Other race - Speak only English Native:
70.6% (2,336)Foreign-born:
1.7% (19)
Other race - Speak another language Native:
30.3% (1,004)Foreign-born:
98.3% (1,080)
Two or more races - Speak only English Native:
62.7% (3,490)Foreign-born:
5.5% (68)
Two or more races - Speak another language Native:
33.4% (1,856)Foreign-born:
94.5% (1,169)
White alone - Speak only English Native:
97.7% (4,850)Foreign-born:
29.5% (28)
White alone - Speak another language Native:
2.5% (125)Foreign-born:
69.9% (66)
Hispanic or Latino - Speak only English Native:
51.6% (3,378)Foreign-born:
2.0% (57)
Hispanic or Latino - Speak another language Native:
49.5% (3,245)Foreign-born:
97.4% (2,747)
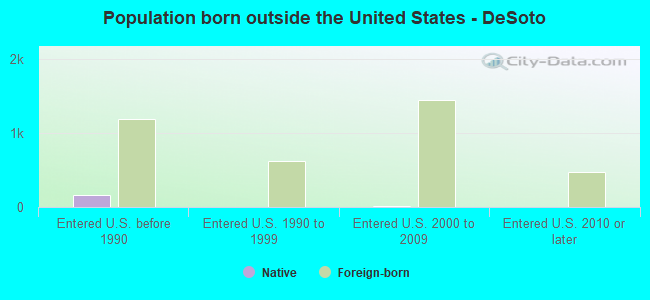
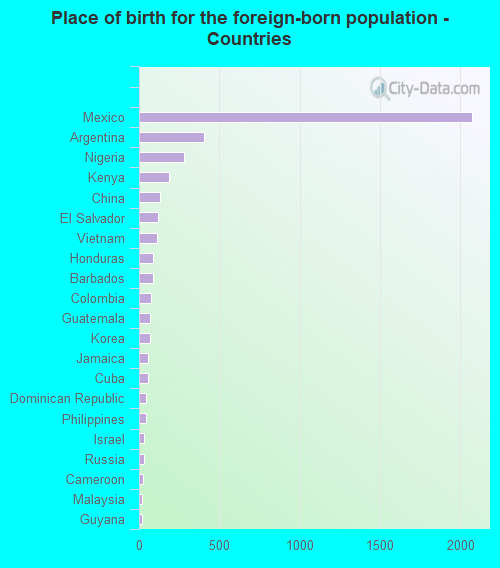
Foreign-born residents in DeSoto 4,152 residents are foreign born (5.4% Latin America , 0.9% Africa , 0.8% Asia ).
This city:
7.4%Texas:
17.1%
Marital status for residents in DeSoto Marital status - White (Caucasian) population 15 years and over
Males 23.6% Never married59.9% Now married0.9% Separated6.6% Widowed8.9% DivorcedFemales 25.1% Never married52.2% Now married1.4% Separated11.9% Widowed9.4% DivorcedWomen who gave birth in the past 12 months Now married:
84.6% (98)Unmarried:
15.4% (18)
Women who did not give birth in the past 12 months Now married:
51.5% (701)Unmarried:
48.5% (659)
Marital status - Black or African American population 15 years and over
Males 40.8% Never married43.2% Now married2.0% Separated3.0% Widowed11.0% DivorcedFemales 36.9% Never married36.6% Now married1.8% Separated8.4% Widowed16.2% DivorcedWomen who gave birth in the past 12 months Now married:
92.5% (228)Unmarried:
7.5% (19)
Women who did not give birth in the past 12 months Now married:
30.9% (2,740)Unmarried:
69.1% (6,141)
Marital status - American Indian / Alaska Native population 15 years and over
Males 0.0% Never married0.0% Now married0.0% Separated0.0% Widowed100.0% DivorcedFemales 100.0% Never married0.0% Now married0.0% Separated0.0% Widowed0.0% DivorcedWomen who gave birth in the past 12 months Now married:
0.0% (0)Unmarried:
100.0% (29)
Marital status - Asian population 15 years and over
Males 37.7% Never married62.3% Now married0.0% Separated0.0% Widowed0.0% DivorcedFemales 28.5% Never married63.8% Now married0.0% Separated0.0% Widowed7.7% DivorcedWomen who gave birth in the past 12 months Now married:
0.0% (0)Unmarried:
100.0% (12)
Women who did not give birth in the past 12 months Now married:
51.8% (59)Unmarried:
48.2% (55)
Marital status - Other race population 15 years and over
Males 51.7% Never married48.3% Now married0.0% Separated0.0% Widowed0.0% DivorcedFemales 53.5% Never married22.8% Now married10.0% Separated4.8% Widowed8.9% DivorcedWomen who did not give birth in the past 12 months Now married:
39.3% (760)Unmarried:
60.7% (1,172)
Marital status - Two or more races population 15 years and over
Males 52.8% Never married30.1% Now married0.0% Separated4.4% Widowed12.7% DivorcedFemales 43.1% Never married39.6% Now married5.1% Separated1.1% Widowed11.1% DivorcedWomen who gave birth in the past 12 months Now married:
45.6% (60)Unmarried:
54.4% (72)
Women who did not give birth in the past 12 months Now married:
36.7% (552)Unmarried:
63.3% (950)
Marital status - White alone, not Hispanic / Latino population 15 years and over
Males 17.2% Never married58.2% Now married0.3% Separated10.1% Widowed14.2% DivorcedFemales 15.2% Never married51.4% Now married2.2% Separated17.5% Widowed13.7% DivorcedWomen who gave birth in the past 12 months Now married:
100.0% (84)Unmarried:
0.0% (0)
Women who did not give birth in the past 12 months Now married:
57.7% (408)Unmarried:
42.3% (299)
Marital status - Hispanic or Latino population 15 years and over
Males 45.6% Never married46.3% Now married0.8% Separated2.6% Widowed4.8% DivorcedFemales 47.3% Never married42.9% Now married4.5% Separated1.1% Widowed4.2% DivorcedWomen who gave birth in the past 12 months Now married:
77.8% (92)Unmarried:
22.2% (26)
Women who did not give birth in the past 12 months Now married:
44.1% (1,413)Unmarried:
55.9% (1,795)
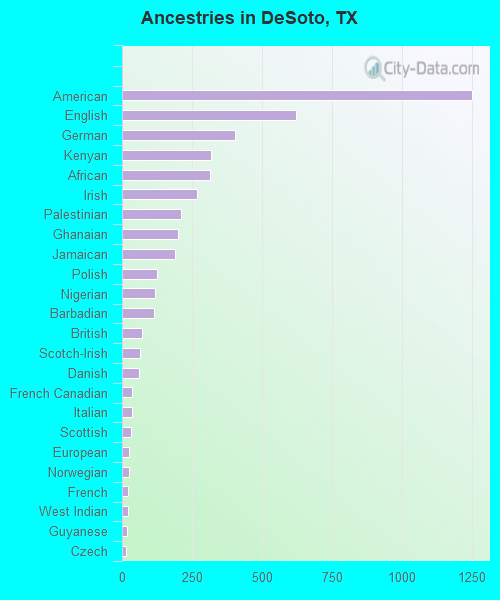
Ancestries in DeSoto
1,250 3.6% American624 1.8% English405 1.2% German317 0.9% Kenyan314 0.9% African269 0.8% Irish211 0.6% Palestinian201 0.6% Ghanaian190 0.5% Jamaican124 0.4% Polish119 0.3% Nigerian114 0.3% Barbadian71 0.2% British65 0.2% Scotch-Irish60 0.2% Danish36 0.1% French Canadian34 0.10% Italian33 0.09% Scottish24 0.07% European24 0.07% Norwegian20 0.06% French20 0.06% West Indian19 0.05% Guyanese13 0.04% Czech11 0.03% Belizean8 0.02% Russian7 0.02% Iranian6 0.02% Dutch
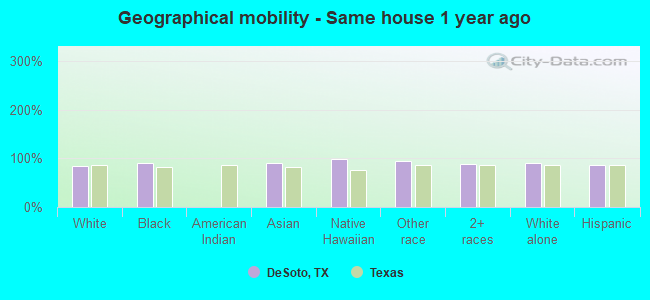
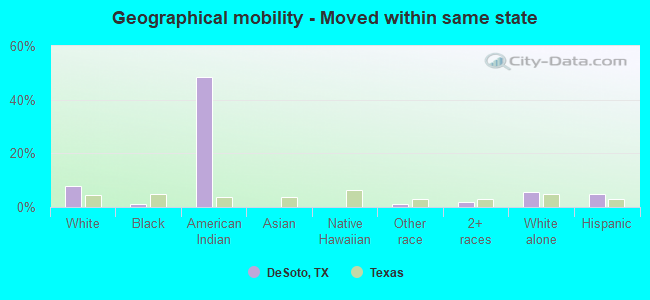
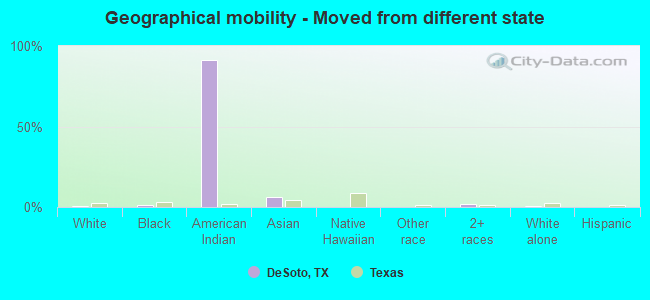
Geographical mobility in DeSoto Same house 1 year ago 5,908 83.9% White (Caucasian)33,530 91.1% Black or African American485 91.4% Asian84 98.2% Native Hawaiian / Pacific Islander4,433 94.1% Other race6,426 87.5% Two or more races4,669 89.7% White alone, not Hispanic / Latino8,814 85.7% Hispanic or LatinoMoved within same county 547 7.8% White / Caucasian2,236 6.1% Black or African American8 1.5% Asian222 4.7% Other race620 8.4% Two or more races219 4.2% White alone, not Hispanic / Latino872 8.5% Hispanic or LatinoMoved within same state 563 8.0% White / Caucasian389 1.1% Black or African American35 48.4% American Indian / Alaska Native58 1.2% Other race132 1.8% Two or more races287 5.5% White alone, not Hispanic / Latino514 5.0% Hispanic or LatinoMoved from different state 27 0.4% White / Caucasian516 1.4% Black or African American65 91.2% American Indian / Alaska Native34 6.5% Asian121 1.6% Two or more races30 0.6% White alone, not Hispanic / Latino
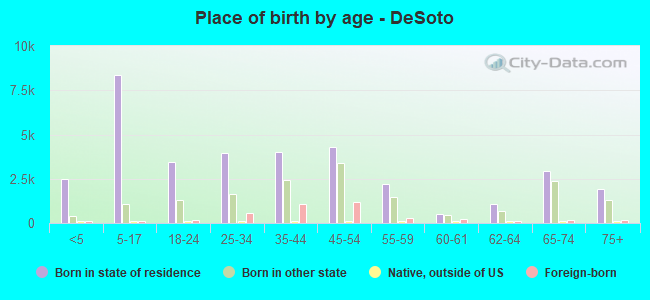
Children Nativity (place of birth) in DeSoto
Children under 6 years - Living with two parents Both parents native 1,194 100.0% NativeBoth parents foreign-born 538 100.0% NativeOne native, one foreign-born parent 204 100.0% NativeChildren under 6 years - Living with one parent Native parent 1,340 100.0% NativeForeign-born parent 52 100.0% NativeChildren 6 to 17 years - Living with two parents Both parents native 2,646 99.4% Native16 0.6% Foreign-bornBoth parents foreign-born 1,285 93.6% Native88 6.4% Foreign-bornOne native, one foreign-born parent 537 100.0% NativeChildren 6 to 17 years - Living with one parent Native parent 3,278 100.0% NativeForeign-born parent 337 50.7% Native328 49.3% Foreign-born
Grandparents responsible for own grandchildren in DeSoto
Grandparents (30 to 59 years) White / Caucasian 45 42.5% Responsible for grandchildren61 57.5% Not responsible for grandchildrenBlack or African American 330 55.6% Responsible for grandchildren264 44.4% Not responsible for grandchildrenAsian 5 100.0% Not responsible for grandchildrenOther race 23 100.0% Not responsible for grandchildrenWhite alone, not Hispanic / Latino 92 100.0% Responsible for grandchildrenHispanic or Latino 109 100.0% Not responsible for grandchildrenGrandparents (60 years and over) White / Caucasian 43 27.9% Responsible for grandchildren112 72.1% Not responsible for grandchildrenBlack or African American 391 45.7% Responsible for grandchildren465 54.3% Not responsible for grandchildrenWhite alone, not Hispanic / Latino 55 41.0% Responsible for grandchildren79 59.0% Not responsible for grandchildrenHispanic or Latino 116 100.0% Not responsible for grandchildren