Races in Cuero, Texas (TX) Detailed Stats
Data:
Races - White alone (%)
Races - White alone (% change since 2000)
Races - Black alone (%)
Races - Black alone (% change since 2000)
Races - American Indian alone (%)
Races - American Indian alone (% change since 2000)
Races - Asian alone (%)
Races - Asian alone (% change since 2000)
Races - Hispanic (%)
Races - Hispanic (% change since 2000)
Races - Native Hawaiian and Other Pacific Islander alone (%)
Races - Native Hawaiian and Other Pacific Islander alone (% change since 2000)
Races - Two or more races(%)
Races - Two or more races(% change since 2000)
Races - Other race alone (%)
Races - Other race alone (% change since 2000)
Racial diversity
Place of birth - Born in state of residence (%)
Place of birth - Born in state of residence (%) - White
Place of birth - Born in state of residence (%) - Black or African American
Place of birth - Born in state of residence (%) - Asian
Place of birth - Born in state of residence (%) - Hispanic or Latino
Place of birth - Born in state of residence (%) - American Indian and Alaska Native
Place of birth - Born in state of residence (%) - Multirace
Place of birth - Born in state of residence (%) - Other Race
Place of birth - Born in other state (%)
Place of birth - Born in other state (%) - White
Place of birth - Born in other state (%) - Black or African American
Place of birth - Born in other state (%) - Asian
Place of birth - Born in other state (%) - Hispanic or Latino
Place of birth - Born in other state (%) - American Indian and Alaska Native
Place of birth - Born in other state (%) - Multirace
Place of birth - Born in other state (%) - Other Race
Place of birth - Native, outside of US (%)
Place of birth - Native, outside of US (%) - White
Place of birth - Native, outside of US (%) - Black or African American
Place of birth - Native, outside of US (%) - Asian
Place of birth - Native, outside of US (%) - Hispanic or Latino
Place of birth - Native, outside of US (%) - American Indian and Alaska Native
Place of birth - Native, outside of US (%) - Multirace
Place of birth - Native, outside of US (%) - Other Race
Place of birth - Foreign born (%)
Place of birth - Foreign born (%) - White
Place of birth - Foreign born (%) - Black or African American
Place of birth - Foreign born (%) - Asian
Place of birth - Foreign born (%) - Hispanic or Latino
Place of birth - Foreign born (%) - American Indian and Alaska Native
Place of birth - Foreign born (%) - Multirace
Place of birth - Foreign born (%) - Other Race
Residents speaking English at home (%)
Residents speaking English at home - Born in the United States (%)
Residents speaking English at home - Native, born elsewhere (%)
Residents speaking English at home - Foreign born (%)
Residents speaking Spanish at home (%)
Residents speaking Spanish at home - Born in the United States (%)
Residents speaking Spanish at home - Native, born elsewhere (%)
Residents speaking Spanish at home - Foreign born (%)
Residents speaking other language at home (%)
Residents speaking other language at home - Born in the United States (%)
Residents speaking other language at home - Native, born elsewhere (%)
Residents speaking other language at home - Foreign born (%)
Marital status - Never married (%)
Marital status - Now married (%)
Marital status - Separated (%)
Marital status - Widowed (%)
Marital status - Divorced (%)
Ancestries Reported - Arab (%)
Ancestries Reported - Czech (%)
Ancestries Reported - Danish (%)
Ancestries Reported - Dutch (%)
Ancestries Reported - English (%)
Ancestries Reported - French (%)
Ancestries Reported - French Canadian (%)
Ancestries Reported - German (%)
Ancestries Reported - Greek (%)
Ancestries Reported - Hungarian (%)
Ancestries Reported - Irish (%)
Ancestries Reported - Italian (%)
Ancestries Reported - Lithuanian (%)
Ancestries Reported - Norwegian (%)
Ancestries Reported - Polish (%)
Ancestries Reported - Portuguese (%)
Ancestries Reported - Russian (%)
Ancestries Reported - Scotch-Irish (%)
Ancestries Reported - Scottish (%)
Ancestries Reported - Slovak (%)
Ancestries Reported - Subsaharan African (%)
Ancestries Reported - Swedish (%)
Ancestries Reported - Swiss (%)
Ancestries Reported - Ukrainian (%)
Ancestries Reported - United States (%)
Ancestries Reported - Welsh (%)
Ancestries Reported - West Indian (%)
Ancestries Reported - Other (%)
Geographical mobility - Same house 1 year ago (%)
Geographical mobility - Same house 1 year ago (%) - White
Geographical mobility - Same house 1 year ago (%) - Black or African American
Geographical mobility - Same house 1 year ago (%) - Asian
Geographical mobility - Same house 1 year ago (%) - Hispanic or Latino
Geographical mobility - Same house 1 year ago (%) - American Indian and Alaska Native
Geographical mobility - Same house 1 year ago (%) - Multirace
Geographical mobility - Same house 1 year ago (%) - Other Race
Geographical mobility - Moved within same county (%)
Geographical mobility - Moved within same county (%) - White
Geographical mobility - Moved within same county (%) - Black or African American
Geographical mobility - Moved within same county (%) - Asian
Geographical mobility - Moved within same county (%) - Hispanic or Latino
Geographical mobility - Moved within same county (%) - American Indian and Alaska Native
Geographical mobility - Moved within same county (%) - Multirace
Geographical mobility - Moved within same county (%) - Other Race
Geographical mobility - Moved from different county within same state (%)
Geographical mobility - Moved from different county within same state (%) - White
Geographical mobility - Moved from different county within same state (%) - Black or African American
Geographical mobility - Moved from different county within same state (%) - Asian
Geographical mobility - Moved from different county within same state (%) - Hispanic or Latino
Geographical mobility - Moved from different county within same state (%) - American Indian and Alaska Native
Geographical mobility - Moved from different county within same state (%) - Multirace
Geographical mobility - Moved from different county within same state (%) - Other Race
Geographical mobility - Moved from different state (%)
Geographical mobility - Moved from different state (%) - White
Geographical mobility - Moved from different state (%) - Black or African American
Geographical mobility - Moved from different state (%) - Asian
Geographical mobility - Moved from different state (%) - Hispanic or Latino
Geographical mobility - Moved from different state (%) - American Indian and Alaska Native
Geographical mobility - Moved from different state (%) - Multirace
Geographical mobility - Moved from different state (%) - Other Race
Geographical mobility - Moved from abroad (%)
Geographical mobility - Moved from abroad (%) - White
Geographical mobility - Moved from abroad (%) - Black or African American
Geographical mobility - Moved from abroad (%) - Asian
Geographical mobility - Moved from abroad (%) - Hispanic or Latino
Geographical mobility - Moved from abroad (%) - American Indian and Alaska Native
Geographical mobility - Moved from abroad (%) - Multirace
Geographical mobility - Moved from abroad (%) - Other Race
Place of birth for the foreign-born population - Ireland (%)
Place of birth for the foreign-born population - Denmark (%)
Place of birth for the foreign-born population - Norway (%)
Place of birth for the foreign-born population - Sweden (%)
Place of birth for the foreign-born population - United Kingdom (%)
Place of birth for the foreign-born population - England (%)
Place of birth for the foreign-born population - Scotland (%)
Place of birth for the foreign-born population - Other Northern Europe (%)
Place of birth for the foreign-born population - Austria (%)
Place of birth for the foreign-born population - Belgium (%)
Place of birth for the foreign-born population - France (%)
Place of birth for the foreign-born population - Germany (%)
Place of birth for the foreign-born population - Netherlands (%)
Place of birth for the foreign-born population - Switzerland (%)
Place of birth for the foreign-born population - Other Western Europe (%)
Place of birth for the foreign-born population - Greece (%)
Place of birth for the foreign-born population - Italy (%)
Place of birth for the foreign-born population - Portugal (%)
Place of birth for the foreign-born population - Spain (%)
Place of birth for the foreign-born population - Other Southern Europe (%)
Place of birth for the foreign-born population - Albania (%)
Place of birth for the foreign-born population - Belarus (%)
Place of birth for the foreign-born population - Bosnia and Herzegovina (%)
Place of birth for the foreign-born population - Bulgaria (%)
Place of birth for the foreign-born population - Croatia (%)
Place of birth for the foreign-born population - Czechoslovakia (%)
Place of birth for the foreign-born population - Hungary (%)
Place of birth for the foreign-born population - Latvia (%)
Place of birth for the foreign-born population - Lithuania (%)
Place of birth for the foreign-born population - North Macedonia (Macedonia) (%)
Place of birth for the foreign-born population - Moldova (%)
Place of birth for the foreign-born population - Poland (%)
Place of birth for the foreign-born population - Romania (%)
Place of birth for the foreign-born population - Russia (%)
Place of birth for the foreign-born population - Serbia (%)
Place of birth for the foreign-born population - Ukraine (%)
Place of birth for the foreign-born population - Other Eastern Europe (%)
Place of birth for the foreign-born population - China (%)
Place of birth for the foreign-born population - Hong Kong (%)
Place of birth for the foreign-born population - Taiwan (%)
Place of birth for the foreign-born population - Japan (%)
Place of birth for the foreign-born population - Korea (%)
Place of birth for the foreign-born population - Other Eastern Asia (%)
Place of birth for the foreign-born population - Afghanistan (%)
Place of birth for the foreign-born population - Bangladesh (%)
Place of birth for the foreign-born population - India (%)
Place of birth for the foreign-born population - Iran (%)
Place of birth for the foreign-born population - Kazakhstan (%)
Place of birth for the foreign-born population - Nepal (%)
Place of birth for the foreign-born population - Pakistan (%)
Place of birth for the foreign-born population - Sri Lanka (%)
Place of birth for the foreign-born population - Uzbekistan (%)
Place of birth for the foreign-born population - Other South Central Asia (%)
Place of birth for the foreign-born population - Burma (%)
Place of birth for the foreign-born population - Cambodia (%)
Place of birth for the foreign-born population - Indonesia (%)
Place of birth for the foreign-born population - Laos (%)
Place of birth for the foreign-born population - Malaysia (%)
Place of birth for the foreign-born population - Philippines (%)
Place of birth for the foreign-born population - Singapore (%)
Place of birth for the foreign-born population - Thailand (%)
Place of birth for the foreign-born population - Vietnam (%)
Place of birth for the foreign-born population - Other South Eastern Asia (%)
Place of birth for the foreign-born population - Armenia (%)
Place of birth for the foreign-born population - Iraq (%)
Place of birth for the foreign-born population - Israel (%)
Place of birth for the foreign-born population - Jordan (%)
Place of birth for the foreign-born population - Kuwait (%)
Place of birth for the foreign-born population - Lebanon (%)
Place of birth for the foreign-born population - Saudi Arabia (%)
Place of birth for the foreign-born population - Syria (%)
Place of birth for the foreign-born population - Turkey (%)
Place of birth for the foreign-born population - Yemen (%)
Place of birth for the foreign-born population - Other Western Asia (%)
Place of birth for the foreign-born population - Eritrea (%)
Place of birth for the foreign-born population - Ethiopia (%)
Place of birth for the foreign-born population - Kenya (%)
Place of birth for the foreign-born population - Somalia (%)
Place of birth for the foreign-born population - Uganda (%)
Place of birth for the foreign-born population - Zimbabwe (%)
Place of birth for the foreign-born population - Other Eastern Africa (%)
Place of birth for the foreign-born population - Cameroon (%)
Place of birth for the foreign-born population - Congo (%)
Place of birth for the foreign-born population - Democratic Republic of Congo (Zaire) (%)
Place of birth for the foreign-born population - Other Middle Africa (%)
Place of birth for the foreign-born population - Egypt (%)
Place of birth for the foreign-born population - Morocco (%)
Place of birth for the foreign-born population - Sudan (%)
Place of birth for the foreign-born population - Other Northern Africa (%)
Place of birth for the foreign-born population - South Africa (%)
Place of birth for the foreign-born population - Other Southern Africa (%)
Place of birth for the foreign-born population - Cabo Verde (%)
Place of birth for the foreign-born population - Ghana (%)
Place of birth for the foreign-born population - Liberia (%)
Place of birth for the foreign-born population - Nigeria (%)
Place of birth for the foreign-born population - Senegal (%)
Place of birth for the foreign-born population - Sierra Leone (%)
Place of birth for the foreign-born population - Other Western Africa (%)
Place of birth for the foreign-born population - Australia (%)
Place of birth for the foreign-born population - New Zealand (%)
Place of birth for the foreign-born population - Fiji (%)
Place of birth for the foreign-born population - Micronesia (%)
Place of birth for the foreign-born population - Bahamas (%)
Place of birth for the foreign-born population - Barbados (%)
Place of birth for the foreign-born population - Cuba (%)
Place of birth for the foreign-born population - Dominica (%)
Place of birth for the foreign-born population - Dominican Republic (%)
Place of birth for the foreign-born population - Grenada (%)
Place of birth for the foreign-born population - Haiti (%)
Place of birth for the foreign-born population - Jamaica (%)
Place of birth for the foreign-born population - St. Vincent and the Grenadines (%)
Place of birth for the foreign-born population - Trinidad and Tobago (%)
Place of birth for the foreign-born population - West Indies (%)
Place of birth for the foreign-born population - Other Caribbean (%)
Place of birth for the foreign-born population - Belize (%)
Place of birth for the foreign-born population - Costa Rica (%)
Place of birth for the foreign-born population - El Salvador (%)
Place of birth for the foreign-born population - Guatemala (%)
Place of birth for the foreign-born population - Honduras (%)
Place of birth for the foreign-born population - Mexico (%)
Place of birth for the foreign-born population - Nicaragua (%)
Place of birth for the foreign-born population - Panama (%)
Place of birth for the foreign-born population - Other Central America (%)
Place of birth for the foreign-born population - Argentina (%)
Place of birth for the foreign-born population - Bolivia (%)
Place of birth for the foreign-born population - Brazil (%)
Place of birth for the foreign-born population - Chile (%)
Place of birth for the foreign-born population - Colombia (%)
Place of birth for the foreign-born population - Ecuador (%)
Place of birth for the foreign-born population - Guyana (%)
Place of birth for the foreign-born population - Peru (%)
Place of birth for the foreign-born population - Uruguay (%)
Place of birth for the foreign-born population - Venezuela (%)
Place of birth for the foreign-born population - Other South America (%)
Place of birth for the foreign-born population - Canada (%)
Place of birth for the foreign-born population - Other Northern America (%)
Place of birth for the foreign-born population - Other (%)
Latest news about races in Cuero, TX collected exclusively by city-data.com from local newspapers, TV, and radio stations
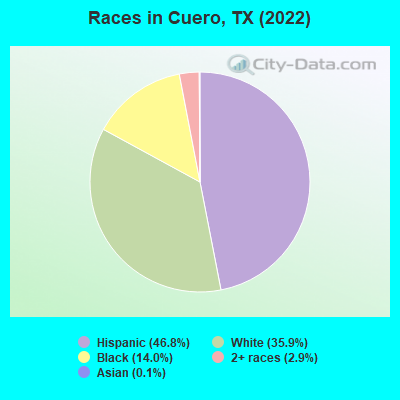
According to 2022 data, the most numerous races in Cuero, TX are Hispanic (3,909 residents), White alone (2,996 residents), and Black alone (1,168 residents). 78.4% of Cuero residents speak English at home. 2.7% of Cuero, TX residents are foreign-born (2.6% born in Latin America), which is 531.4% less than the foreign-born rate of 17.0% across the entire state of Texas.
Race distribution in Cuero
2000 2022
10,933,313 52.4% White alone 6,669,666 32.0% Hispanic 2,364,255 11.3% Black alone 554,445 2.7% Asian alone 230,567 1.1% Two or more races 68,859 0.3% American Indian alone 19,958 0.10% Other race alone 10,757 0.05% Native Hawaiian and Other
12,070,642 40.2% Hispanic 11,683,430 38.9% White alone 3,508,706 11.7% Black alone 1,608,173 5.4% Asian alone 956,560 3.2% Two or more races 125,763 0.4% Other race alone 47,023 0.2% American Indian alone 29,275 0.10% Native Hawaiian and Other
Income and house value in Cuero Median household income in 2022 $58,751 White non-Hispanic householders$32,990 Black householders$54,740 Some other race householders$54,156 Hispanic or Latino race householdersMedian 2022 house value $257,696 White Non-Hispanic householders$134,001 Black or African American householders$351,403 American Indian or Alaska Native householders$120,414 Some other race householders$58,567 Two or more races householders$126,505 Hispanic or Latino householders
Median age by race in Cuero
38.9 Median age for White residents36.7 44.0 46.3 Median age for Black or African American residents41.0 53.8 3.7 Median age for American Indian / Alaska Native residents3.7 2.1 32.7 Median age for Asian residents-683,426,442.5 -679,245,282.3 -581,560,283.1 Median age for Native Hawaiian / Pacific Islander residents-612,729,233.5 -577,777,777.2 37.6 Median age for Other race residents38.3 33.4 44.2 Median age for Two or more races residents44.8 43.5 38.7 Median age for White alone residents38.0 41.6 37.1 Median age for Hispanic or Latino residents37.1 37.3
Owner/renter occupied households by race in Cuero
House owners and renters - White residents 788 63.0% Owner occupied462 37.0% Renter occupiedHouse owners and renters - Black or African American residents 100 28.5% Owner occupied252 71.5% Renter occupiedHouse owners and renters - American Indian / Alaska Native residents 16 74.9% Owner occupied5 25.1% Renter occupiedHouse owners and renters - Asian residents 10 100.0% Renter occupiedHouse owners and renters - Other race residents 278 57.9% Owner occupied203 42.1% Renter occupiedHouse owners and renters - Two or more races residents 122 49.5% Owner occupied124 50.5% Renter occupiedHouse owners and renters - White alone residents 752 61.2% Owner occupied476 38.8% Renter occupiedHouse owners and renters - Hispanic or Latino residents 438 58.7% Owner occupied308 41.3% Renter occupied
Language usage in Cuero
English speakers - Total 78.4% of residents of Cuero speak English at home.
20.9% of residents speak Spanish at home 1,133 69.5% Speak English very well497 30.5% Speak English less than very well0.5% of residents speak other language at home 24 60.0% Speak English very well16 40.0% Speak English less than very well
English speakers - Born in the United States 84.7% of residents of Cuero speak English at home.
14.1% of residents speak Spanish at home 69 48.6% Speak English very well73 51.4% Speak English less than very well0.8% of residents speak other language at home 8 100.0% Speak English less than very well
English speakers - Native, born elsewhere 46.2% of residents of Cuero speak English at home.
50.0% of residents speak Spanish at home 4 30.8% Speak English very well9 69.2% Speak English less than very well
English speakers - Foreign-born 21.3% of residents of Cuero speak English at home.
73.3% of residents speak Spanish at home 48 29.1% Speak English very well117 70.9% Speak English less than very well4.0% of residents speak other language at home 9 100.0% Speak English less than very well
American Indian / Alaska Native - Speak another language Native:
95.6% (29)Foreign-born:
98.9% (57)
Asian - Speak another language Native:
43.3% (8)Foreign-born:
99.6% (2)
Other race - Speak only English Native:
52.3% (1,366)Foreign-born:
7.7% (10)
Other race - Speak another language Native:
48.8% (1,273)Foreign-born:
92.4% (119)
Two or more races - Speak only English Native:
79.3% (988)Foreign-born:
48.7% (65)
Two or more races - Speak another language Native:
16.1% (200)Foreign-born:
48.9% (65)
Hispanic or Latino - Speak only English Native:
58.8% (2,003)Foreign-born:
24.3% (52)
Hispanic or Latino - Speak another language Native:
41.7% (1,420)Foreign-born:
77.2% (166)
Foreign-born residents in Cuero 225 residents are foreign born (2.6% Latin America ).
This city:
2.7%Texas:
17.1%
Marital status for residents in Cuero Marital status - White (Caucasian) population 15 years and over
Males 38.2% Never married38.9% Now married2.5% Separated2.9% Widowed17.5% DivorcedFemales 21.8% Never married42.2% Now married7.6% Separated17.5% Widowed10.9% DivorcedWomen who gave birth in the past 12 months Now married:
100.0% (50)Unmarried:
0.0% (0)
Women who did not give birth in the past 12 months Now married:
57.7% (322)Unmarried:
42.3% (237)
Marital status - Black or African American population 15 years and over
Males 52.1% Never married37.2% Now married0.0% Separated0.9% Widowed9.9% DivorcedFemales 28.4% Never married23.9% Now married0.0% Separated9.9% Widowed37.8% DivorcedWomen who did not give birth in the past 12 months Now married:
18.1% (28)Unmarried:
81.9% (128)
Marital status - American Indian / Alaska Native population 15 years and over
Males 100.0% Never married0.0% Now married0.0% Separated0.0% Widowed0.0% DivorcedFemales 0.0% Never married100.0% Now married0.0% Separated0.0% Widowed0.0% DivorcedWomen who gave birth in the past 12 months Now married:
100.0% (46)Unmarried:
0.0% (0)
Women who did not give birth in the past 12 months Now married:
100.0% (16)Unmarried:
0.0% (0)
Marital status - Asian population 15 years and over
Males 77.8% Never married22.2% Now married0.0% Separated0.0% Widowed0.0% DivorcedFemales 0.0% Never married100.0% Now married0.0% Separated0.0% Widowed0.0% DivorcedWomen who did not give birth in the past 12 months Now married:
100.0% (10)Unmarried:
0.0% (0)
Marital status - Other race population 15 years and over
Males 34.0% Never married40.7% Now married7.0% Separated0.7% Widowed17.6% DivorcedFemales 16.6% Never married56.6% Now married0.8% Separated20.5% Widowed5.5% DivorcedWomen who gave birth in the past 12 months Now married:
100.0% (8)Unmarried:
0.0% (0)
Women who did not give birth in the past 12 months Now married:
69.5% (257)Unmarried:
30.5% (113)
Marital status - Two or more races population 15 years and over
Males 51.2% Never married28.5% Now married1.7% Separated6.2% Widowed12.4% DivorcedFemales 31.6% Never married47.3% Now married4.4% Separated8.8% Widowed7.8% DivorcedWomen who did not give birth in the past 12 months Now married:
34.8% (91)Unmarried:
65.2% (171)
Marital status - White alone, not Hispanic / Latino population 15 years and over
Males 34.7% Never married38.2% Now married3.1% Separated3.6% Widowed20.5% DivorcedFemales 22.2% Never married42.0% Now married8.3% Separated15.9% Widowed11.6% DivorcedWomen who gave birth in the past 12 months Now married:
100.0% (51)Unmarried:
0.0% (0)
Women who did not give birth in the past 12 months Now married:
52.7% (302)Unmarried:
47.3% (271)
Marital status - Hispanic or Latino population 15 years and over
Males 41.5% Never married38.6% Now married4.8% Separated0.7% Widowed14.4% DivorcedFemales 19.9% Never married53.7% Now married2.5% Separated17.8% Widowed6.1% DivorcedWomen who gave birth in the past 12 months Now married:
100.0% (51)Unmarried:
0.0% (0)
Women who did not give birth in the past 12 months Now married:
64.4% (372)Unmarried:
35.6% (206)
Ancestries in Cuero
611 10.6% German285 4.9% American128 2.2% Irish92 1.6% English53 0.9% Trinidadian and Tobagonian38 0.7% Polish35 0.6% Czech23 0.4% European21 0.4% Italian20 0.3% French20 0.3% African14 0.2% Scotch-Irish10 0.2% Swedish8 0.1% Pennsylvania German5 0.09% British
Geographical mobility in Cuero Same house 1 year ago 2,746 89.5% White (Caucasian)1,109 93.5% Black or African American218 99.9% American Indian / Alaska Native19 99.3% Asian2,574 89.3% Other race1,225 87.1% Two or more races2,654 89.4% White alone, not Hispanic / Latino3,446 89.1% Hispanic or LatinoMoved within same county 124 4.0% White / Caucasian15 1.3% Black or African American135 4.7% Other race133 9.4% Two or more races98 3.3% White alone, not Hispanic / Latino249 6.5% Hispanic or LatinoMoved within same state 192 6.3% White / Caucasian28 2.4% Black or African American5 2.3% American Indian / Alaska Native131 4.5% Other race44 3.1% Two or more races212 7.1% White alone, not Hispanic / Latino130 3.4% Hispanic or LatinoMoved from different state 16 0.5% White / Caucasian51 4.3% Black or African American39 1.3% Other race16 0.5% White alone, not Hispanic / Latino32 0.8% Hispanic or Latino
Children Nativity (place of birth) in Cuero
Children under 6 years - Living with two parents Both parents native 414 100.0% NativeOne native, one foreign-born parent 99 100.0% NativeChildren under 6 years - Living with one parent Native parent 191 100.0% Native
Children 6 to 17 years - Living with two parents Both parents native 875 100.0% NativeOne native, one foreign-born parent 6 100.0% Foreign-bornChildren 6 to 17 years - Living with one parent Native parent 137 100.0% Native
Place of birth for residents in Cuero 216 Americas216 Latin America212 Central America7 Africa7 Western Africa4 South America2 Asia2 South Central Asia
Grandparents responsible for own grandchildren in Cuero
Grandparents (30 to 59 years) White / Caucasian 9 100.0% Responsible for grandchildrenWhite alone, not Hispanic / Latino 12 100.0% Responsible for grandchildren
Grandparents (60 years and over)