Races in Corinth, Texas (TX) Detailed Stats
Data:
Races - White alone (%)
Races - White alone (% change since 2000)
Races - Black alone (%)
Races - Black alone (% change since 2000)
Races - American Indian alone (%)
Races - American Indian alone (% change since 2000)
Races - Asian alone (%)
Races - Asian alone (% change since 2000)
Races - Hispanic (%)
Races - Hispanic (% change since 2000)
Races - Native Hawaiian and Other Pacific Islander alone (%)
Races - Native Hawaiian and Other Pacific Islander alone (% change since 2000)
Races - Two or more races(%)
Races - Two or more races(% change since 2000)
Races - Other race alone (%)
Races - Other race alone (% change since 2000)
Racial diversity
Place of birth - Born in state of residence (%)
Place of birth - Born in state of residence (%) - White
Place of birth - Born in state of residence (%) - Black or African American
Place of birth - Born in state of residence (%) - Asian
Place of birth - Born in state of residence (%) - Hispanic or Latino
Place of birth - Born in state of residence (%) - American Indian and Alaska Native
Place of birth - Born in state of residence (%) - Multirace
Place of birth - Born in state of residence (%) - Other Race
Place of birth - Born in other state (%)
Place of birth - Born in other state (%) - White
Place of birth - Born in other state (%) - Black or African American
Place of birth - Born in other state (%) - Asian
Place of birth - Born in other state (%) - Hispanic or Latino
Place of birth - Born in other state (%) - American Indian and Alaska Native
Place of birth - Born in other state (%) - Multirace
Place of birth - Born in other state (%) - Other Race
Place of birth - Native, outside of US (%)
Place of birth - Native, outside of US (%) - White
Place of birth - Native, outside of US (%) - Black or African American
Place of birth - Native, outside of US (%) - Asian
Place of birth - Native, outside of US (%) - Hispanic or Latino
Place of birth - Native, outside of US (%) - American Indian and Alaska Native
Place of birth - Native, outside of US (%) - Multirace
Place of birth - Native, outside of US (%) - Other Race
Place of birth - Foreign born (%)
Place of birth - Foreign born (%) - White
Place of birth - Foreign born (%) - Black or African American
Place of birth - Foreign born (%) - Asian
Place of birth - Foreign born (%) - Hispanic or Latino
Place of birth - Foreign born (%) - American Indian and Alaska Native
Place of birth - Foreign born (%) - Multirace
Place of birth - Foreign born (%) - Other Race
Residents speaking English at home (%)
Residents speaking English at home - Born in the United States (%)
Residents speaking English at home - Native, born elsewhere (%)
Residents speaking English at home - Foreign born (%)
Residents speaking Spanish at home (%)
Residents speaking Spanish at home - Born in the United States (%)
Residents speaking Spanish at home - Native, born elsewhere (%)
Residents speaking Spanish at home - Foreign born (%)
Residents speaking other language at home (%)
Residents speaking other language at home - Born in the United States (%)
Residents speaking other language at home - Native, born elsewhere (%)
Residents speaking other language at home - Foreign born (%)
Marital status - Never married (%)
Marital status - Now married (%)
Marital status - Separated (%)
Marital status - Widowed (%)
Marital status - Divorced (%)
Ancestries Reported - Arab (%)
Ancestries Reported - Czech (%)
Ancestries Reported - Danish (%)
Ancestries Reported - Dutch (%)
Ancestries Reported - English (%)
Ancestries Reported - French (%)
Ancestries Reported - French Canadian (%)
Ancestries Reported - German (%)
Ancestries Reported - Greek (%)
Ancestries Reported - Hungarian (%)
Ancestries Reported - Irish (%)
Ancestries Reported - Italian (%)
Ancestries Reported - Lithuanian (%)
Ancestries Reported - Norwegian (%)
Ancestries Reported - Polish (%)
Ancestries Reported - Portuguese (%)
Ancestries Reported - Russian (%)
Ancestries Reported - Scotch-Irish (%)
Ancestries Reported - Scottish (%)
Ancestries Reported - Slovak (%)
Ancestries Reported - Subsaharan African (%)
Ancestries Reported - Swedish (%)
Ancestries Reported - Swiss (%)
Ancestries Reported - Ukrainian (%)
Ancestries Reported - United States (%)
Ancestries Reported - Welsh (%)
Ancestries Reported - West Indian (%)
Ancestries Reported - Other (%)
Geographical mobility - Same house 1 year ago (%)
Geographical mobility - Same house 1 year ago (%) - White
Geographical mobility - Same house 1 year ago (%) - Black or African American
Geographical mobility - Same house 1 year ago (%) - Asian
Geographical mobility - Same house 1 year ago (%) - Hispanic or Latino
Geographical mobility - Same house 1 year ago (%) - American Indian and Alaska Native
Geographical mobility - Same house 1 year ago (%) - Multirace
Geographical mobility - Same house 1 year ago (%) - Other Race
Geographical mobility - Moved within same county (%)
Geographical mobility - Moved within same county (%) - White
Geographical mobility - Moved within same county (%) - Black or African American
Geographical mobility - Moved within same county (%) - Asian
Geographical mobility - Moved within same county (%) - Hispanic or Latino
Geographical mobility - Moved within same county (%) - American Indian and Alaska Native
Geographical mobility - Moved within same county (%) - Multirace
Geographical mobility - Moved within same county (%) - Other Race
Geographical mobility - Moved from different county within same state (%)
Geographical mobility - Moved from different county within same state (%) - White
Geographical mobility - Moved from different county within same state (%) - Black or African American
Geographical mobility - Moved from different county within same state (%) - Asian
Geographical mobility - Moved from different county within same state (%) - Hispanic or Latino
Geographical mobility - Moved from different county within same state (%) - American Indian and Alaska Native
Geographical mobility - Moved from different county within same state (%) - Multirace
Geographical mobility - Moved from different county within same state (%) - Other Race
Geographical mobility - Moved from different state (%)
Geographical mobility - Moved from different state (%) - White
Geographical mobility - Moved from different state (%) - Black or African American
Geographical mobility - Moved from different state (%) - Asian
Geographical mobility - Moved from different state (%) - Hispanic or Latino
Geographical mobility - Moved from different state (%) - American Indian and Alaska Native
Geographical mobility - Moved from different state (%) - Multirace
Geographical mobility - Moved from different state (%) - Other Race
Geographical mobility - Moved from abroad (%)
Geographical mobility - Moved from abroad (%) - White
Geographical mobility - Moved from abroad (%) - Black or African American
Geographical mobility - Moved from abroad (%) - Asian
Geographical mobility - Moved from abroad (%) - Hispanic or Latino
Geographical mobility - Moved from abroad (%) - American Indian and Alaska Native
Geographical mobility - Moved from abroad (%) - Multirace
Geographical mobility - Moved from abroad (%) - Other Race
Place of birth for the foreign-born population - Ireland (%)
Place of birth for the foreign-born population - Denmark (%)
Place of birth for the foreign-born population - Norway (%)
Place of birth for the foreign-born population - Sweden (%)
Place of birth for the foreign-born population - United Kingdom (%)
Place of birth for the foreign-born population - England (%)
Place of birth for the foreign-born population - Scotland (%)
Place of birth for the foreign-born population - Other Northern Europe (%)
Place of birth for the foreign-born population - Austria (%)
Place of birth for the foreign-born population - Belgium (%)
Place of birth for the foreign-born population - France (%)
Place of birth for the foreign-born population - Germany (%)
Place of birth for the foreign-born population - Netherlands (%)
Place of birth for the foreign-born population - Switzerland (%)
Place of birth for the foreign-born population - Other Western Europe (%)
Place of birth for the foreign-born population - Greece (%)
Place of birth for the foreign-born population - Italy (%)
Place of birth for the foreign-born population - Portugal (%)
Place of birth for the foreign-born population - Spain (%)
Place of birth for the foreign-born population - Other Southern Europe (%)
Place of birth for the foreign-born population - Albania (%)
Place of birth for the foreign-born population - Belarus (%)
Place of birth for the foreign-born population - Bosnia and Herzegovina (%)
Place of birth for the foreign-born population - Bulgaria (%)
Place of birth for the foreign-born population - Croatia (%)
Place of birth for the foreign-born population - Czechoslovakia (%)
Place of birth for the foreign-born population - Hungary (%)
Place of birth for the foreign-born population - Latvia (%)
Place of birth for the foreign-born population - Lithuania (%)
Place of birth for the foreign-born population - North Macedonia (Macedonia) (%)
Place of birth for the foreign-born population - Moldova (%)
Place of birth for the foreign-born population - Poland (%)
Place of birth for the foreign-born population - Romania (%)
Place of birth for the foreign-born population - Russia (%)
Place of birth for the foreign-born population - Serbia (%)
Place of birth for the foreign-born population - Ukraine (%)
Place of birth for the foreign-born population - Other Eastern Europe (%)
Place of birth for the foreign-born population - China (%)
Place of birth for the foreign-born population - Hong Kong (%)
Place of birth for the foreign-born population - Taiwan (%)
Place of birth for the foreign-born population - Japan (%)
Place of birth for the foreign-born population - Korea (%)
Place of birth for the foreign-born population - Other Eastern Asia (%)
Place of birth for the foreign-born population - Afghanistan (%)
Place of birth for the foreign-born population - Bangladesh (%)
Place of birth for the foreign-born population - India (%)
Place of birth for the foreign-born population - Iran (%)
Place of birth for the foreign-born population - Kazakhstan (%)
Place of birth for the foreign-born population - Nepal (%)
Place of birth for the foreign-born population - Pakistan (%)
Place of birth for the foreign-born population - Sri Lanka (%)
Place of birth for the foreign-born population - Uzbekistan (%)
Place of birth for the foreign-born population - Other South Central Asia (%)
Place of birth for the foreign-born population - Burma (%)
Place of birth for the foreign-born population - Cambodia (%)
Place of birth for the foreign-born population - Indonesia (%)
Place of birth for the foreign-born population - Laos (%)
Place of birth for the foreign-born population - Malaysia (%)
Place of birth for the foreign-born population - Philippines (%)
Place of birth for the foreign-born population - Singapore (%)
Place of birth for the foreign-born population - Thailand (%)
Place of birth for the foreign-born population - Vietnam (%)
Place of birth for the foreign-born population - Other South Eastern Asia (%)
Place of birth for the foreign-born population - Armenia (%)
Place of birth for the foreign-born population - Iraq (%)
Place of birth for the foreign-born population - Israel (%)
Place of birth for the foreign-born population - Jordan (%)
Place of birth for the foreign-born population - Kuwait (%)
Place of birth for the foreign-born population - Lebanon (%)
Place of birth for the foreign-born population - Saudi Arabia (%)
Place of birth for the foreign-born population - Syria (%)
Place of birth for the foreign-born population - Turkey (%)
Place of birth for the foreign-born population - Yemen (%)
Place of birth for the foreign-born population - Other Western Asia (%)
Place of birth for the foreign-born population - Eritrea (%)
Place of birth for the foreign-born population - Ethiopia (%)
Place of birth for the foreign-born population - Kenya (%)
Place of birth for the foreign-born population - Somalia (%)
Place of birth for the foreign-born population - Uganda (%)
Place of birth for the foreign-born population - Zimbabwe (%)
Place of birth for the foreign-born population - Other Eastern Africa (%)
Place of birth for the foreign-born population - Cameroon (%)
Place of birth for the foreign-born population - Congo (%)
Place of birth for the foreign-born population - Democratic Republic of Congo (Zaire) (%)
Place of birth for the foreign-born population - Other Middle Africa (%)
Place of birth for the foreign-born population - Egypt (%)
Place of birth for the foreign-born population - Morocco (%)
Place of birth for the foreign-born population - Sudan (%)
Place of birth for the foreign-born population - Other Northern Africa (%)
Place of birth for the foreign-born population - South Africa (%)
Place of birth for the foreign-born population - Other Southern Africa (%)
Place of birth for the foreign-born population - Cabo Verde (%)
Place of birth for the foreign-born population - Ghana (%)
Place of birth for the foreign-born population - Liberia (%)
Place of birth for the foreign-born population - Nigeria (%)
Place of birth for the foreign-born population - Senegal (%)
Place of birth for the foreign-born population - Sierra Leone (%)
Place of birth for the foreign-born population - Other Western Africa (%)
Place of birth for the foreign-born population - Australia (%)
Place of birth for the foreign-born population - New Zealand (%)
Place of birth for the foreign-born population - Fiji (%)
Place of birth for the foreign-born population - Micronesia (%)
Place of birth for the foreign-born population - Bahamas (%)
Place of birth for the foreign-born population - Barbados (%)
Place of birth for the foreign-born population - Cuba (%)
Place of birth for the foreign-born population - Dominica (%)
Place of birth for the foreign-born population - Dominican Republic (%)
Place of birth for the foreign-born population - Grenada (%)
Place of birth for the foreign-born population - Haiti (%)
Place of birth for the foreign-born population - Jamaica (%)
Place of birth for the foreign-born population - St. Vincent and the Grenadines (%)
Place of birth for the foreign-born population - Trinidad and Tobago (%)
Place of birth for the foreign-born population - West Indies (%)
Place of birth for the foreign-born population - Other Caribbean (%)
Place of birth for the foreign-born population - Belize (%)
Place of birth for the foreign-born population - Costa Rica (%)
Place of birth for the foreign-born population - El Salvador (%)
Place of birth for the foreign-born population - Guatemala (%)
Place of birth for the foreign-born population - Honduras (%)
Place of birth for the foreign-born population - Mexico (%)
Place of birth for the foreign-born population - Nicaragua (%)
Place of birth for the foreign-born population - Panama (%)
Place of birth for the foreign-born population - Other Central America (%)
Place of birth for the foreign-born population - Argentina (%)
Place of birth for the foreign-born population - Bolivia (%)
Place of birth for the foreign-born population - Brazil (%)
Place of birth for the foreign-born population - Chile (%)
Place of birth for the foreign-born population - Colombia (%)
Place of birth for the foreign-born population - Ecuador (%)
Place of birth for the foreign-born population - Guyana (%)
Place of birth for the foreign-born population - Peru (%)
Place of birth for the foreign-born population - Uruguay (%)
Place of birth for the foreign-born population - Venezuela (%)
Place of birth for the foreign-born population - Other South America (%)
Place of birth for the foreign-born population - Canada (%)
Place of birth for the foreign-born population - Other Northern America (%)
Place of birth for the foreign-born population - Other (%)
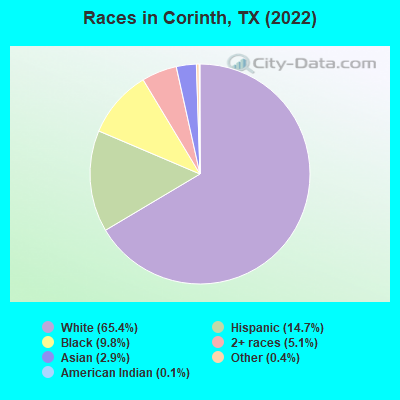
According to 2022 data, the most numerous races in Corinth, TX are Hispanic (3,537 residents), White alone (15,731 residents), and Black alone (2,358 residents). 86.3% of Corinth residents speak English at home. 6.8% of Corinth, TX residents are foreign-born (3.3% born in Latin America, 1.6% born in Asia, 0.9% born in North America, 0.9% born in Europe), which is 151.2% less than the foreign-born rate of 17.0% across the entire state of Texas.
Race distribution in Corinth
2000 2022
10,933,313 52.4% White alone 6,669,666 32.0% Hispanic 2,364,255 11.3% Black alone 554,445 2.7% Asian alone 230,567 1.1% Two or more races 68,859 0.3% American Indian alone 19,958 0.10% Other race alone 10,757 0.05% Native Hawaiian and Other
12,070,642 40.2% Hispanic 11,683,430 38.9% White alone 3,508,706 11.7% Black alone 1,608,173 5.4% Asian alone 956,560 3.2% Two or more races 125,763 0.4% Other race alone 47,023 0.2% American Indian alone 29,275 0.10% Native Hawaiian and Other
Income and house value in Corinth Median household income in 2022 $121,375 White non-Hispanic householders$99,404 Black householders$58,365 Asian householders$116,620 Two or more races householders$84,658 Hispanic or Latino race householdersMedian 2022 house value $366,451 White Non-Hispanic householders$367,973 Black or African American householders$412,099 American Indian or Alaska Native householders $370,255 Asian householders$316,999 Some other race householders$448,871 Two or more races householders$363,154 Hispanic or Latino householders
Median age by race in Corinth
42.5 Median age for White residents40.6 46.9 32.7 Median age for Black or African American residents24.8 35.2 35.9 Median age for American Indian / Alaska Native residents23.9 -734,693,876.8 42.8 Median age for Asian residents28.3 52.2 -305,343,511.1 Median age for Native Hawaiian / Pacific Islander residents-601,801,801.2 -656,771,799.0 44.1 Median age for Other race residents56.0 39.8 27.1 Median age for Two or more races residents26.3 27.3 42.5 Median age for White alone residents41.1 46.0 37.2 Median age for Hispanic or Latino residents34.0 40.5
Owner/renter occupied households by race in Corinth
House owners and renters - White residents 4,858 76.4% Owner occupied1,501 23.6% Renter occupiedHouse owners and renters - Black or African American residents 374 61.0% Owner occupied239 39.0% Renter occupiedHouse owners and renters - American Indian / Alaska Native residents 71 76.9% Owner occupied21 23.1% Renter occupiedHouse owners and renters - Asian residents 188 85.7% Owner occupied31 14.3% Renter occupiedHouse owners and renters - Other race residents 253 94.1% Owner occupied16 5.9% Renter occupiedHouse owners and renters - Two or more races residents 617 86.0% Owner occupied100 14.0% Renter occupiedHouse owners and renters - White alone residents 4,903 79.1% Owner occupied1,298 20.9% Renter occupiedHouse owners and renters - Hispanic or Latino residents 722 64.7% Owner occupied394 35.3% Renter occupied
Language usage in Corinth
English speakers - Total 86.3% of residents of Corinth speak English at home.
7.9% of residents speak Spanish at home 1,283 70.1% Speak English very well547 29.9% Speak English less than very well5.5% of residents speak other language at home 1,145 90.1% Speak English very well126 9.9% Speak English less than very well
English speakers - Born in the United States 92.9% of residents of Corinth speak English at home.
3.7% of residents speak Spanish at home 278 87.1% Speak English very well41 12.9% Speak English less than very well3.4% of residents speak other language at home 287 100.0% Speak English very well
English speakers - Native, born elsewhere 48.7% of residents of Corinth speak English at home.
29.4% of residents speak Spanish at home 105 57.4% Speak English very well78 42.6% Speak English less than very well17.7% of residents speak other language at home 110 100.0% Speak English very well
English speakers - Foreign-born 28.7% of residents of Corinth speak English at home.
42.6% of residents speak Spanish at home 322 43.5% Speak English very well418 56.5% Speak English less than very well27.0% of residents speak other language at home 344 73.3% Speak English very well125 26.7% Speak English less than very well
White (Caucasian) - Speak only English Native:
97.9% (14,826)Foreign-born:
87.1% (280)
White (Caucasian) - Speak another language Native:
2.8% (426)Foreign-born:
34.0% (109)
Black or African American - Speak only English Native:
99.3% (2,180)Foreign-born:
25.5% (23)
Black or African American - Speak another language Native:
1.1% (25)Foreign-born:
72.5% (66)
American Indian / Alaska Native - Speak only English Native:
87.6% (157)Foreign-born:
100.0% (76)
Asian - Speak only English Native:
32.6% (105)Foreign-born:
16.9% (68)
Asian - Speak another language Native:
65.3% (210)Foreign-born:
83.3% (335)
Other race - Speak only English Native:
44.8% (163)Foreign-born:
6.3% (34)
Other race - Speak another language Native:
55.1% (201)Foreign-born:
93.8% (496)
Two or more races - Speak only English Native:
61.4% (1,581)Foreign-born:
7.9% (36)
Two or more races - Speak another language Native:
37.9% (975)Foreign-born:
91.5% (418)
White alone - Speak only English Native:
97.0% (14,076)Foreign-born:
83.9% (327)
White alone - Speak another language Native:
2.9% (416)Foreign-born:
18.6% (73)
Hispanic or Latino - Speak only English Native:
71.0% (1,918)Foreign-born:
8.7% (72)
Hispanic or Latino - Speak another language Native:
30.3% (818)Foreign-born:
88.9% (734)
Foreign-born residents in Corinth 1,627 residents are foreign born (3.3% Latin America , 1.6% Asia , 0.9% North America , 0.9% Europe ).
This city:
6.8%Texas:
17.1%
Marital status for residents in Corinth Marital status - White (Caucasian) population 15 years and over
Males 27.1% Never married63.7% Now married0.1% Separated1.6% Widowed7.5% DivorcedFemales 16.6% Never married69.0% Now married0.8% Separated5.7% Widowed7.8% DivorcedWomen who gave birth in the past 12 months Now married:
100.0% (158)Unmarried:
0.0% (0)
Women who did not give birth in the past 12 months Now married:
61.0% (1,816)Unmarried:
39.0% (1,163)
Marital status - Black or African American population 15 years and over
Males 44.1% Never married55.9% Now married0.0% Separated0.0% Widowed0.0% DivorcedFemales 48.1% Never married37.5% Now married2.7% Separated4.1% Widowed7.7% DivorcedWomen who did not give birth in the past 12 months Now married:
32.6% (231)Unmarried:
67.4% (477)
Marital status - American Indian / Alaska Native population 15 years and over
Males 56.2% Never married43.7% Now married0.0% Separated0.0% Widowed0.0% DivorcedFemales 0.0% Never married65.0% Now married35.0% Separated0.0% Widowed0.0% DivorcedWomen who did not give birth in the past 12 months Now married:
100.0% (86)Unmarried:
0.0% (0)
Marital status - Asian population 15 years and over
Males 15.2% Never married81.0% Now married0.0% Separated3.8% Widowed0.0% DivorcedFemales 0.0% Never married100.0% Now married0.0% Separated0.0% Widowed0.0% DivorcedWomen who did not give birth in the past 12 months Now married:
100.0% (106)Unmarried:
0.0% (0)
Marital status - Other race population 15 years and over
Males 4.3% Never married65.5% Now married0.0% Separated0.0% Widowed30.2% DivorcedFemales 42.4% Never married43.1% Now married3.3% Separated2.5% Widowed8.7% DivorcedWomen who did not give birth in the past 12 months Now married:
27.8% (76)Unmarried:
72.2% (197)
Marital status - Two or more races population 15 years and over
Males 54.6% Never married45.4% Now married0.0% Separated0.0% Widowed0.0% DivorcedFemales 64.0% Never married32.9% Now married0.0% Separated1.8% Widowed1.3% DivorcedWomen who did not give birth in the past 12 months Now married:
30.2% (419)Unmarried:
69.8% (968)
Marital status - White alone, not Hispanic / Latino population 15 years and over
Males 23.3% Never married66.9% Now married0.1% Separated1.7% Widowed8.0% DivorcedFemales 15.5% Never married71.7% Now married0.6% Separated4.3% Widowed7.9% DivorcedWomen who gave birth in the past 12 months Now married:
100.0% (165)Unmarried:
0.0% (0)
Women who did not give birth in the past 12 months Now married:
64.9% (1,859)Unmarried:
35.1% (1,003)
Marital status - Hispanic or Latino population 15 years and over
Males 49.1% Never married44.9% Now married0.0% Separated0.0% Widowed6.0% DivorcedFemales 36.0% Never married47.0% Now married1.9% Separated9.7% Widowed5.4% DivorcedWomen who gave birth in the past 12 months Now married:
100.0% (9)Unmarried:
0.0% (0)
Women who did not give birth in the past 12 months Now married:
41.2% (452)Unmarried:
58.8% (644)
Ancestries in Corinth
1,488 14.5% English1,290 12.6% American1,057 10.3% German611 5.9% Irish344 3.3% Italian260 2.5% Scottish226 2.2% European187 1.8% Polish176 1.7% French100 1.0% Norwegian69 0.7% Scandinavian67 0.7% French Canadian57 0.6% Scotch-Irish45 0.4% African33 0.3% Nigerian25 0.2% Canadian25 0.2% Greek24 0.2% Czechoslovakian22 0.2% Dutch20 0.2% Welsh18 0.2% Hungarian16 0.2% Northern European15 0.1% Swedish13 0.1% Arab
Geographical mobility in Corinth Same house 1 year ago 14,463 91.6% White (Caucasian)1,753 72.8% Black or African American261 100.0% American Indian / Alaska Native612 81.0% Asian872 99.9% Other race2,710 90.5% Two or more races14,199 91.4% White alone, not Hispanic / Latino3,269 93.4% Hispanic or LatinoMoved within same county 1,011 6.4% White / Caucasian622 25.8% Black or African American86 11.3% Asian35 4.0% Other race150 5.0% Two or more races1,059 6.8% White alone, not Hispanic / Latino125 3.6% Hispanic or LatinoMoved within same state 146 0.9% White / Caucasian45 1.9% Black or African American64 2.1% Two or more races132 0.8% White alone, not Hispanic / Latino64 1.8% Hispanic or LatinoMoved from different state 204 1.3% White / Caucasian43 5.7% Asian5 0.6% Other race33 1.1% Two or more races166 1.1% White alone, not Hispanic / Latino61 1.7% Hispanic or LatinoMoved from abroad 14 0.1% White27 0.9% Two or more races22 0.1% White alone, not Hispanic / Latino20 0.6% Hispanic or Latino
Children Nativity (place of birth) in Corinth
Children under 6 years - Living with two parents Both parents native 910 100.0% NativeBoth parents foreign-born 46 100.0% NativeOne native, one foreign-born parent 220 100.0% NativeChildren under 6 years - Living with one parent Native parent 306 100.0% NativeChildren 6 to 17 years - Living with two parents Both parents native 2,501 99.9% Native2 0.1% Foreign-bornBoth parents foreign-born 219 89.8% Native25 10.2% Foreign-bornOne native, one foreign-born parent 263 100.0% NativeChildren 6 to 17 years - Living with one parent Native parent 720 100.0% Native
Grandparents responsible for own grandchildren in Corinth
Grandparents (30 to 59 years) White / Caucasian 89 100.0% Not responsible for grandchildrenBlack or African American 33 100.0% Responsible for grandchildrenWhite alone, not Hispanic / Latino 52 100.0% Not responsible for grandchildrenHispanic or Latino 39 100.0% Not responsible for grandchildrenGrandparents (60 years and over) White / Caucasian 22 31.7% Responsible for grandchildren47 68.3% Not responsible for grandchildrenWhite alone, not Hispanic / Latino 23 29.1% Responsible for grandchildren56 70.9% Not responsible for grandchildren