Races in Clifton, New Jersey (NJ) Detailed Stats
Data:
Races - White alone (%)
Races - White alone (% change since 2000)
Races - Black alone (%)
Races - Black alone (% change since 2000)
Races - American Indian alone (%)
Races - American Indian alone (% change since 2000)
Races - Asian alone (%)
Races - Asian alone (% change since 2000)
Races - Hispanic (%)
Races - Hispanic (% change since 2000)
Races - Native Hawaiian and Other Pacific Islander alone (%)
Races - Native Hawaiian and Other Pacific Islander alone (% change since 2000)
Races - Two or more races(%)
Races - Two or more races(% change since 2000)
Races - Other race alone (%)
Races - Other race alone (% change since 2000)
Racial diversity
Place of birth - Born in state of residence (%)
Place of birth - Born in state of residence (%) - White
Place of birth - Born in state of residence (%) - Black or African American
Place of birth - Born in state of residence (%) - Asian
Place of birth - Born in state of residence (%) - Hispanic or Latino
Place of birth - Born in state of residence (%) - American Indian and Alaska Native
Place of birth - Born in state of residence (%) - Multirace
Place of birth - Born in state of residence (%) - Other Race
Place of birth - Born in other state (%)
Place of birth - Born in other state (%) - White
Place of birth - Born in other state (%) - Black or African American
Place of birth - Born in other state (%) - Asian
Place of birth - Born in other state (%) - Hispanic or Latino
Place of birth - Born in other state (%) - American Indian and Alaska Native
Place of birth - Born in other state (%) - Multirace
Place of birth - Born in other state (%) - Other Race
Place of birth - Native, outside of US (%)
Place of birth - Native, outside of US (%) - White
Place of birth - Native, outside of US (%) - Black or African American
Place of birth - Native, outside of US (%) - Asian
Place of birth - Native, outside of US (%) - Hispanic or Latino
Place of birth - Native, outside of US (%) - American Indian and Alaska Native
Place of birth - Native, outside of US (%) - Multirace
Place of birth - Native, outside of US (%) - Other Race
Place of birth - Foreign born (%)
Place of birth - Foreign born (%) - White
Place of birth - Foreign born (%) - Black or African American
Place of birth - Foreign born (%) - Asian
Place of birth - Foreign born (%) - Hispanic or Latino
Place of birth - Foreign born (%) - American Indian and Alaska Native
Place of birth - Foreign born (%) - Multirace
Place of birth - Foreign born (%) - Other Race
Residents speaking English at home (%)
Residents speaking English at home - Born in the United States (%)
Residents speaking English at home - Native, born elsewhere (%)
Residents speaking English at home - Foreign born (%)
Residents speaking Spanish at home (%)
Residents speaking Spanish at home - Born in the United States (%)
Residents speaking Spanish at home - Native, born elsewhere (%)
Residents speaking Spanish at home - Foreign born (%)
Residents speaking other language at home (%)
Residents speaking other language at home - Born in the United States (%)
Residents speaking other language at home - Native, born elsewhere (%)
Residents speaking other language at home - Foreign born (%)
Marital status - Never married (%)
Marital status - Now married (%)
Marital status - Separated (%)
Marital status - Widowed (%)
Marital status - Divorced (%)
Ancestries Reported - Arab (%)
Ancestries Reported - Czech (%)
Ancestries Reported - Danish (%)
Ancestries Reported - Dutch (%)
Ancestries Reported - English (%)
Ancestries Reported - French (%)
Ancestries Reported - French Canadian (%)
Ancestries Reported - German (%)
Ancestries Reported - Greek (%)
Ancestries Reported - Hungarian (%)
Ancestries Reported - Irish (%)
Ancestries Reported - Italian (%)
Ancestries Reported - Lithuanian (%)
Ancestries Reported - Norwegian (%)
Ancestries Reported - Polish (%)
Ancestries Reported - Portuguese (%)
Ancestries Reported - Russian (%)
Ancestries Reported - Scotch-Irish (%)
Ancestries Reported - Scottish (%)
Ancestries Reported - Slovak (%)
Ancestries Reported - Subsaharan African (%)
Ancestries Reported - Swedish (%)
Ancestries Reported - Swiss (%)
Ancestries Reported - Ukrainian (%)
Ancestries Reported - United States (%)
Ancestries Reported - Welsh (%)
Ancestries Reported - West Indian (%)
Ancestries Reported - Other (%)
Geographical mobility - Same house 1 year ago (%)
Geographical mobility - Same house 1 year ago (%) - White
Geographical mobility - Same house 1 year ago (%) - Black or African American
Geographical mobility - Same house 1 year ago (%) - Asian
Geographical mobility - Same house 1 year ago (%) - Hispanic or Latino
Geographical mobility - Same house 1 year ago (%) - American Indian and Alaska Native
Geographical mobility - Same house 1 year ago (%) - Multirace
Geographical mobility - Same house 1 year ago (%) - Other Race
Geographical mobility - Moved within same county (%)
Geographical mobility - Moved within same county (%) - White
Geographical mobility - Moved within same county (%) - Black or African American
Geographical mobility - Moved within same county (%) - Asian
Geographical mobility - Moved within same county (%) - Hispanic or Latino
Geographical mobility - Moved within same county (%) - American Indian and Alaska Native
Geographical mobility - Moved within same county (%) - Multirace
Geographical mobility - Moved within same county (%) - Other Race
Geographical mobility - Moved from different county within same state (%)
Geographical mobility - Moved from different county within same state (%) - White
Geographical mobility - Moved from different county within same state (%) - Black or African American
Geographical mobility - Moved from different county within same state (%) - Asian
Geographical mobility - Moved from different county within same state (%) - Hispanic or Latino
Geographical mobility - Moved from different county within same state (%) - American Indian and Alaska Native
Geographical mobility - Moved from different county within same state (%) - Multirace
Geographical mobility - Moved from different county within same state (%) - Other Race
Geographical mobility - Moved from different state (%)
Geographical mobility - Moved from different state (%) - White
Geographical mobility - Moved from different state (%) - Black or African American
Geographical mobility - Moved from different state (%) - Asian
Geographical mobility - Moved from different state (%) - Hispanic or Latino
Geographical mobility - Moved from different state (%) - American Indian and Alaska Native
Geographical mobility - Moved from different state (%) - Multirace
Geographical mobility - Moved from different state (%) - Other Race
Geographical mobility - Moved from abroad (%)
Geographical mobility - Moved from abroad (%) - White
Geographical mobility - Moved from abroad (%) - Black or African American
Geographical mobility - Moved from abroad (%) - Asian
Geographical mobility - Moved from abroad (%) - Hispanic or Latino
Geographical mobility - Moved from abroad (%) - American Indian and Alaska Native
Geographical mobility - Moved from abroad (%) - Multirace
Geographical mobility - Moved from abroad (%) - Other Race
Place of birth for the foreign-born population - Ireland (%)
Place of birth for the foreign-born population - Denmark (%)
Place of birth for the foreign-born population - Norway (%)
Place of birth for the foreign-born population - Sweden (%)
Place of birth for the foreign-born population - United Kingdom (%)
Place of birth for the foreign-born population - England (%)
Place of birth for the foreign-born population - Scotland (%)
Place of birth for the foreign-born population - Other Northern Europe (%)
Place of birth for the foreign-born population - Austria (%)
Place of birth for the foreign-born population - Belgium (%)
Place of birth for the foreign-born population - France (%)
Place of birth for the foreign-born population - Germany (%)
Place of birth for the foreign-born population - Netherlands (%)
Place of birth for the foreign-born population - Switzerland (%)
Place of birth for the foreign-born population - Other Western Europe (%)
Place of birth for the foreign-born population - Greece (%)
Place of birth for the foreign-born population - Italy (%)
Place of birth for the foreign-born population - Portugal (%)
Place of birth for the foreign-born population - Spain (%)
Place of birth for the foreign-born population - Other Southern Europe (%)
Place of birth for the foreign-born population - Albania (%)
Place of birth for the foreign-born population - Belarus (%)
Place of birth for the foreign-born population - Bosnia and Herzegovina (%)
Place of birth for the foreign-born population - Bulgaria (%)
Place of birth for the foreign-born population - Croatia (%)
Place of birth for the foreign-born population - Czechoslovakia (%)
Place of birth for the foreign-born population - Hungary (%)
Place of birth for the foreign-born population - Latvia (%)
Place of birth for the foreign-born population - Lithuania (%)
Place of birth for the foreign-born population - North Macedonia (Macedonia) (%)
Place of birth for the foreign-born population - Moldova (%)
Place of birth for the foreign-born population - Poland (%)
Place of birth for the foreign-born population - Romania (%)
Place of birth for the foreign-born population - Russia (%)
Place of birth for the foreign-born population - Serbia (%)
Place of birth for the foreign-born population - Ukraine (%)
Place of birth for the foreign-born population - Other Eastern Europe (%)
Place of birth for the foreign-born population - China (%)
Place of birth for the foreign-born population - Hong Kong (%)
Place of birth for the foreign-born population - Taiwan (%)
Place of birth for the foreign-born population - Japan (%)
Place of birth for the foreign-born population - Korea (%)
Place of birth for the foreign-born population - Other Eastern Asia (%)
Place of birth for the foreign-born population - Afghanistan (%)
Place of birth for the foreign-born population - Bangladesh (%)
Place of birth for the foreign-born population - India (%)
Place of birth for the foreign-born population - Iran (%)
Place of birth for the foreign-born population - Kazakhstan (%)
Place of birth for the foreign-born population - Nepal (%)
Place of birth for the foreign-born population - Pakistan (%)
Place of birth for the foreign-born population - Sri Lanka (%)
Place of birth for the foreign-born population - Uzbekistan (%)
Place of birth for the foreign-born population - Other South Central Asia (%)
Place of birth for the foreign-born population - Burma (%)
Place of birth for the foreign-born population - Cambodia (%)
Place of birth for the foreign-born population - Indonesia (%)
Place of birth for the foreign-born population - Laos (%)
Place of birth for the foreign-born population - Malaysia (%)
Place of birth for the foreign-born population - Philippines (%)
Place of birth for the foreign-born population - Singapore (%)
Place of birth for the foreign-born population - Thailand (%)
Place of birth for the foreign-born population - Vietnam (%)
Place of birth for the foreign-born population - Other South Eastern Asia (%)
Place of birth for the foreign-born population - Armenia (%)
Place of birth for the foreign-born population - Iraq (%)
Place of birth for the foreign-born population - Israel (%)
Place of birth for the foreign-born population - Jordan (%)
Place of birth for the foreign-born population - Kuwait (%)
Place of birth for the foreign-born population - Lebanon (%)
Place of birth for the foreign-born population - Saudi Arabia (%)
Place of birth for the foreign-born population - Syria (%)
Place of birth for the foreign-born population - Turkey (%)
Place of birth for the foreign-born population - Yemen (%)
Place of birth for the foreign-born population - Other Western Asia (%)
Place of birth for the foreign-born population - Eritrea (%)
Place of birth for the foreign-born population - Ethiopia (%)
Place of birth for the foreign-born population - Kenya (%)
Place of birth for the foreign-born population - Somalia (%)
Place of birth for the foreign-born population - Uganda (%)
Place of birth for the foreign-born population - Zimbabwe (%)
Place of birth for the foreign-born population - Other Eastern Africa (%)
Place of birth for the foreign-born population - Cameroon (%)
Place of birth for the foreign-born population - Congo (%)
Place of birth for the foreign-born population - Democratic Republic of Congo (Zaire) (%)
Place of birth for the foreign-born population - Other Middle Africa (%)
Place of birth for the foreign-born population - Egypt (%)
Place of birth for the foreign-born population - Morocco (%)
Place of birth for the foreign-born population - Sudan (%)
Place of birth for the foreign-born population - Other Northern Africa (%)
Place of birth for the foreign-born population - South Africa (%)
Place of birth for the foreign-born population - Other Southern Africa (%)
Place of birth for the foreign-born population - Cabo Verde (%)
Place of birth for the foreign-born population - Ghana (%)
Place of birth for the foreign-born population - Liberia (%)
Place of birth for the foreign-born population - Nigeria (%)
Place of birth for the foreign-born population - Senegal (%)
Place of birth for the foreign-born population - Sierra Leone (%)
Place of birth for the foreign-born population - Other Western Africa (%)
Place of birth for the foreign-born population - Australia (%)
Place of birth for the foreign-born population - New Zealand (%)
Place of birth for the foreign-born population - Fiji (%)
Place of birth for the foreign-born population - Micronesia (%)
Place of birth for the foreign-born population - Bahamas (%)
Place of birth for the foreign-born population - Barbados (%)
Place of birth for the foreign-born population - Cuba (%)
Place of birth for the foreign-born population - Dominica (%)
Place of birth for the foreign-born population - Dominican Republic (%)
Place of birth for the foreign-born population - Grenada (%)
Place of birth for the foreign-born population - Haiti (%)
Place of birth for the foreign-born population - Jamaica (%)
Place of birth for the foreign-born population - St. Vincent and the Grenadines (%)
Place of birth for the foreign-born population - Trinidad and Tobago (%)
Place of birth for the foreign-born population - West Indies (%)
Place of birth for the foreign-born population - Other Caribbean (%)
Place of birth for the foreign-born population - Belize (%)
Place of birth for the foreign-born population - Costa Rica (%)
Place of birth for the foreign-born population - El Salvador (%)
Place of birth for the foreign-born population - Guatemala (%)
Place of birth for the foreign-born population - Honduras (%)
Place of birth for the foreign-born population - Mexico (%)
Place of birth for the foreign-born population - Nicaragua (%)
Place of birth for the foreign-born population - Panama (%)
Place of birth for the foreign-born population - Other Central America (%)
Place of birth for the foreign-born population - Argentina (%)
Place of birth for the foreign-born population - Bolivia (%)
Place of birth for the foreign-born population - Brazil (%)
Place of birth for the foreign-born population - Chile (%)
Place of birth for the foreign-born population - Colombia (%)
Place of birth for the foreign-born population - Ecuador (%)
Place of birth for the foreign-born population - Guyana (%)
Place of birth for the foreign-born population - Peru (%)
Place of birth for the foreign-born population - Uruguay (%)
Place of birth for the foreign-born population - Venezuela (%)
Place of birth for the foreign-born population - Other South America (%)
Place of birth for the foreign-born population - Canada (%)
Place of birth for the foreign-born population - Other Northern America (%)
Place of birth for the foreign-born population - Other (%)
Latest news about races in Clifton, NJ collected exclusively by city-data.com from local newspapers, TV, and radio stations
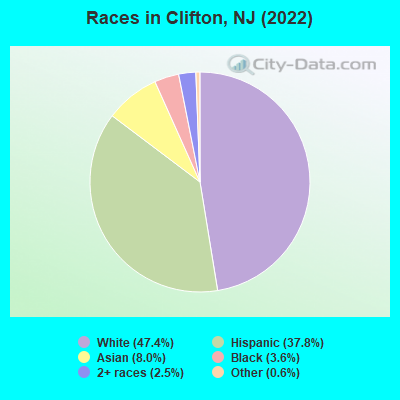
According to 2022 data, the most numerous races in Clifton, NJ are White alone (42,097 residents), Hispanic (33,537 residents), and Black alone (3,213 residents). 43.9% of Clifton residents speak English at home. 37.4% of Clifton, NJ residents are foreign-born (18.8% born in Latin America, 9.6% born in Asia, 6.5% born in Europe), which is 38.5% greater than the foreign-born rate of 23.0% across the entire state of New Jersey.
Race distribution in Clifton
2000 2022
53,206 67.6% White alone 15,608 19.8% Hispanic 5,028 6.4% Asian alone 2,529 3.2% Two or more races 2,002 2.5% Black alone 226 0.3% Other race alone 64 0.08% American Indian alone 9 0.01% Native Hawaiian and Other
42,097 47.4% White alone 33,537 37.8% Hispanic 7,127 8.0% Asian alone 3,213 3.6% Black alone 2,217 2.5% Two or more races 531 0.6% Other race alone
2000 2022
5,557,209 66.0% White alone 1,117,191 13.3% Hispanic 1,096,171 13.0% Black alone 477,012 5.7% Asian alone 133,689 1.6% Two or more races 19,565 0.2% Other race alone 11,338 0.1% American Indian alone 2,175 0.03% Native Hawaiian and Other
4,766,476 51.5% White alone 2,028,470 21.9% Hispanic 1,111,632 12.0% Black alone 923,546 10.0% Asian alone 332,237 3.6% Two or more races 89,847 1.0% Other race alone 8,557 0.09% American Indian alone 934 0.01% Native Hawaiian and Other
Income and house value in Clifton Median household income in 2022 $100,978 White non-Hispanic householders$77,338 Black householders$143,602 Asian householders$86,228 Some other race householders$59,177 Two or more races householders$77,919 Hispanic or Latino race householdersMedian 2022 house value $440,529 White Non-Hispanic householders$398,574 Black or African American householders$277,290 American Indian or Alaska Native householders $449,210 Asian householders$389,653 Some other race householders$446,316 Two or more races householders$405,567 Hispanic or Latino householders
Median age by race in Clifton
42.5 Median age for White residents41.4 47.2 28.7 Median age for Black or African American residents28.6 35.3 -666,666,666.0 Median age for American Indian / Alaska Native residents-666,666,666.0 -666,666,666.0 42.2 Median age for Asian residents36.9 48.0 -666,666,666.0 Median age for Native Hawaiian / Pacific Islander residents-666,666,666.0 -666,666,666.0 33.7 Median age for Other race residents33.5 33.9 41.4 Median age for Two or more races residents44.7 34.8 45.0 Median age for White alone residents41.4 47.7 34.7 Median age for Hispanic or Latino residents35.6 33.6
Owner/renter occupied households by race in Clifton
House owners and renters - White residents 14,276 75.1% Owner occupied4,724 24.9% Renter occupiedHouse owners and renters - Black or African American residents 689 45.0% Owner occupied841 55.0% Renter occupiedHouse owners and renters - American Indian / Alaska Native residents 17 60.8% Owner occupied11 39.2% Renter occupiedHouse owners and renters - Asian residents 1,864 62.6% Owner occupied1,114 37.4% Renter occupiedHouse owners and renters - Other race residents 1,811 41.9% Owner occupied2,511 58.1% Renter occupiedHouse owners and renters - Two or more races residents 3,423 50.9% Owner occupied3,302 49.1% Renter occupiedHouse owners and renters - White alone residents 13,511 74.5% Owner occupied4,613 25.5% Renter occupiedHouse owners and renters - Hispanic or Latino residents 5,703 49.0% Owner occupied5,928 51.0% Renter occupied
Language usage in Clifton
English speakers - Total 43.9% of residents of Clifton speak English at home.
33.1% of residents speak Spanish at home 15,862 57.0% Speak English very well11,961 43.0% Speak English less than very well23.0% of residents speak other language at home 13,769 71.2% Speak English very well5,558 28.8% Speak English less than very well
English speakers - Born in the United States 76.4% of residents of Clifton speak English at home.
17.6% of residents speak Spanish at home 1,622 75.3% Speak English very well533 24.7% Speak English less than very well6.0% of residents speak other language at home 603 82.6% Speak English very well127 17.4% Speak English less than very well
English speakers - Native, born elsewhere 16.2% of residents of Clifton speak English at home.
78.1% of residents speak Spanish at home 1,252 39.6% Speak English very well1,912 60.4% Speak English less than very well5.7% of residents speak other language at home 134 58.5% Speak English very well95 41.5% Speak English less than very well
English speakers - Foreign-born 9.7% of residents of Clifton speak English at home.
46.1% of residents speak Spanish at home 4,721 34.9% Speak English very well8,816 65.1% Speak English less than very well44.1% of residents speak other language at home 7,968 61.5% Speak English very well4,984 38.5% Speak English less than very well
White (Caucasian) - Speak only English Native:
78.1% (25,270)Foreign-born:
10.9% (1,089)
White (Caucasian) - Speak another language Native:
21.9% (7,105)Foreign-born:
89.1% (8,943)
Black or African American - Speak only English Native:
91.0% (2,908)Foreign-born:
45.1% (191)
Black or African American - Speak another language Native:
6.3% (200)Foreign-born:
59.3% (252)
American Indian / Alaska Native - Speak another language Native:
100.0% (118)Foreign-born:
97.6% (49)
Asian - Speak only English Native:
56.7% (1,090)Foreign-born:
6.4% (312)
Asian - Speak another language Native:
43.3% (834)Foreign-born:
93.6% (4,536)
Other race - Speak only English Native:
17.9% (1,492)Foreign-born:
8.0% (493)
Other race - Speak another language Native:
82.1% (6,855)Foreign-born:
92.0% (5,670)
Two or more races - Speak only English Native:
35.5% (2,957)Foreign-born:
11.0% (807)
Two or more races - Speak another language Native:
64.5% (5,383)Foreign-born:
89.0% (6,549)
White alone - Speak only English Native:
79.6% (24,806)Foreign-born:
11.1% (1,001)
White alone - Speak another language Native:
20.4% (6,353)Foreign-born:
88.9% (8,011)
Hispanic or Latino - Speak only English Native:
24.9% (4,292)Foreign-born:
6.7% (945)
Hispanic or Latino - Speak another language Native:
75.1% (12,942)Foreign-born:
93.3% (13,165)
Foreign-born residents in Clifton 33,044 residents are foreign born (18.8% Latin America , 9.6% Asia , 6.5% Europe ).
This city:
37.4%New Jersey:
23.2%
Marital status for residents in Clifton Marital status - White (Caucasian) population 15 years and over
Males 33.6% Never married54.5% Now married1.6% Separated2.1% Widowed8.1% DivorcedFemales 29.3% Never married44.5% Now married0.6% Separated14.2% Widowed11.5% DivorcedWomen who gave birth in the past 12 months Now married:
100.0% (894)Unmarried:
0.0% (0)
Women who did not give birth in the past 12 months Now married:
34.3% (2,656)Unmarried:
65.7% (5,087)
Marital status - Black or African American population 15 years and over
Males 54.2% Never married33.8% Now married4.0% Separated3.2% Widowed4.7% DivorcedFemales 55.5% Never married24.7% Now married2.7% Separated7.9% Widowed9.2% DivorcedWomen who gave birth in the past 12 months Now married:
56.8% (44)Unmarried:
43.2% (33)
Women who did not give birth in the past 12 months Now married:
18.0% (145)Unmarried:
82.0% (664)
Marital status - American Indian / Alaska Native population 15 years and over
Males 67.2% Never married16.4% Now married0.0% Separated0.0% Widowed16.4% DivorcedFemales 22.9% Never married72.9% Now married4.2% Separated0.0% Widowed0.0% DivorcedWomen who gave birth in the past 12 months Now married:
100.0% (3)Unmarried:
0.0% (0)
Women who did not give birth in the past 12 months Now married:
50.0% (17)Unmarried:
50.0% (17)
Marital status - Asian population 15 years and over
Males 23.9% Never married67.7% Now married1.5% Separated5.1% Widowed1.8% DivorcedFemales 30.3% Never married55.9% Now married1.1% Separated7.6% Widowed5.1% DivorcedWomen who gave birth in the past 12 months Now married:
100.0% (104)Unmarried:
0.0% (0)
Women who did not give birth in the past 12 months Now married:
47.8% (785)Unmarried:
52.2% (856)
Marital status - Other race population 15 years and over
Males 54.9% Never married35.2% Now married6.3% Separated1.5% Widowed2.1% DivorcedFemales 32.0% Never married32.5% Now married15.5% Separated4.2% Widowed15.9% DivorcedWomen who gave birth in the past 12 months Now married:
66.4% (424)Unmarried:
33.6% (215)
Women who did not give birth in the past 12 months Now married:
52.0% (1,821)Unmarried:
48.0% (1,680)
Marital status - Two or more races population 15 years and over
Males 38.0% Never married51.0% Now married3.1% Separated0.0% Widowed7.8% DivorcedFemales 37.5% Never married47.5% Now married0.0% Separated6.6% Widowed8.5% DivorcedWomen who gave birth in the past 12 months Now married:
56.1% (421)Unmarried:
43.9% (330)
Women who did not give birth in the past 12 months Now married:
31.9% (1,050)Unmarried:
68.1% (2,237)
Marital status - White alone, not Hispanic / Latino population 15 years and over
Males 34.8% Never married53.6% Now married1.7% Separated2.2% Widowed7.6% DivorcedFemales 26.6% Never married46.8% Now married0.3% Separated14.7% Widowed11.5% DivorcedWomen who gave birth in the past 12 months Now married:
100.0% (894)Unmarried:
0.0% (0)
Women who did not give birth in the past 12 months Now married:
38.2% (2,656)Unmarried:
61.8% (4,288)
Marital status - Hispanic or Latino population 15 years and over
Males 44.2% Never married44.8% Now married4.6% Separated0.7% Widowed5.7% DivorcedFemales 35.4% Never married40.7% Now married7.1% Separated4.7% Widowed12.1% DivorcedWomen who gave birth in the past 12 months Now married:
67.5% (1,107)Unmarried:
32.5% (532)
Women who did not give birth in the past 12 months Now married:
38.9% (2,715)Unmarried:
61.1% (4,260)
Ancestries in Clifton
4,737 8.1% Italian4,551 7.8% Polish1,741 3.0% American1,325 2.3% Turkish910 1.6% Palestinian906 1.6% Irish785 1.4% Ukrainian685 1.2% Egyptian677 1.2% Moroccan644 1.1% German575 1.0% European532 0.9% Eastern European488 0.8% Albanian406 0.7% Syrian403 0.7% Jordanian388 0.7% Brazilian376 0.6% Lebanese280 0.5% English239 0.4% Hungarian236 0.4% Russian229 0.4% Yugoslavian222 0.4% Arab210 0.4% Portuguese202 0.3% Greek184 0.3% Iraqi181 0.3% Jamaican166 0.3% Slovak142 0.2% Romanian139 0.2% Trinidadian and Tobagonian115 0.2% Israeli113 0.2% French100 0.2% Iranian97 0.2% Finnish91 0.2% Serbian91 0.2% African86 0.1% Nigerian85 0.1% Slavic81 0.1% Austrian72 0.1% Dutch57 0.10% Haitian54 0.09% Macedonian52 0.09% Scottish52 0.09% Lithuanian38 0.07% British33 0.06% Czech33 0.06% Swedish28 0.05% Armenian26 0.04% Sudanese23 0.04% Afghan19 0.03% Norwegian17 0.03% Scotch-Irish16 0.03% Czechoslovakian16 0.03% Guyanese15 0.03% South African14 0.02% Latvian9 0.02% French Canadian7 0.01% Danish6 0.01% West Indian
Geographical mobility in Clifton Same house 1 year ago 41,945 94.8% White (Caucasian)2,751 75.8% Black or African American199 96.6% American Indian / Alaska Native7,097 88.8% Asian16 100.0% Native Hawaiian / Pacific Islander13,052 86.0% Other race15,845 87.1% Two or more races40,179 96.3% White alone, not Hispanic / Latino25,880 79.5% Hispanic or LatinoMoved within same county 530 1.2% White / Caucasian281 7.7% Black or African American341 4.3% Asian1,475 9.7% Other race595 3.3% Two or more races530 1.3% White alone, not Hispanic / Latino2,985 9.2% Hispanic or LatinoMoved within same state 1,559 3.5% White / Caucasian399 11.0% Black or African American226 2.8% Asian178 1.2% Other race1,251 6.9% Two or more races786 1.9% White alone, not Hispanic / Latino2,553 7.8% Hispanic or LatinoMoved from different state 229 0.5% White / Caucasian182 5.0% Black or African American92 1.2% Asian369 2.4% Other race385 2.1% Two or more races229 0.5% White alone, not Hispanic / Latino764 2.3% Hispanic or LatinoMoved from abroad 59 1.6% Black or African American113 1.4% Asian110 0.7% Other race54 0.3% Two or more races372 1.1% Hispanic or Latino
Children Nativity (place of birth) in Clifton
Children under 6 years - Living with two parents Both parents native 2,728 100.0% NativeBoth parents foreign-born 1,002 100.0% NativeOne native, one foreign-born parent 700 100.0% NativeChildren under 6 years - Living with one parent Native parent 1,067 100.0% NativeForeign-born parent 655 100.0% NativeChildren 6 to 17 years - Living with two parents Both parents native 3,630 100.0% NativeBoth parents foreign-born 2,264 85.9% Native372 14.1% Foreign-bornOne native, one foreign-born parent 1,334 100.0% NativeChildren 6 to 17 years - Living with one parent Native parent 1,330 100.0% NativeForeign-born parent 1,832 55.6% Native1,462 44.4% Foreign-born
Place of birth for residents in Clifton 17,103 Americas17,071 Latin America8,714 Asia7,524 South America5,972 Caribbean5,944 Europe4,786 Eastern Europe3,574 Central America3,050 South Central Asia2,609 Western Asia1,758 South Eastern Asia1,263 Africa1,108 Eastern Asia1,070 Northern Africa662 Southern Europe263 Western Europe257 China231 Northern Europe96 Eastern Africa51 Middle Africa32 Northern America18 Oceania18 Australia and New Zealand Subregion13 Southern Africa13 Western Africa4,652 Dominican Republic3,131 Poland2,879 Peru2,868 Mexico2,504 Colombia2,235 India1,531 Philippines894 Turkey842 Cuba833 Korea787 Ecuador539 Egypt512 Brazil462 Syria441 Morocco408 Jordan381 Albania364 Ukraine276 Chile271 Argentina266 Spain258 Iraq252 Italy251 Uzbekistan236 Israel236 El Salvador236 Lebanon217 Bangladesh204 Guatemala185 Bosnia and Herzegovina176 Pakistan160 Dominica154 Jamaica135 United Kingdom135 China134 Indonesia128 Guyana122 Costa Rica119 Germany114 Serbia109 Trinidad and Tobago102 Russia101 Venezuela97 Honduras93 North Macedonia (Macedonia)91 Moldova90 Romania84 Greece80 Hong Kong78 Iran73 Czechoslovakia72 Sudan68 Netherlands54 Kenya47 Ireland47 Vietnam47 Sri Lanka44 Austria42 Portugal41 Taiwan38 Saudi Arabia36 United Arab Emirates32 Canada28 Panama28 Yemen24 Afghanistan23 Uruguay23 Haiti23 Burma (Myanmar)22 Hungary22 Croatia22 Bolivia20 Belgium19 St. Vincent and the Grenadines18 Australia17 Algeria17 Nicaragua17 Japan16 Latvia14 Lithuania13 Senegal13 South Africa12 Belarus12 Denmark10 France10 Malaysia9 Bahamas8 Georgia7 Thailand5 Cambodia5 England1 Tanzania
Grandparents responsible for own grandchildren in Clifton
Grandparents (30 to 59 years) White / Caucasian 32 10.2% Responsible for grandchildren284 89.8% Not responsible for grandchildrenBlack or African American 8 15.5% Responsible for grandchildren44 84.5% Not responsible for grandchildrenAmerican Indian / Alaska Native 24 100.0% Not responsible for grandchildrenAsian 4 100.0% Not responsible for grandchildrenOther race 155 55.1% Responsible for grandchildren126 44.9% Not responsible for grandchildrenTwo or more races 133 40.6% Responsible for grandchildren194 59.4% Not responsible for grandchildrenWhite alone, not Hispanic / Latino 6 2.8% Responsible for grandchildren211 97.2% Not responsible for grandchildrenHispanic or Latino 449 53.0% Responsible for grandchildren398 47.0% Not responsible for grandchildrenGrandparents (60 years and over) White / Caucasian 37 7.8% Responsible for grandchildren443 92.2% Not responsible for grandchildrenBlack or African American 61 100.0% Not responsible for grandchildrenAsian 280 100.0% Not responsible for grandchildrenOther race 32 11.3% Responsible for grandchildren254 88.7% Not responsible for grandchildrenTwo or more races 139 100.0% Not responsible for grandchildrenWhite alone, not Hispanic / Latino 43 10.9% Responsible for grandchildren350 89.1% Not responsible for grandchildrenHispanic or Latino 33 4.8% Responsible for grandchildren645 95.2% Not responsible for grandchildren