Races in Cleveland, Texas (TX) Detailed Stats
Data:
Races - White alone (%)
Races - White alone (% change since 2000)
Races - Black alone (%)
Races - Black alone (% change since 2000)
Races - American Indian alone (%)
Races - American Indian alone (% change since 2000)
Races - Asian alone (%)
Races - Asian alone (% change since 2000)
Races - Hispanic (%)
Races - Hispanic (% change since 2000)
Races - Native Hawaiian and Other Pacific Islander alone (%)
Races - Native Hawaiian and Other Pacific Islander alone (% change since 2000)
Races - Two or more races(%)
Races - Two or more races(% change since 2000)
Races - Other race alone (%)
Races - Other race alone (% change since 2000)
Racial diversity
Place of birth - Born in state of residence (%)
Place of birth - Born in state of residence (%) - White
Place of birth - Born in state of residence (%) - Black or African American
Place of birth - Born in state of residence (%) - Asian
Place of birth - Born in state of residence (%) - Hispanic or Latino
Place of birth - Born in state of residence (%) - American Indian and Alaska Native
Place of birth - Born in state of residence (%) - Multirace
Place of birth - Born in state of residence (%) - Other Race
Place of birth - Born in other state (%)
Place of birth - Born in other state (%) - White
Place of birth - Born in other state (%) - Black or African American
Place of birth - Born in other state (%) - Asian
Place of birth - Born in other state (%) - Hispanic or Latino
Place of birth - Born in other state (%) - American Indian and Alaska Native
Place of birth - Born in other state (%) - Multirace
Place of birth - Born in other state (%) - Other Race
Place of birth - Native, outside of US (%)
Place of birth - Native, outside of US (%) - White
Place of birth - Native, outside of US (%) - Black or African American
Place of birth - Native, outside of US (%) - Asian
Place of birth - Native, outside of US (%) - Hispanic or Latino
Place of birth - Native, outside of US (%) - American Indian and Alaska Native
Place of birth - Native, outside of US (%) - Multirace
Place of birth - Native, outside of US (%) - Other Race
Place of birth - Foreign born (%)
Place of birth - Foreign born (%) - White
Place of birth - Foreign born (%) - Black or African American
Place of birth - Foreign born (%) - Asian
Place of birth - Foreign born (%) - Hispanic or Latino
Place of birth - Foreign born (%) - American Indian and Alaska Native
Place of birth - Foreign born (%) - Multirace
Place of birth - Foreign born (%) - Other Race
Residents speaking English at home (%)
Residents speaking English at home - Born in the United States (%)
Residents speaking English at home - Native, born elsewhere (%)
Residents speaking English at home - Foreign born (%)
Residents speaking Spanish at home (%)
Residents speaking Spanish at home - Born in the United States (%)
Residents speaking Spanish at home - Native, born elsewhere (%)
Residents speaking Spanish at home - Foreign born (%)
Residents speaking other language at home (%)
Residents speaking other language at home - Born in the United States (%)
Residents speaking other language at home - Native, born elsewhere (%)
Residents speaking other language at home - Foreign born (%)
Marital status - Never married (%)
Marital status - Now married (%)
Marital status - Separated (%)
Marital status - Widowed (%)
Marital status - Divorced (%)
Ancestries Reported - Arab (%)
Ancestries Reported - Czech (%)
Ancestries Reported - Danish (%)
Ancestries Reported - Dutch (%)
Ancestries Reported - English (%)
Ancestries Reported - French (%)
Ancestries Reported - French Canadian (%)
Ancestries Reported - German (%)
Ancestries Reported - Greek (%)
Ancestries Reported - Hungarian (%)
Ancestries Reported - Irish (%)
Ancestries Reported - Italian (%)
Ancestries Reported - Lithuanian (%)
Ancestries Reported - Norwegian (%)
Ancestries Reported - Polish (%)
Ancestries Reported - Portuguese (%)
Ancestries Reported - Russian (%)
Ancestries Reported - Scotch-Irish (%)
Ancestries Reported - Scottish (%)
Ancestries Reported - Slovak (%)
Ancestries Reported - Subsaharan African (%)
Ancestries Reported - Swedish (%)
Ancestries Reported - Swiss (%)
Ancestries Reported - Ukrainian (%)
Ancestries Reported - United States (%)
Ancestries Reported - Welsh (%)
Ancestries Reported - West Indian (%)
Ancestries Reported - Other (%)
Geographical mobility - Same house 1 year ago (%)
Geographical mobility - Same house 1 year ago (%) - White
Geographical mobility - Same house 1 year ago (%) - Black or African American
Geographical mobility - Same house 1 year ago (%) - Asian
Geographical mobility - Same house 1 year ago (%) - Hispanic or Latino
Geographical mobility - Same house 1 year ago (%) - American Indian and Alaska Native
Geographical mobility - Same house 1 year ago (%) - Multirace
Geographical mobility - Same house 1 year ago (%) - Other Race
Geographical mobility - Moved within same county (%)
Geographical mobility - Moved within same county (%) - White
Geographical mobility - Moved within same county (%) - Black or African American
Geographical mobility - Moved within same county (%) - Asian
Geographical mobility - Moved within same county (%) - Hispanic or Latino
Geographical mobility - Moved within same county (%) - American Indian and Alaska Native
Geographical mobility - Moved within same county (%) - Multirace
Geographical mobility - Moved within same county (%) - Other Race
Geographical mobility - Moved from different county within same state (%)
Geographical mobility - Moved from different county within same state (%) - White
Geographical mobility - Moved from different county within same state (%) - Black or African American
Geographical mobility - Moved from different county within same state (%) - Asian
Geographical mobility - Moved from different county within same state (%) - Hispanic or Latino
Geographical mobility - Moved from different county within same state (%) - American Indian and Alaska Native
Geographical mobility - Moved from different county within same state (%) - Multirace
Geographical mobility - Moved from different county within same state (%) - Other Race
Geographical mobility - Moved from different state (%)
Geographical mobility - Moved from different state (%) - White
Geographical mobility - Moved from different state (%) - Black or African American
Geographical mobility - Moved from different state (%) - Asian
Geographical mobility - Moved from different state (%) - Hispanic or Latino
Geographical mobility - Moved from different state (%) - American Indian and Alaska Native
Geographical mobility - Moved from different state (%) - Multirace
Geographical mobility - Moved from different state (%) - Other Race
Geographical mobility - Moved from abroad (%)
Geographical mobility - Moved from abroad (%) - White
Geographical mobility - Moved from abroad (%) - Black or African American
Geographical mobility - Moved from abroad (%) - Asian
Geographical mobility - Moved from abroad (%) - Hispanic or Latino
Geographical mobility - Moved from abroad (%) - American Indian and Alaska Native
Geographical mobility - Moved from abroad (%) - Multirace
Geographical mobility - Moved from abroad (%) - Other Race
Place of birth for the foreign-born population - Ireland (%)
Place of birth for the foreign-born population - Denmark (%)
Place of birth for the foreign-born population - Norway (%)
Place of birth for the foreign-born population - Sweden (%)
Place of birth for the foreign-born population - United Kingdom (%)
Place of birth for the foreign-born population - England (%)
Place of birth for the foreign-born population - Scotland (%)
Place of birth for the foreign-born population - Other Northern Europe (%)
Place of birth for the foreign-born population - Austria (%)
Place of birth for the foreign-born population - Belgium (%)
Place of birth for the foreign-born population - France (%)
Place of birth for the foreign-born population - Germany (%)
Place of birth for the foreign-born population - Netherlands (%)
Place of birth for the foreign-born population - Switzerland (%)
Place of birth for the foreign-born population - Other Western Europe (%)
Place of birth for the foreign-born population - Greece (%)
Place of birth for the foreign-born population - Italy (%)
Place of birth for the foreign-born population - Portugal (%)
Place of birth for the foreign-born population - Spain (%)
Place of birth for the foreign-born population - Other Southern Europe (%)
Place of birth for the foreign-born population - Albania (%)
Place of birth for the foreign-born population - Belarus (%)
Place of birth for the foreign-born population - Bosnia and Herzegovina (%)
Place of birth for the foreign-born population - Bulgaria (%)
Place of birth for the foreign-born population - Croatia (%)
Place of birth for the foreign-born population - Czechoslovakia (%)
Place of birth for the foreign-born population - Hungary (%)
Place of birth for the foreign-born population - Latvia (%)
Place of birth for the foreign-born population - Lithuania (%)
Place of birth for the foreign-born population - North Macedonia (Macedonia) (%)
Place of birth for the foreign-born population - Moldova (%)
Place of birth for the foreign-born population - Poland (%)
Place of birth for the foreign-born population - Romania (%)
Place of birth for the foreign-born population - Russia (%)
Place of birth for the foreign-born population - Serbia (%)
Place of birth for the foreign-born population - Ukraine (%)
Place of birth for the foreign-born population - Other Eastern Europe (%)
Place of birth for the foreign-born population - China (%)
Place of birth for the foreign-born population - Hong Kong (%)
Place of birth for the foreign-born population - Taiwan (%)
Place of birth for the foreign-born population - Japan (%)
Place of birth for the foreign-born population - Korea (%)
Place of birth for the foreign-born population - Other Eastern Asia (%)
Place of birth for the foreign-born population - Afghanistan (%)
Place of birth for the foreign-born population - Bangladesh (%)
Place of birth for the foreign-born population - India (%)
Place of birth for the foreign-born population - Iran (%)
Place of birth for the foreign-born population - Kazakhstan (%)
Place of birth for the foreign-born population - Nepal (%)
Place of birth for the foreign-born population - Pakistan (%)
Place of birth for the foreign-born population - Sri Lanka (%)
Place of birth for the foreign-born population - Uzbekistan (%)
Place of birth for the foreign-born population - Other South Central Asia (%)
Place of birth for the foreign-born population - Burma (%)
Place of birth for the foreign-born population - Cambodia (%)
Place of birth for the foreign-born population - Indonesia (%)
Place of birth for the foreign-born population - Laos (%)
Place of birth for the foreign-born population - Malaysia (%)
Place of birth for the foreign-born population - Philippines (%)
Place of birth for the foreign-born population - Singapore (%)
Place of birth for the foreign-born population - Thailand (%)
Place of birth for the foreign-born population - Vietnam (%)
Place of birth for the foreign-born population - Other South Eastern Asia (%)
Place of birth for the foreign-born population - Armenia (%)
Place of birth for the foreign-born population - Iraq (%)
Place of birth for the foreign-born population - Israel (%)
Place of birth for the foreign-born population - Jordan (%)
Place of birth for the foreign-born population - Kuwait (%)
Place of birth for the foreign-born population - Lebanon (%)
Place of birth for the foreign-born population - Saudi Arabia (%)
Place of birth for the foreign-born population - Syria (%)
Place of birth for the foreign-born population - Turkey (%)
Place of birth for the foreign-born population - Yemen (%)
Place of birth for the foreign-born population - Other Western Asia (%)
Place of birth for the foreign-born population - Eritrea (%)
Place of birth for the foreign-born population - Ethiopia (%)
Place of birth for the foreign-born population - Kenya (%)
Place of birth for the foreign-born population - Somalia (%)
Place of birth for the foreign-born population - Uganda (%)
Place of birth for the foreign-born population - Zimbabwe (%)
Place of birth for the foreign-born population - Other Eastern Africa (%)
Place of birth for the foreign-born population - Cameroon (%)
Place of birth for the foreign-born population - Congo (%)
Place of birth for the foreign-born population - Democratic Republic of Congo (Zaire) (%)
Place of birth for the foreign-born population - Other Middle Africa (%)
Place of birth for the foreign-born population - Egypt (%)
Place of birth for the foreign-born population - Morocco (%)
Place of birth for the foreign-born population - Sudan (%)
Place of birth for the foreign-born population - Other Northern Africa (%)
Place of birth for the foreign-born population - South Africa (%)
Place of birth for the foreign-born population - Other Southern Africa (%)
Place of birth for the foreign-born population - Cabo Verde (%)
Place of birth for the foreign-born population - Ghana (%)
Place of birth for the foreign-born population - Liberia (%)
Place of birth for the foreign-born population - Nigeria (%)
Place of birth for the foreign-born population - Senegal (%)
Place of birth for the foreign-born population - Sierra Leone (%)
Place of birth for the foreign-born population - Other Western Africa (%)
Place of birth for the foreign-born population - Australia (%)
Place of birth for the foreign-born population - New Zealand (%)
Place of birth for the foreign-born population - Fiji (%)
Place of birth for the foreign-born population - Micronesia (%)
Place of birth for the foreign-born population - Bahamas (%)
Place of birth for the foreign-born population - Barbados (%)
Place of birth for the foreign-born population - Cuba (%)
Place of birth for the foreign-born population - Dominica (%)
Place of birth for the foreign-born population - Dominican Republic (%)
Place of birth for the foreign-born population - Grenada (%)
Place of birth for the foreign-born population - Haiti (%)
Place of birth for the foreign-born population - Jamaica (%)
Place of birth for the foreign-born population - St. Vincent and the Grenadines (%)
Place of birth for the foreign-born population - Trinidad and Tobago (%)
Place of birth for the foreign-born population - West Indies (%)
Place of birth for the foreign-born population - Other Caribbean (%)
Place of birth for the foreign-born population - Belize (%)
Place of birth for the foreign-born population - Costa Rica (%)
Place of birth for the foreign-born population - El Salvador (%)
Place of birth for the foreign-born population - Guatemala (%)
Place of birth for the foreign-born population - Honduras (%)
Place of birth for the foreign-born population - Mexico (%)
Place of birth for the foreign-born population - Nicaragua (%)
Place of birth for the foreign-born population - Panama (%)
Place of birth for the foreign-born population - Other Central America (%)
Place of birth for the foreign-born population - Argentina (%)
Place of birth for the foreign-born population - Bolivia (%)
Place of birth for the foreign-born population - Brazil (%)
Place of birth for the foreign-born population - Chile (%)
Place of birth for the foreign-born population - Colombia (%)
Place of birth for the foreign-born population - Ecuador (%)
Place of birth for the foreign-born population - Guyana (%)
Place of birth for the foreign-born population - Peru (%)
Place of birth for the foreign-born population - Uruguay (%)
Place of birth for the foreign-born population - Venezuela (%)
Place of birth for the foreign-born population - Other South America (%)
Place of birth for the foreign-born population - Canada (%)
Place of birth for the foreign-born population - Other Northern America (%)
Place of birth for the foreign-born population - Other (%)
Latest news about races in Cleveland, TX collected exclusively by city-data.com from local newspapers, TV, and radio stations
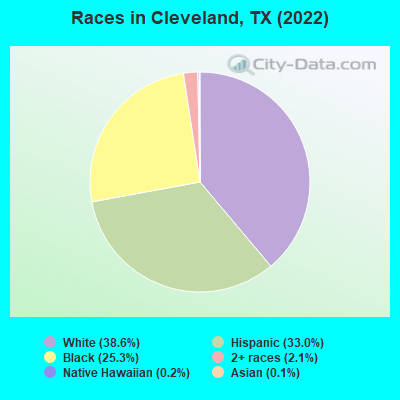
According to 2022 data, the most numerous races in Cleveland, TX are Hispanic (2,626 residents), White alone (3,076 residents), and Black alone (2,011 residents). 73.5% of Cleveland residents speak English at home. 11.3% of Cleveland, TX residents are foreign-born (11.7% born in Latin America), which is 51.0% less than the foreign-born rate of 17.0% across the entire state of Texas.
Race distribution in Cleveland
2000 2022
10,933,313 52.4% White alone 6,669,666 32.0% Hispanic 2,364,255 11.3% Black alone 554,445 2.7% Asian alone 230,567 1.1% Two or more races 68,859 0.3% American Indian alone 19,958 0.10% Other race alone 10,757 0.05% Native Hawaiian and Other
12,070,642 40.2% Hispanic 11,683,430 38.9% White alone 3,508,706 11.7% Black alone 1,608,173 5.4% Asian alone 956,560 3.2% Two or more races 125,763 0.4% Other race alone 47,023 0.2% American Indian alone 29,275 0.10% Native Hawaiian and Other
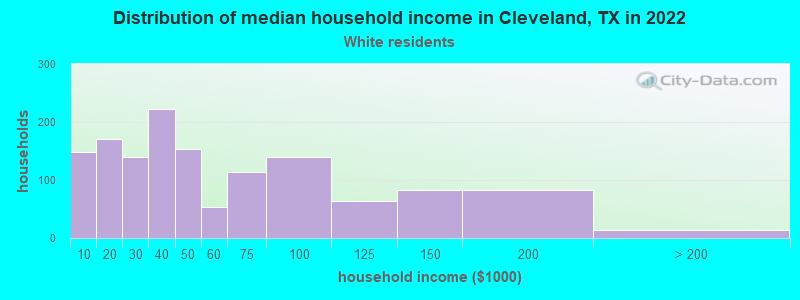
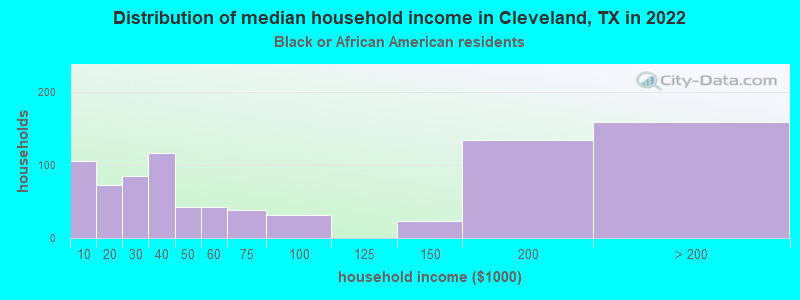
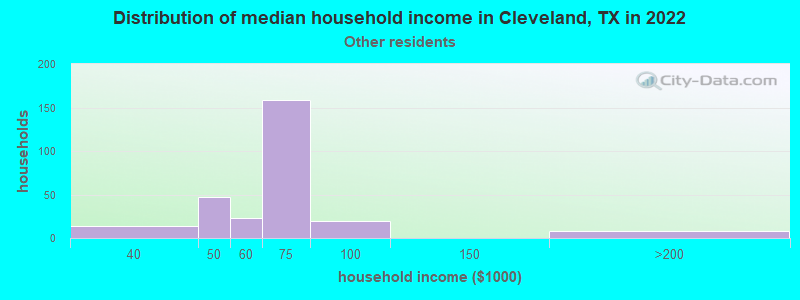
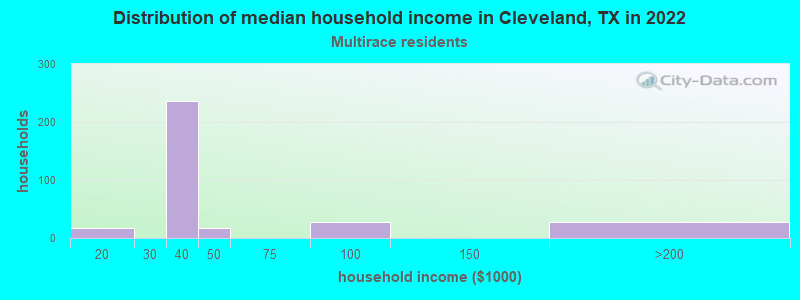
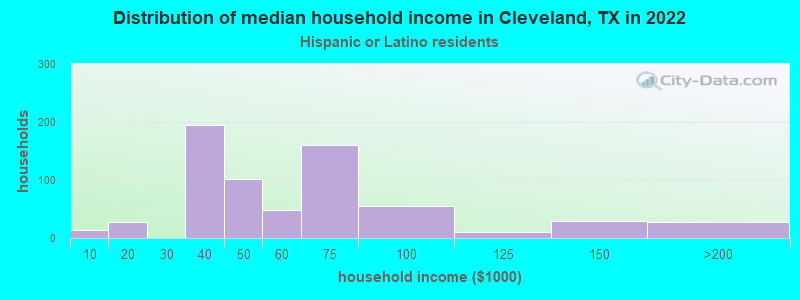
Income and house value in Cleveland Median household income in 2022 $44,724 White non-Hispanic householders$47,469 Black householders$57,195 Some other race householders$38,065 Two or more races householders$52,616 Hispanic or Latino race householdersMedian 2022 house value $167,078 White Non-Hispanic householders$109,794 Black or African American householders$185,536 Some other race householders$161,031 Hispanic or Latino householders
Median age by race in Cleveland
40.1 Median age for White residents38.3 40.5 55.2 Median age for Black or African American residents50.0 50.0 -429,687,499.6 Median age for American Indian / Alaska Native residents-682,445,758.7 -424,710,424.3 -681,278,538.1 Median age for Asian residents-683,426,442.5 -679,245,282.3 -581,560,283.1 Median age for Native Hawaiian / Pacific Islander residents-612,729,233.5 -666,666,666.0 34.7 Median age for Other race residents34.7 27.5 13.2 Median age for Two or more races residents7.8 49.7 42.5 Median age for White alone residents39.9 48.5 28.6 Median age for Hispanic or Latino residents28.3 29.9
Owner/renter occupied households by race in Cleveland
House owners and renters - White residents 742 49.6% Owner occupied755 50.4% Renter occupiedHouse owners and renters - Black or African American residents 679 69.2% Owner occupied302 30.8% Renter occupiedHouse owners and renters - Other race residents 88 32.6% Owner occupied182 67.4% Renter occupiedHouse owners and renters - Two or more races residents 134 63.5% Owner occupied77 36.5% Renter occupiedHouse owners and renters - White alone residents 558 43.1% Owner occupied737 56.9% Renter occupiedHouse owners and renters - Hispanic or Latino residents 491 58.4% Owner occupied351 41.6% Renter occupied
Language usage in Cleveland
English speakers - Total 73.5% of residents of Cleveland speak English at home.
25.3% of residents speak Spanish at home 1,107 58.0% Speak English very well802 42.0% Speak English less than very well1.1% of residents speak other language at home 80 100.0% Speak English very well
English speakers - Born in the United States 81.9% of residents of Cleveland speak English at home.
18.1% of residents speak Spanish at home 311 100.0% Speak English very well
English speakers - Native, born elsewhere 60.7% of residents of Cleveland speak English at home.
36.4% of residents speak Spanish at home 78 100.0% Speak English less than very well
English speakers - Foreign-born 1.1% of residents of Cleveland speak English at home.
91.0% of residents speak Spanish at home 242 27.9% Speak English very well624 72.1% Speak English less than very well7.1% of residents speak other language at home 68 100.0% Speak English very well
White (Caucasian) - Speak another language Native:
5.7% (178)Foreign-born:
88.3% (152)
Black or African American - Speak another language Native:
0.6% (11)Foreign-born:
100.0% (64)
Other race - Speak another language Native:
73.7% (515)Foreign-born:
88.8% (525)
Two or more races - Speak another language Native:
33.0% (200)Foreign-born:
100.0% (137)
Hispanic or Latino - Speak another language Native:
51.6% (949)Foreign-born:
89.7% (1,023)
Foreign-born residents in Cleveland 952 residents are foreign born (11.7% Latin America ).
This city:
11.3%Texas:
17.1%
Marital status for residents in Cleveland Marital status - White (Caucasian) population 15 years and over
Males 41.3% Never married44.8% Now married5.9% Separated2.4% Widowed5.7% DivorcedFemales 20.9% Never married43.4% Now married0.3% Separated11.1% Widowed24.3% DivorcedWomen who gave birth in the past 12 months Now married:
15.0% (8)Unmarried:
85.0% (47)
Women who did not give birth in the past 12 months Now married:
38.1% (253)Unmarried:
61.9% (409)
Marital status - Black or African American population 15 years and over
Males 39.6% Never married43.4% Now married6.0% Separated1.3% Widowed9.8% DivorcedFemales 19.3% Never married51.2% Now married1.1% Separated13.0% Widowed15.4% DivorcedWomen who did not give birth in the past 12 months Now married:
52.4% (196)Unmarried:
47.6% (178)
Marital status - Other race population 15 years and over
Males 34.9% Never married40.7% Now married4.4% Separated0.0% Widowed20.1% DivorcedFemales 51.7% Never married39.9% Now married8.4% Separated0.0% Widowed0.0% DivorcedWomen who did not give birth in the past 12 months Now married:
45.6% (186)Unmarried:
54.4% (222)
Marital status - Two or more races population 15 years and over
Males 10.9% Never married73.5% Now married0.0% Separated3.8% Widowed11.8% DivorcedFemales 9.4% Never married81.2% Now married9.4% Separated0.0% Widowed0.0% DivorcedWomen who gave birth in the past 12 months Now married:
100.0% (101)Unmarried:
0.0% (0)
Women who did not give birth in the past 12 months Now married:
68.4% (43)Unmarried:
31.6% (20)
Marital status - White alone, not Hispanic / Latino population 15 years and over
Males 42.3% Never married40.9% Now married7.0% Separated2.6% Widowed7.3% DivorcedFemales 18.4% Never married39.3% Now married0.4% Separated13.3% Widowed28.5% DivorcedWomen who gave birth in the past 12 months Now married:
100.0% (9)Unmarried:
0.0% (0)
Women who did not give birth in the past 12 months Now married:
33.0% (181)Unmarried:
67.0% (367)
Marital status - Hispanic or Latino population 15 years and over
Males 31.2% Never married55.5% Now married2.6% Separated1.6% Widowed9.1% DivorcedFemales 32.4% Never married56.5% Now married4.8% Separated1.6% Widowed4.7% DivorcedWomen who gave birth in the past 12 months Now married:
64.3% (116)Unmarried:
35.7% (64)
Women who did not give birth in the past 12 months Now married:
50.8% (284)Unmarried:
49.2% (276)
Ancestries in Cleveland
242 4.8% Irish219 4.4% English210 4.2% Scotch-Irish164 3.3% German121 2.4% American75 1.5% Jamaican51 1.0% Scottish31 0.6% Italian27 0.5% African17 0.3% French15 0.3% Belgian10 0.2% Haitian
Children Nativity (place of birth) in Cleveland
Children under 6 years - Living with two parents Both parents native 20 100.0% NativeBoth parents foreign-born 120 100.0% NativeOne native, one foreign-born parent 115 100.0% NativeChildren under 6 years - Living with one parent Native parent 290 100.0% NativeChildren 6 to 17 years - Living with two parents Both parents native 455 100.0% NativeBoth parents foreign-born 227 100.0% NativeOne native, one foreign-born parent 109 100.0% NativeChildren 6 to 17 years - Living with one parent Native parent 471 100.0% NativeForeign-born parent 103 54.9% Native85 45.1% Foreign-born
Grandparents responsible for own grandchildren in Cleveland
Grandparents (30 to 59 years) White / Caucasian 13 10.2% Responsible for grandchildren116 89.8% Not responsible for grandchildrenBlack or African American 18 100.0% Responsible for grandchildrenTwo or more races 26 65.6% Responsible for grandchildren14 34.4% Not responsible for grandchildrenWhite alone, not Hispanic / Latino 14 26.8% Responsible for grandchildren39 73.2% Not responsible for grandchildrenHispanic or Latino 15 20.4% Responsible for grandchildren60 79.6% Not responsible for grandchildrenGrandparents (60 years and over) White / Caucasian 22 23.8% Responsible for grandchildren71 76.2% Not responsible for grandchildrenBlack or African American 19 66.6% Responsible for grandchildren10 33.4% Not responsible for grandchildrenWhite alone, not Hispanic / Latino 46 100.0% Not responsible for grandchildrenHispanic or Latino 13 35.1% Responsible for grandchildren25 64.9% Not responsible for grandchildren