Races in Cheyenne, Wyoming (WY) Detailed Stats
Data:
Races - White alone (%)
Races - White alone (% change since 2000)
Races - Black alone (%)
Races - Black alone (% change since 2000)
Races - American Indian alone (%)
Races - American Indian alone (% change since 2000)
Races - Asian alone (%)
Races - Asian alone (% change since 2000)
Races - Hispanic (%)
Races - Hispanic (% change since 2000)
Races - Native Hawaiian and Other Pacific Islander alone (%)
Races - Native Hawaiian and Other Pacific Islander alone (% change since 2000)
Races - Two or more races(%)
Races - Two or more races(% change since 2000)
Races - Other race alone (%)
Races - Other race alone (% change since 2000)
Racial diversity
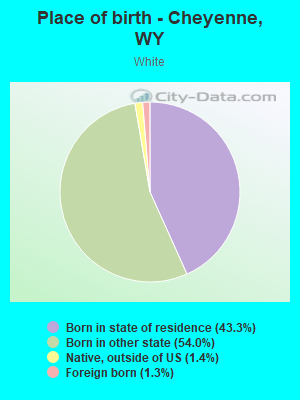
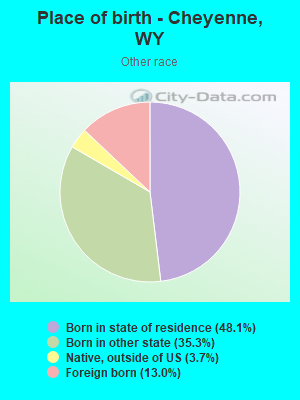
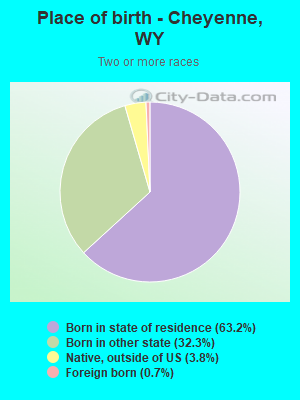
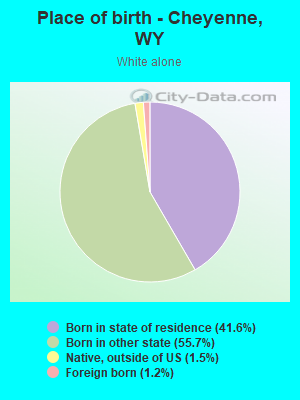
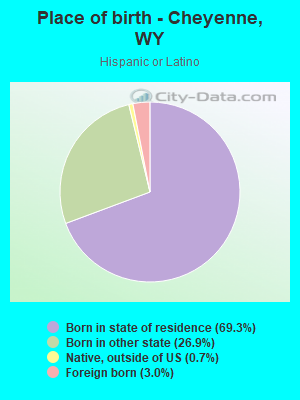
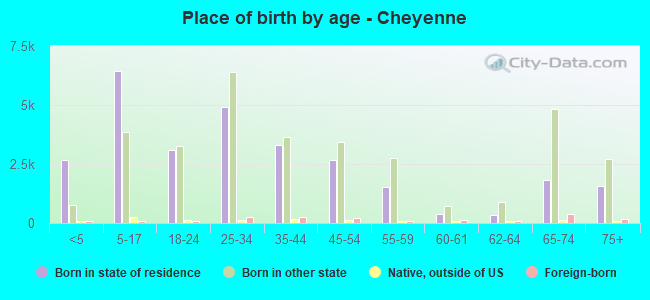
Place of birth - Born in state of residence (%)
Place of birth - Born in state of residence (%) - White
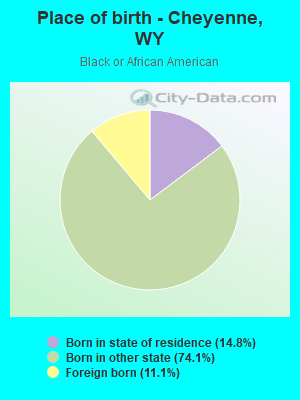
Place of birth - Born in state of residence (%) - Black or African American
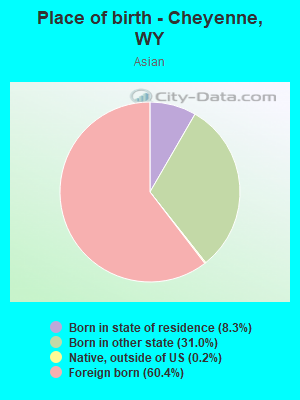
Place of birth - Born in state of residence (%) - Asian
Place of birth - Born in state of residence (%) - Hispanic or Latino
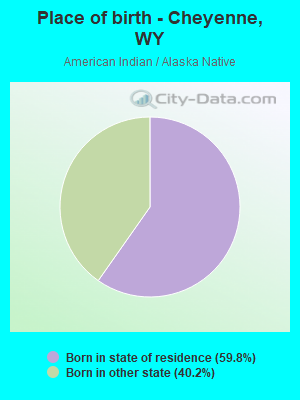
Place of birth - Born in state of residence (%) - American Indian and Alaska Native
Place of birth - Born in state of residence (%) - Multirace
Place of birth - Born in state of residence (%) - Other Race
Place of birth - Born in other state (%)
Place of birth - Born in other state (%) - White
Place of birth - Born in other state (%) - Black or African American
Place of birth - Born in other state (%) - Asian
Place of birth - Born in other state (%) - Hispanic or Latino
Place of birth - Born in other state (%) - American Indian and Alaska Native
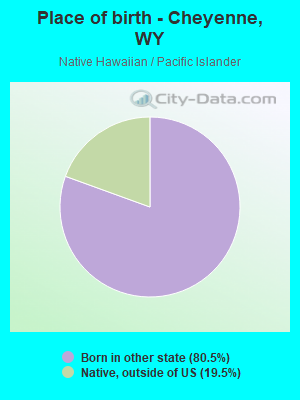
Place of birth - Born in other state (%) - Multirace
Place of birth - Born in other state (%) - Other Race
Place of birth - Native, outside of US (%)
Place of birth - Native, outside of US (%) - White
Place of birth - Native, outside of US (%) - Black or African American
Place of birth - Native, outside of US (%) - Asian
Place of birth - Native, outside of US (%) - Hispanic or Latino
Place of birth - Native, outside of US (%) - American Indian and Alaska Native
Place of birth - Native, outside of US (%) - Multirace
Place of birth - Native, outside of US (%) - Other Race
Place of birth - Foreign born (%)
Place of birth - Foreign born (%) - White
Place of birth - Foreign born (%) - Black or African American
Place of birth - Foreign born (%) - Asian
Place of birth - Foreign born (%) - Hispanic or Latino
Place of birth - Foreign born (%) - American Indian and Alaska Native
Place of birth - Foreign born (%) - Multirace
Place of birth - Foreign born (%) - Other Race
Residents speaking English at home (%)
Residents speaking English at home - Born in the United States (%)
Residents speaking English at home - Native, born elsewhere (%)
Residents speaking English at home - Foreign born (%)
Residents speaking Spanish at home (%)
Residents speaking Spanish at home - Born in the United States (%)
Residents speaking Spanish at home - Native, born elsewhere (%)
Residents speaking Spanish at home - Foreign born (%)
Residents speaking other language at home (%)
Residents speaking other language at home - Born in the United States (%)
Residents speaking other language at home - Native, born elsewhere (%)
Residents speaking other language at home - Foreign born (%)
Marital status - Never married (%)
Marital status - Now married (%)
Marital status - Separated (%)
Marital status - Widowed (%)
Marital status - Divorced (%)
Ancestries Reported - Arab (%)
Ancestries Reported - Czech (%)
Ancestries Reported - Danish (%)
Ancestries Reported - Dutch (%)
Ancestries Reported - English (%)
Ancestries Reported - French (%)
Ancestries Reported - French Canadian (%)
Ancestries Reported - German (%)
Ancestries Reported - Greek (%)
Ancestries Reported - Hungarian (%)
Ancestries Reported - Irish (%)
Ancestries Reported - Italian (%)
Ancestries Reported - Lithuanian (%)
Ancestries Reported - Norwegian (%)
Ancestries Reported - Polish (%)
Ancestries Reported - Portuguese (%)
Ancestries Reported - Russian (%)
Ancestries Reported - Scotch-Irish (%)
Ancestries Reported - Scottish (%)
Ancestries Reported - Slovak (%)
Ancestries Reported - Subsaharan African (%)
Ancestries Reported - Swedish (%)
Ancestries Reported - Swiss (%)
Ancestries Reported - Ukrainian (%)
Ancestries Reported - United States (%)
Ancestries Reported - Welsh (%)
Ancestries Reported - West Indian (%)
Ancestries Reported - Other (%)
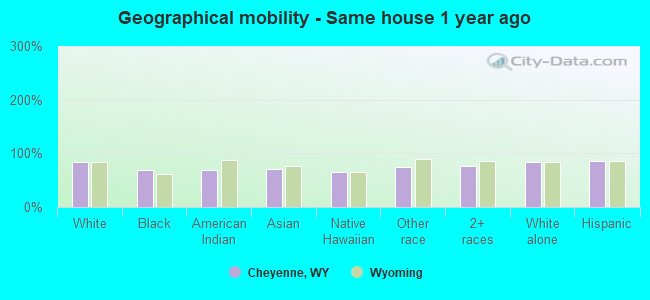
Geographical mobility - Same house 1 year ago (%)
Geographical mobility - Same house 1 year ago (%) - White
Geographical mobility - Same house 1 year ago (%) - Black or African American
Geographical mobility - Same house 1 year ago (%) - Asian
Geographical mobility - Same house 1 year ago (%) - Hispanic or Latino
Geographical mobility - Same house 1 year ago (%) - American Indian and Alaska Native
Geographical mobility - Same house 1 year ago (%) - Multirace
Geographical mobility - Same house 1 year ago (%) - Other Race
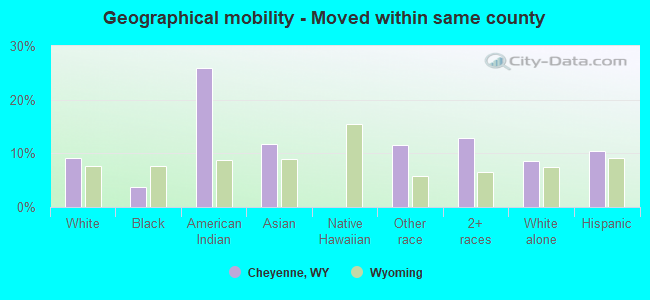
Geographical mobility - Moved within same county (%)
Geographical mobility - Moved within same county (%) - White
Geographical mobility - Moved within same county (%) - Black or African American
Geographical mobility - Moved within same county (%) - Asian
Geographical mobility - Moved within same county (%) - Hispanic or Latino
Geographical mobility - Moved within same county (%) - American Indian and Alaska Native
Geographical mobility - Moved within same county (%) - Multirace
Geographical mobility - Moved within same county (%) - Other Race
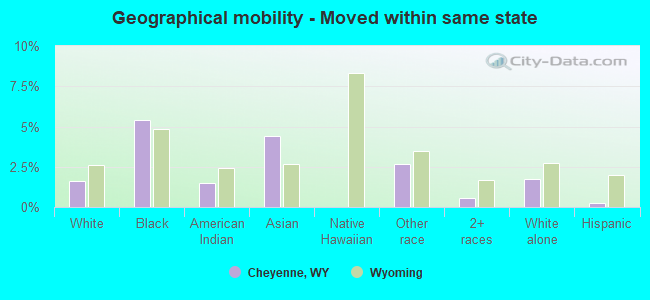
Geographical mobility - Moved from different county within same state (%)
Geographical mobility - Moved from different county within same state (%) - White
Geographical mobility - Moved from different county within same state (%) - Black or African American
Geographical mobility - Moved from different county within same state (%) - Asian
Geographical mobility - Moved from different county within same state (%) - Hispanic or Latino
Geographical mobility - Moved from different county within same state (%) - American Indian and Alaska Native
Geographical mobility - Moved from different county within same state (%) - Multirace
Geographical mobility - Moved from different county within same state (%) - Other Race
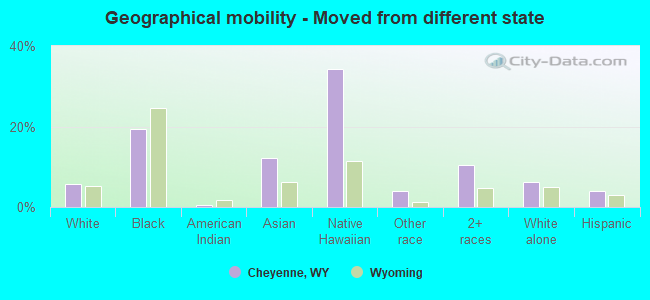
Geographical mobility - Moved from different state (%)
Geographical mobility - Moved from different state (%) - White
Geographical mobility - Moved from different state (%) - Black or African American
Geographical mobility - Moved from different state (%) - Asian
Geographical mobility - Moved from different state (%) - Hispanic or Latino
Geographical mobility - Moved from different state (%) - American Indian and Alaska Native
Geographical mobility - Moved from different state (%) - Multirace
Geographical mobility - Moved from different state (%) - Other Race
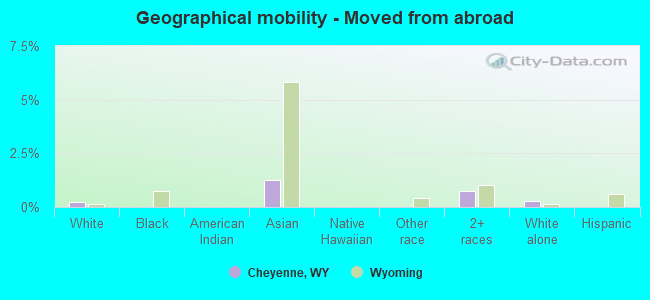
Geographical mobility - Moved from abroad (%)
Geographical mobility - Moved from abroad (%) - White
Geographical mobility - Moved from abroad (%) - Black or African American
Geographical mobility - Moved from abroad (%) - Asian
Geographical mobility - Moved from abroad (%) - Hispanic or Latino
Geographical mobility - Moved from abroad (%) - American Indian and Alaska Native
Geographical mobility - Moved from abroad (%) - Multirace
Geographical mobility - Moved from abroad (%) - Other Race
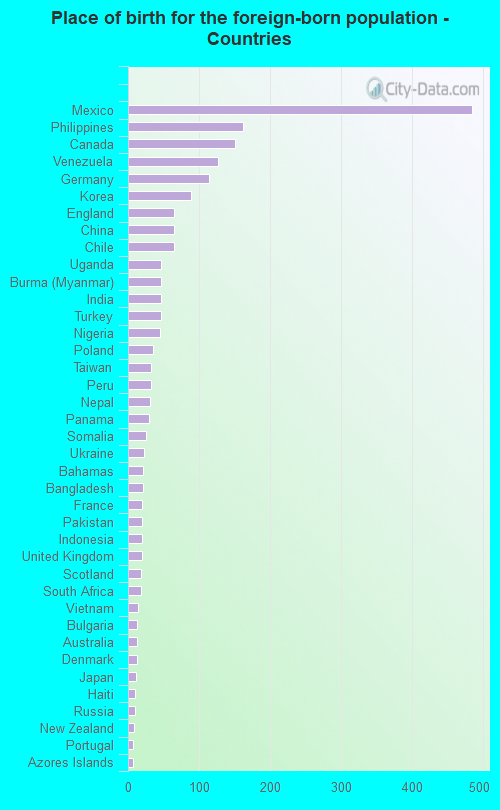
Place of birth for the foreign-born population - Ireland (%)
Place of birth for the foreign-born population - Denmark (%)
Place of birth for the foreign-born population - Norway (%)
Place of birth for the foreign-born population - Sweden (%)
Place of birth for the foreign-born population - United Kingdom (%)
Place of birth for the foreign-born population - England (%)
Place of birth for the foreign-born population - Scotland (%)
Place of birth for the foreign-born population - Other Northern Europe (%)
Place of birth for the foreign-born population - Austria (%)
Place of birth for the foreign-born population - Belgium (%)
Place of birth for the foreign-born population - France (%)
Place of birth for the foreign-born population - Germany (%)
Place of birth for the foreign-born population - Netherlands (%)
Place of birth for the foreign-born population - Switzerland (%)
Place of birth for the foreign-born population - Other Western Europe (%)
Place of birth for the foreign-born population - Greece (%)
Place of birth for the foreign-born population - Italy (%)
Place of birth for the foreign-born population - Portugal (%)
Place of birth for the foreign-born population - Spain (%)
Place of birth for the foreign-born population - Other Southern Europe (%)
Place of birth for the foreign-born population - Albania (%)
Place of birth for the foreign-born population - Belarus (%)
Place of birth for the foreign-born population - Bosnia and Herzegovina (%)
Place of birth for the foreign-born population - Bulgaria (%)
Place of birth for the foreign-born population - Croatia (%)
Place of birth for the foreign-born population - Czechoslovakia (%)
Place of birth for the foreign-born population - Hungary (%)
Place of birth for the foreign-born population - Latvia (%)
Place of birth for the foreign-born population - Lithuania (%)
Place of birth for the foreign-born population - North Macedonia (Macedonia) (%)
Place of birth for the foreign-born population - Moldova (%)
Place of birth for the foreign-born population - Poland (%)
Place of birth for the foreign-born population - Romania (%)
Place of birth for the foreign-born population - Russia (%)
Place of birth for the foreign-born population - Serbia (%)
Place of birth for the foreign-born population - Ukraine (%)
Place of birth for the foreign-born population - Other Eastern Europe (%)
Place of birth for the foreign-born population - China (%)
Place of birth for the foreign-born population - Hong Kong (%)
Place of birth for the foreign-born population - Taiwan (%)
Place of birth for the foreign-born population - Japan (%)
Place of birth for the foreign-born population - Korea (%)
Place of birth for the foreign-born population - Other Eastern Asia (%)
Place of birth for the foreign-born population - Afghanistan (%)
Place of birth for the foreign-born population - Bangladesh (%)
Place of birth for the foreign-born population - India (%)
Place of birth for the foreign-born population - Iran (%)
Place of birth for the foreign-born population - Kazakhstan (%)
Place of birth for the foreign-born population - Nepal (%)
Place of birth for the foreign-born population - Pakistan (%)
Place of birth for the foreign-born population - Sri Lanka (%)
Place of birth for the foreign-born population - Uzbekistan (%)
Place of birth for the foreign-born population - Other South Central Asia (%)
Place of birth for the foreign-born population - Burma (%)
Place of birth for the foreign-born population - Cambodia (%)
Place of birth for the foreign-born population - Indonesia (%)
Place of birth for the foreign-born population - Laos (%)
Place of birth for the foreign-born population - Malaysia (%)
Place of birth for the foreign-born population - Philippines (%)
Place of birth for the foreign-born population - Singapore (%)
Place of birth for the foreign-born population - Thailand (%)
Place of birth for the foreign-born population - Vietnam (%)
Place of birth for the foreign-born population - Other South Eastern Asia (%)
Place of birth for the foreign-born population - Armenia (%)
Place of birth for the foreign-born population - Iraq (%)
Place of birth for the foreign-born population - Israel (%)
Place of birth for the foreign-born population - Jordan (%)
Place of birth for the foreign-born population - Kuwait (%)
Place of birth for the foreign-born population - Lebanon (%)
Place of birth for the foreign-born population - Saudi Arabia (%)
Place of birth for the foreign-born population - Syria (%)
Place of birth for the foreign-born population - Turkey (%)
Place of birth for the foreign-born population - Yemen (%)
Place of birth for the foreign-born population - Other Western Asia (%)
Place of birth for the foreign-born population - Eritrea (%)
Place of birth for the foreign-born population - Ethiopia (%)
Place of birth for the foreign-born population - Kenya (%)
Place of birth for the foreign-born population - Somalia (%)
Place of birth for the foreign-born population - Uganda (%)
Place of birth for the foreign-born population - Zimbabwe (%)
Place of birth for the foreign-born population - Other Eastern Africa (%)
Place of birth for the foreign-born population - Cameroon (%)
Place of birth for the foreign-born population - Congo (%)
Place of birth for the foreign-born population - Democratic Republic of Congo (Zaire) (%)
Place of birth for the foreign-born population - Other Middle Africa (%)
Place of birth for the foreign-born population - Egypt (%)
Place of birth for the foreign-born population - Morocco (%)
Place of birth for the foreign-born population - Sudan (%)
Place of birth for the foreign-born population - Other Northern Africa (%)
Place of birth for the foreign-born population - South Africa (%)
Place of birth for the foreign-born population - Other Southern Africa (%)
Place of birth for the foreign-born population - Cabo Verde (%)
Place of birth for the foreign-born population - Ghana (%)
Place of birth for the foreign-born population - Liberia (%)
Place of birth for the foreign-born population - Nigeria (%)
Place of birth for the foreign-born population - Senegal (%)
Place of birth for the foreign-born population - Sierra Leone (%)
Place of birth for the foreign-born population - Other Western Africa (%)
Place of birth for the foreign-born population - Australia (%)
Place of birth for the foreign-born population - New Zealand (%)
Place of birth for the foreign-born population - Fiji (%)
Place of birth for the foreign-born population - Micronesia (%)
Place of birth for the foreign-born population - Bahamas (%)
Place of birth for the foreign-born population - Barbados (%)
Place of birth for the foreign-born population - Cuba (%)
Place of birth for the foreign-born population - Dominica (%)
Place of birth for the foreign-born population - Dominican Republic (%)
Place of birth for the foreign-born population - Grenada (%)
Place of birth for the foreign-born population - Haiti (%)
Place of birth for the foreign-born population - Jamaica (%)
Place of birth for the foreign-born population - St. Vincent and the Grenadines (%)
Place of birth for the foreign-born population - Trinidad and Tobago (%)
Place of birth for the foreign-born population - West Indies (%)
Place of birth for the foreign-born population - Other Caribbean (%)
Place of birth for the foreign-born population - Belize (%)
Place of birth for the foreign-born population - Costa Rica (%)
Place of birth for the foreign-born population - El Salvador (%)
Place of birth for the foreign-born population - Guatemala (%)
Place of birth for the foreign-born population - Honduras (%)
Place of birth for the foreign-born population - Mexico (%)
Place of birth for the foreign-born population - Nicaragua (%)
Place of birth for the foreign-born population - Panama (%)
Place of birth for the foreign-born population - Other Central America (%)
Place of birth for the foreign-born population - Argentina (%)
Place of birth for the foreign-born population - Bolivia (%)
Place of birth for the foreign-born population - Brazil (%)
Place of birth for the foreign-born population - Chile (%)
Place of birth for the foreign-born population - Colombia (%)
Place of birth for the foreign-born population - Ecuador (%)
Place of birth for the foreign-born population - Guyana (%)
Place of birth for the foreign-born population - Peru (%)
Place of birth for the foreign-born population - Uruguay (%)
Place of birth for the foreign-born population - Venezuela (%)
Place of birth for the foreign-born population - Other South America (%)
Place of birth for the foreign-born population - Canada (%)
Place of birth for the foreign-born population - Other Northern America (%)
Place of birth for the foreign-born population - Other (%)
Latest news about races in Cheyenne, WY collected exclusively by city-data.com from local newspapers, TV, and radio stations
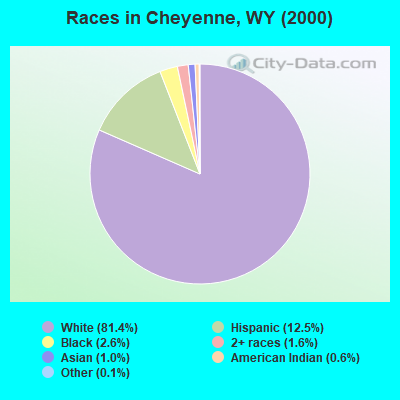
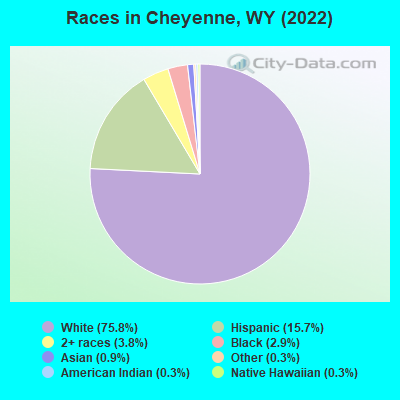
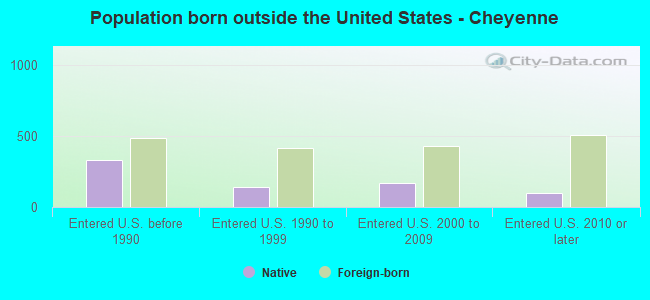
According to 2022 data, the most numerous races in Cheyenne, WY are White alone (49,012 residents), Hispanic (10,154 residents), and Two or more races (2,475 residents). 94.0% of Cheyenne residents speak English at home. 3.2% of Cheyenne, WY residents are foreign-born (1.2% born in Latin America, 0.9% born in Asia, 0.5% born in Europe), which is 5.8% greater than the foreign-born rate of 3.0% across the entire state of Wyoming.
Race distribution in Cheyenne
2000 2022
438,799 88.9% White alone 31,669 6.4% Hispanic 10,238 2.1% American Indian alone 6,164 1.2% Two or more races 3,504 0.7% Black alone 2,670 0.5% Asian alone 474 0.10% Other race alone 264 0.05% Native Hawaiian and Other
473,220 81.4% White alone 62,803 10.8% Hispanic 22,911 3.9% Two or more races 9,589 1.6% American Indian alone 4,997 0.9% Other race alone 3,990 0.7% Black alone 3,577 0.6% Asian alone 294 0.05% Native Hawaiian and Other
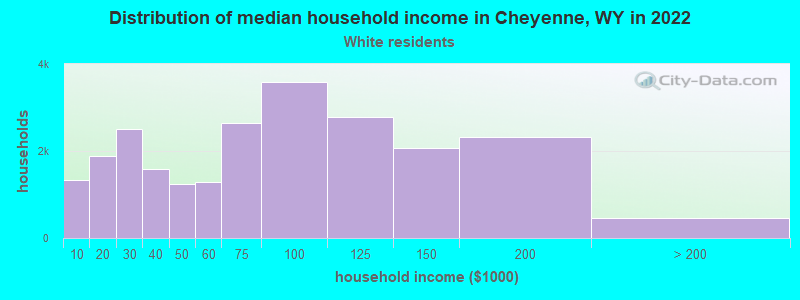
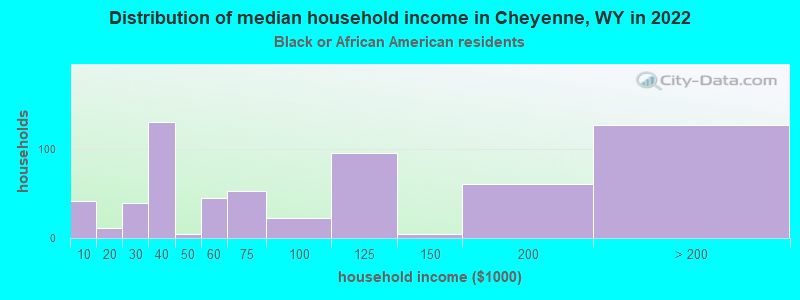
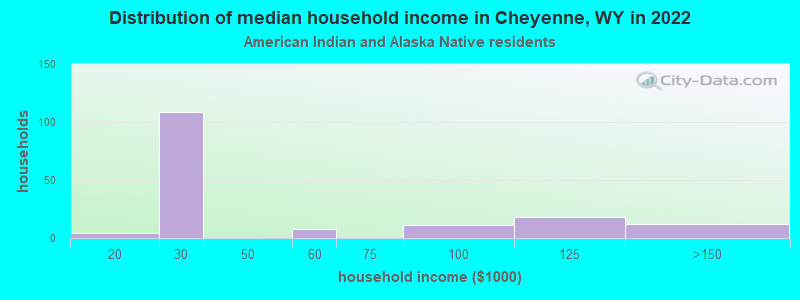
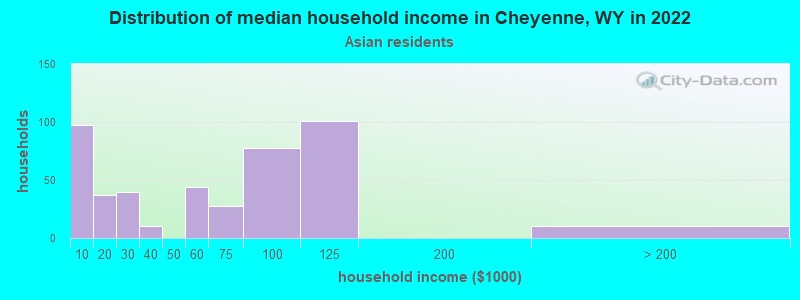
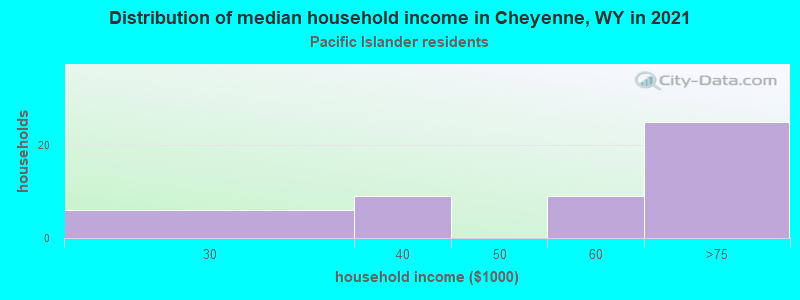
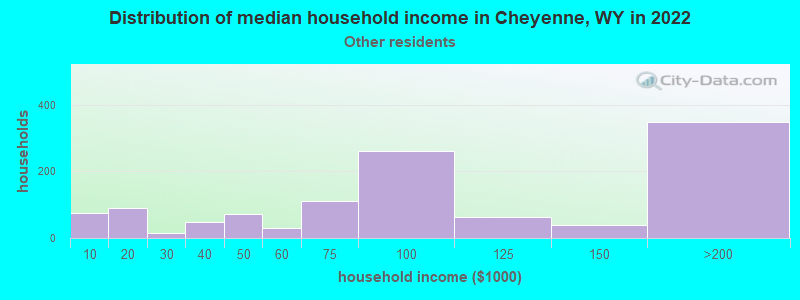
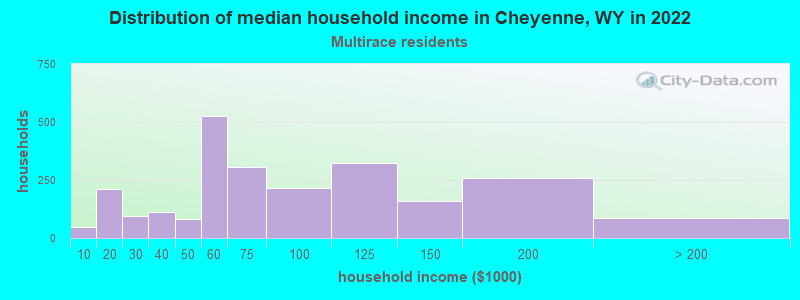
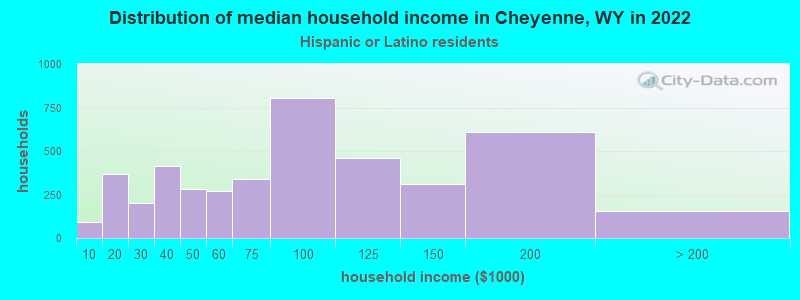
Income and house value in Cheyenne Median household income in 2022 $71,322 White non-Hispanic householders$96,049 Asian householders$48,528 Some other race householders$75,319 Two or more races householders$76,103 Hispanic or Latino race householdersMedian 2022 house value $335,178 White Non-Hispanic householders$347,320 Black or African American householders$335,817 American Indian or Alaska Native householders $431,354 Asian householders$264,244 Some other race householders$291,403 Two or more races householders$271,593 Hispanic or Latino householders
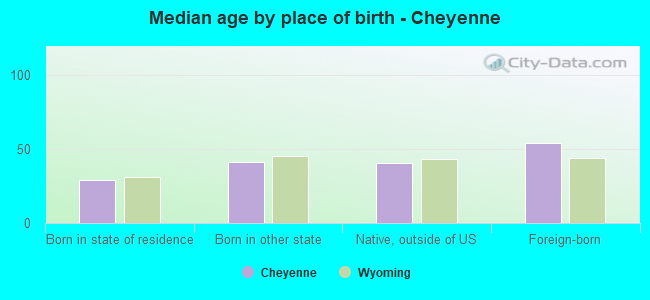
Median age by race in Cheyenne
38.2 Median age for White residents37.0 39.6 27.0 Median age for Black or African American residents24.8 32.3 41.0 Median age for American Indian / Alaska Native residents48.1 36.0 32.0 Median age for Asian residents26.0 40.0 18.9 Median age for Native Hawaiian / Pacific Islander residents18.9 -666,666,666.0 57.1 Median age for Other race residents43.3 60.8 23.3 Median age for Two or more races residents30.5 19.5 39.2 Median age for White alone residents37.2 43.0 29.4 Median age for Hispanic or Latino residents31.1 26.7
Owner/renter occupied households by race in Cheyenne
House owners and renters - White residents 16,593 70.1% Owner occupied7,091 29.9% Renter occupiedHouse owners and renters - Black or African American residents 85 10.9% Owner occupied698 89.1% Renter occupiedHouse owners and renters - American Indian / Alaska Native residents 65 36.8% Owner occupied112 63.2% Renter occupiedHouse owners and renters - Asian residents 153 38.6% Owner occupied243 61.4% Renter occupiedHouse owners and renters - Native Hawaiian / Pacific Islander residents 55 59.1% Owner occupied38 40.9% Renter occupiedHouse owners and renters - Other race residents 542 62.6% Owner occupied324 37.4% Renter occupiedHouse owners and renters - Two or more races residents 2,001 73.3% Owner occupied729 26.7% Renter occupiedHouse owners and renters - White alone residents 15,827 70.6% Owner occupied6,597 29.4% Renter occupiedHouse owners and renters - Hispanic or Latino residents 3,019 78.4% Owner occupied831 21.6% Renter occupied
Language usage in Cheyenne
English speakers - Total 94.0% of residents of Cheyenne speak English at home.
4.4% of residents speak Spanish at home 2,089 77.1% Speak English very well622 22.9% Speak English less than very well1.5% of residents speak other language at home 753 80.4% Speak English very well183 19.6% Speak English less than very well
English speakers - Born in the United States 96.2% of residents of Cheyenne speak English at home.
3.5% of residents speak Spanish at home 1,067 89.7% Speak English very well122 10.3% Speak English less than very well0.3% of residents speak other language at home 95 90.5% Speak English very well10 9.5% Speak English less than very well
English speakers - Native, born elsewhere 93.9% of residents of Cheyenne speak English at home.
7.1% of residents speak Spanish at home 60 100.0% Speak English very well1.8% of residents speak other language at home 15 100.0% Speak English very well
English speakers - Foreign-born 23.6% of residents of Cheyenne speak English at home.
32.8% of residents speak Spanish at home 292 54.3% Speak English very well246 45.7% Speak English less than very well43.1% of residents speak other language at home 508 71.8% Speak English very well200 28.2% Speak English less than very well
White (Caucasian) - Speak only English Native:
98.1% (49,250)Foreign-born:
38.1% (273)
White (Caucasian) - Speak another language Native:
2.0% (981)Foreign-born:
54.4% (389)
Black or African American - Speak only English Native:
100.0% (1,512)Foreign-born:
42.0% (77)
Asian - Speak only English Native:
100.0% (159)Foreign-born:
17.0% (90)
Asian - Speak another language Native:
26.0% (41)Foreign-born:
73.9% (391)
Other race - Speak only English Native:
87.4% (2,121)Foreign-born:
14.9% (54)
Other race - Speak another language Native:
16.9% (409)Foreign-born:
83.1% (301)
Two or more races - Speak another language Native:
11.5% (655)Foreign-born:
100.0% (266)
White alone - Speak only English Native:
98.8% (45,989)Foreign-born:
44.6% (237)
White alone - Speak another language Native:
1.2% (564)Foreign-born:
54.3% (289)
Hispanic or Latino - Speak only English Native:
79.9% (7,449)Foreign-born:
25.9% (151)
Hispanic or Latino - Speak another language Native:
18.6% (1,732)Foreign-born:
88.1% (513)
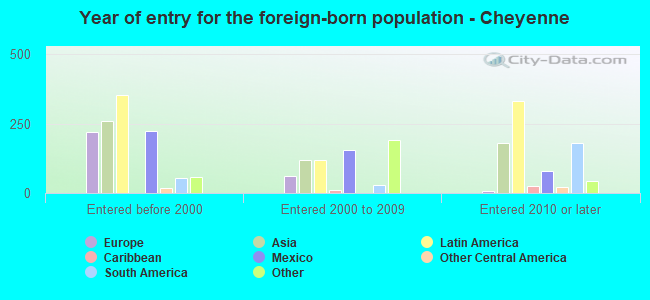
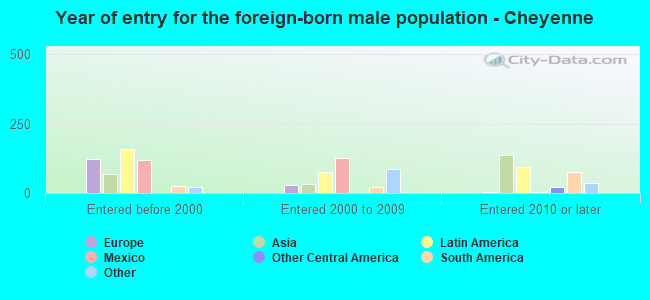
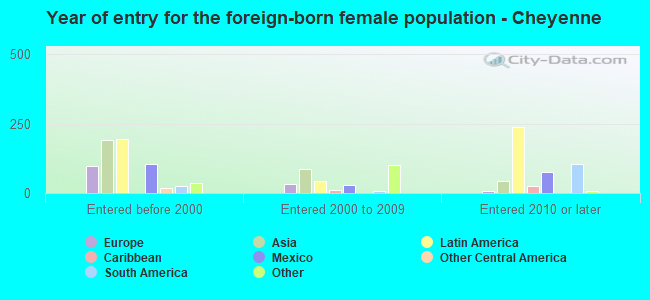
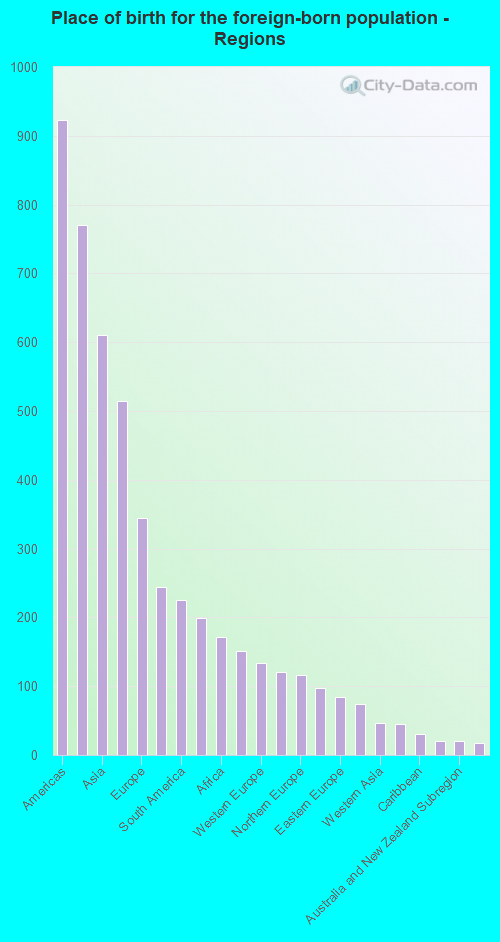
Foreign-born residents in Cheyenne 2,071 residents are foreign born (1.2% Latin America , 0.9% Asia , 0.5% Europe ).
This city:
3.2%Wyoming:
3.4%
Marital status for residents in Cheyenne Marital status - White (Caucasian) population 15 years and over
Males 34.3% Never married51.7% Now married0.0% Separated1.8% Widowed12.2% DivorcedFemales 18.9% Never married51.9% Now married0.9% Separated6.6% Widowed21.6% DivorcedWomen who gave birth in the past 12 months Now married:
82.6% (695)Unmarried:
17.4% (146)
Women who did not give birth in the past 12 months Now married:
48.4% (5,039)Unmarried:
51.6% (5,365)
Marital status - Black or African American population 15 years and over
Males 43.8% Never married49.3% Now married0.0% Separated0.0% Widowed6.8% DivorcedFemales 54.0% Never married42.3% Now married0.7% Separated0.2% Widowed2.7% DivorcedWomen who gave birth in the past 12 months Now married:
100.0% (15)Unmarried:
0.0% (0)
Women who did not give birth in the past 12 months Now married:
39.9% (153)Unmarried:
60.1% (230)
Marital status - American Indian / Alaska Native population 15 years and over
Males 35.2% Never married36.6% Now married0.0% Separated0.0% Widowed28.2% DivorcedFemales 19.5% Never married35.3% Now married10.4% Separated2.3% Widowed32.6% DivorcedWomen who did not give birth in the past 12 months Now married:
42.9% (52)Unmarried:
57.1% (69)
Marital status - Asian population 15 years and over
Males 47.3% Never married52.7% Now married0.0% Separated0.0% Widowed0.0% DivorcedFemales 16.1% Never married63.4% Now married0.0% Separated18.1% Widowed2.4% DivorcedWomen who did not give birth in the past 12 months Now married:
76.4% (206)Unmarried:
23.6% (63)
Marital status - Native Hawaiian / Pacific Islander population 15 years and over
Males 46.7% Never married53.3% Now married0.0% Separated0.0% Widowed0.0% DivorcedFemales 47.5% Never married52.5% Now married0.0% Separated0.0% Widowed0.0% DivorcedWomen who did not give birth in the past 12 months Now married:
0.0% (0)Unmarried:
100.0% (31)
Marital status - Other race population 15 years and over
Males 40.8% Never married51.6% Now married1.7% Separated2.2% Widowed3.7% DivorcedFemales 15.3% Never married66.2% Now married0.0% Separated11.6% Widowed7.0% DivorcedWomen who did not give birth in the past 12 months Now married:
80.4% (722)Unmarried:
19.6% (176)
Marital status - Two or more races population 15 years and over
Males 51.6% Never married32.7% Now married1.8% Separated0.4% Widowed13.5% DivorcedFemales 34.8% Never married48.8% Now married0.0% Separated5.5% Widowed10.9% DivorcedWomen who gave birth in the past 12 months Now married:
100.0% (28)Unmarried:
0.0% (0)
Women who did not give birth in the past 12 months Now married:
51.5% (745)Unmarried:
48.5% (702)
Marital status - White alone, not Hispanic / Latino population 15 years and over
Males 34.3% Never married50.8% Now married0.0% Separated1.9% Widowed13.0% DivorcedFemales 19.7% Never married50.4% Now married1.0% Separated7.1% Widowed21.9% DivorcedWomen who gave birth in the past 12 months Now married:
82.6% (695)Unmarried:
17.4% (146)
Women who did not give birth in the past 12 months Now married:
44.9% (4,171)Unmarried:
55.1% (5,124)
Marital status - Hispanic or Latino population 15 years and over
Males 57.4% Never married36.3% Now married0.0% Separated0.0% Widowed6.3% DivorcedFemales 16.0% Never married58.1% Now married0.0% Separated12.6% Widowed13.3% DivorcedWomen who gave birth in the past 12 months Now married:
25.0% (9)Unmarried:
75.0% (27)
Women who did not give birth in the past 12 months Now married:
54.6% (1,478)Unmarried:
45.4% (1,226)
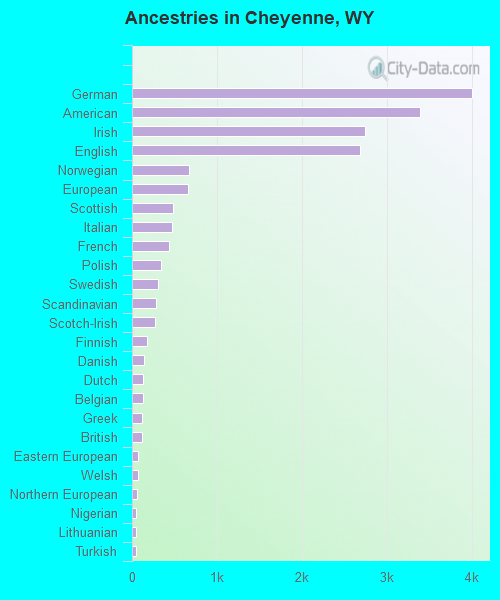
Ancestries in Cheyenne
4,002 14.7% German3,394 12.5% American2,739 10.1% Irish2,683 9.9% English673 2.5% Norwegian664 2.4% European485 1.8% Scottish468 1.7% Italian439 1.6% French343 1.3% Polish306 1.1% Swedish286 1.1% Scandinavian269 1.0% Scotch-Irish178 0.7% Finnish136 0.5% Danish132 0.5% Dutch124 0.5% Belgian123 0.5% Greek115 0.4% British68 0.3% Eastern European67 0.2% Welsh60 0.2% Northern European52 0.2% Nigerian52 0.2% Lithuanian49 0.2% Turkish47 0.2% Czech47 0.2% African41 0.2% French Canadian38 0.1% Barbadian37 0.1% Ghanaian32 0.1% Czechoslovakian25 0.09% Somali21 0.08% Bahamian20 0.07% Portuguese19 0.07% Russian17 0.06% Pennsylvania German16 0.06% Romanian14 0.05% Slavic14 0.05% Iranian13 0.05% New Zealander11 0.04% Hungarian10 0.04% Haitian9 0.03% German Russian9 0.03% Trinidadian and Tobagonian7 0.03% Swiss6 0.02% Croatian2 0.01% Ukrainian
Geographical mobility in Cheyenne Same house 1 year ago 43,707 83.3% White (Caucasian)1,079 69.7% Black or African American318 69.3% American Indian / Alaska Native654 70.6% Asian96 66.1% Native Hawaiian / Pacific Islander2,114 74.7% Other race5,087 76.0% Two or more races40,528 83.2% White alone, not Hispanic / Latino9,419 85.5% Hispanic or LatinoMoved within same county 4,805 9.2% White / Caucasian58 3.8% Black or African American119 26.0% American Indian / Alaska Native109 11.8% Asian329 11.6% Other race861 12.9% Two or more races4,218 8.7% White alone, not Hispanic / Latino1,146 10.4% Hispanic or LatinoMoved within same state 841 1.6% White / Caucasian84 5.4% Black or African American7 1.5% American Indian / Alaska Native41 4.4% Asian76 2.7% Other race39 0.6% Two or more races841 1.7% White alone, not Hispanic / Latino27 0.2% Hispanic or LatinoMoved from different state 2,990 5.7% White / Caucasian302 19.5% Black or African American2 0.5% American Indian / Alaska Native112 12.1% Asian50 34.3% Native Hawaiian / Pacific Islander115 4.0% Other race694 10.4% Two or more races2,990 6.1% White alone, not Hispanic / Latino446 4.0% Hispanic or LatinoMoved from abroad 126 0.2% White11 1.2% Asian50 0.8% Two or more races126 0.3% White alone, not Hispanic / Latino
Children Nativity (place of birth) in Cheyenne
Children under 6 years - Living with two parents Both parents native 2,672 100.0% NativeBoth parents foreign-born 14 100.0% NativeOne native, one foreign-born parent 166 100.0% NativeChildren under 6 years - Living with one parent Native parent 1,424 100.0% NativeChildren 6 to 17 years - Living with two parents Both parents native 5,050 99.9% Native5 0.1% Foreign-bornBoth parents foreign-born 51 100.0% NativeOne native, one foreign-born parent 482 98.3% Native8 1.7% Foreign-bornChildren 6 to 17 years - Living with one parent Native parent 2,894 100.0% NativeForeign-born parent 157 50.2% Native155 49.8% Foreign-born
Grandparents responsible for own grandchildren in Cheyenne
Grandparents (30 to 59 years) White / Caucasian 141 27.2% Responsible for grandchildren377 72.8% Not responsible for grandchildrenAsian 14 100.0% Responsible for grandchildrenOther race 8 100.0% Responsible for grandchildrenTwo or more races 49 100.0% Responsible for grandchildrenWhite alone, not Hispanic / Latino 155 19.8% Responsible for grandchildren625 80.2% Not responsible for grandchildrenHispanic or Latino 106 95.0% Responsible for grandchildren6 5.0% Not responsible for grandchildrenGrandparents (60 years and over) White / Caucasian 174 60.2% Responsible for grandchildren115 39.8% Not responsible for grandchildrenOther race 14 100.0% Responsible for grandchildrenTwo or more races 25 100.0% Responsible for grandchildrenWhite alone, not Hispanic / Latino 141 50.1% Responsible for grandchildren140 49.9% Not responsible for grandchildrenHispanic or Latino 13 26.5% Responsible for grandchildren36 73.5% Not responsible for grandchildren