Races in Camano, Washington (WA) Detailed Stats Ancestries, Foreign-born residents, place of birth
Data:
Races - White alone (%)
Races - White alone (% change since 2000)
Races - Black alone (%)
Races - Black alone (% change since 2000)
Races - American Indian alone (%)
Races - American Indian alone (% change since 2000)
Races - Asian alone (%)
Races - Asian alone (% change since 2000)
Races - Hispanic (%)
Races - Hispanic (% change since 2000)
Races - Native Hawaiian and Other Pacific Islander alone (%)
Races - Native Hawaiian and Other Pacific Islander alone (% change since 2000)
Races - Two or more races(%)
Races - Two or more races(% change since 2000)
Races - Other race alone (%)
Races - Other race alone (% change since 2000)
Racial diversity
Place of birth - Born in state of residence (%)
Place of birth - Born in state of residence (%) - White
Place of birth - Born in state of residence (%) - Black or African American
Place of birth - Born in state of residence (%) - Asian
Place of birth - Born in state of residence (%) - Hispanic or Latino
Place of birth - Born in state of residence (%) - American Indian and Alaska Native
Place of birth - Born in state of residence (%) - Multirace
Place of birth - Born in state of residence (%) - Other Race
Place of birth - Born in other state (%)
Place of birth - Born in other state (%) - White
Place of birth - Born in other state (%) - Black or African American
Place of birth - Born in other state (%) - Asian
Place of birth - Born in other state (%) - Hispanic or Latino
Place of birth - Born in other state (%) - American Indian and Alaska Native
Place of birth - Born in other state (%) - Multirace
Place of birth - Born in other state (%) - Other Race
Place of birth - Native, outside of US (%)
Place of birth - Native, outside of US (%) - White
Place of birth - Native, outside of US (%) - Black or African American
Place of birth - Native, outside of US (%) - Asian
Place of birth - Native, outside of US (%) - Hispanic or Latino
Place of birth - Native, outside of US (%) - American Indian and Alaska Native
Place of birth - Native, outside of US (%) - Multirace
Place of birth - Native, outside of US (%) - Other Race
Place of birth - Foreign born (%)
Place of birth - Foreign born (%) - White
Place of birth - Foreign born (%) - Black or African American
Place of birth - Foreign born (%) - Asian
Place of birth - Foreign born (%) - Hispanic or Latino
Place of birth - Foreign born (%) - American Indian and Alaska Native
Place of birth - Foreign born (%) - Multirace
Place of birth - Foreign born (%) - Other Race
Residents speaking English at home (%)
Residents speaking English at home - Born in the United States (%)
Residents speaking English at home - Native, born elsewhere (%)
Residents speaking English at home - Foreign born (%)
Residents speaking Spanish at home (%)
Residents speaking Spanish at home - Born in the United States (%)
Residents speaking Spanish at home - Native, born elsewhere (%)
Residents speaking Spanish at home - Foreign born (%)
Residents speaking other language at home (%)
Residents speaking other language at home - Born in the United States (%)
Residents speaking other language at home - Native, born elsewhere (%)
Residents speaking other language at home - Foreign born (%)
Marital status - Never married (%)
Marital status - Now married (%)
Marital status - Separated (%)
Marital status - Widowed (%)
Marital status - Divorced (%)
Ancestries Reported - Arab (%)
Ancestries Reported - Czech (%)
Ancestries Reported - Danish (%)
Ancestries Reported - Dutch (%)
Ancestries Reported - English (%)
Ancestries Reported - French (%)
Ancestries Reported - French Canadian (%)
Ancestries Reported - German (%)
Ancestries Reported - Greek (%)
Ancestries Reported - Hungarian (%)
Ancestries Reported - Irish (%)
Ancestries Reported - Italian (%)
Ancestries Reported - Lithuanian (%)
Ancestries Reported - Norwegian (%)
Ancestries Reported - Polish (%)
Ancestries Reported - Portuguese (%)
Ancestries Reported - Russian (%)
Ancestries Reported - Scotch-Irish (%)
Ancestries Reported - Scottish (%)
Ancestries Reported - Slovak (%)
Ancestries Reported - Subsaharan African (%)
Ancestries Reported - Swedish (%)
Ancestries Reported - Swiss (%)
Ancestries Reported - Ukrainian (%)
Ancestries Reported - United States (%)
Ancestries Reported - Welsh (%)
Ancestries Reported - West Indian (%)
Ancestries Reported - Other (%)
Geographical mobility - Same house 1 year ago (%)
Geographical mobility - Same house 1 year ago (%) - White
Geographical mobility - Same house 1 year ago (%) - Black or African American
Geographical mobility - Same house 1 year ago (%) - Asian
Geographical mobility - Same house 1 year ago (%) - Hispanic or Latino
Geographical mobility - Same house 1 year ago (%) - American Indian and Alaska Native
Geographical mobility - Same house 1 year ago (%) - Multirace
Geographical mobility - Same house 1 year ago (%) - Other Race
Geographical mobility - Moved within same county (%)
Geographical mobility - Moved within same county (%) - White
Geographical mobility - Moved within same county (%) - Black or African American
Geographical mobility - Moved within same county (%) - Asian
Geographical mobility - Moved within same county (%) - Hispanic or Latino
Geographical mobility - Moved within same county (%) - American Indian and Alaska Native
Geographical mobility - Moved within same county (%) - Multirace
Geographical mobility - Moved within same county (%) - Other Race
Geographical mobility - Moved from different county within same state (%)
Geographical mobility - Moved from different county within same state (%) - White
Geographical mobility - Moved from different county within same state (%) - Black or African American
Geographical mobility - Moved from different county within same state (%) - Asian
Geographical mobility - Moved from different county within same state (%) - Hispanic or Latino
Geographical mobility - Moved from different county within same state (%) - American Indian and Alaska Native
Geographical mobility - Moved from different county within same state (%) - Multirace
Geographical mobility - Moved from different county within same state (%) - Other Race
Geographical mobility - Moved from different state (%)
Geographical mobility - Moved from different state (%) - White
Geographical mobility - Moved from different state (%) - Black or African American
Geographical mobility - Moved from different state (%) - Asian
Geographical mobility - Moved from different state (%) - Hispanic or Latino
Geographical mobility - Moved from different state (%) - American Indian and Alaska Native
Geographical mobility - Moved from different state (%) - Multirace
Geographical mobility - Moved from different state (%) - Other Race
Geographical mobility - Moved from abroad (%)
Geographical mobility - Moved from abroad (%) - White
Geographical mobility - Moved from abroad (%) - Black or African American
Geographical mobility - Moved from abroad (%) - Asian
Geographical mobility - Moved from abroad (%) - Hispanic or Latino
Geographical mobility - Moved from abroad (%) - American Indian and Alaska Native
Geographical mobility - Moved from abroad (%) - Multirace
Geographical mobility - Moved from abroad (%) - Other Race
Place of birth for the foreign-born population - Ireland (%)
Place of birth for the foreign-born population - Denmark (%)
Place of birth for the foreign-born population - Norway (%)
Place of birth for the foreign-born population - Sweden (%)
Place of birth for the foreign-born population - United Kingdom (%)
Place of birth for the foreign-born population - England (%)
Place of birth for the foreign-born population - Scotland (%)
Place of birth for the foreign-born population - Other Northern Europe (%)
Place of birth for the foreign-born population - Austria (%)
Place of birth for the foreign-born population - Belgium (%)
Place of birth for the foreign-born population - France (%)
Place of birth for the foreign-born population - Germany (%)
Place of birth for the foreign-born population - Netherlands (%)
Place of birth for the foreign-born population - Switzerland (%)
Place of birth for the foreign-born population - Other Western Europe (%)
Place of birth for the foreign-born population - Greece (%)
Place of birth for the foreign-born population - Italy (%)
Place of birth for the foreign-born population - Portugal (%)
Place of birth for the foreign-born population - Spain (%)
Place of birth for the foreign-born population - Other Southern Europe (%)
Place of birth for the foreign-born population - Albania (%)
Place of birth for the foreign-born population - Belarus (%)
Place of birth for the foreign-born population - Bosnia and Herzegovina (%)
Place of birth for the foreign-born population - Bulgaria (%)
Place of birth for the foreign-born population - Croatia (%)
Place of birth for the foreign-born population - Czechoslovakia (%)
Place of birth for the foreign-born population - Hungary (%)
Place of birth for the foreign-born population - Latvia (%)
Place of birth for the foreign-born population - Lithuania (%)
Place of birth for the foreign-born population - North Macedonia (Macedonia) (%)
Place of birth for the foreign-born population - Moldova (%)
Place of birth for the foreign-born population - Poland (%)
Place of birth for the foreign-born population - Romania (%)
Place of birth for the foreign-born population - Russia (%)
Place of birth for the foreign-born population - Serbia (%)
Place of birth for the foreign-born population - Ukraine (%)
Place of birth for the foreign-born population - Other Eastern Europe (%)
Place of birth for the foreign-born population - China (%)
Place of birth for the foreign-born population - Hong Kong (%)
Place of birth for the foreign-born population - Taiwan (%)
Place of birth for the foreign-born population - Japan (%)
Place of birth for the foreign-born population - Korea (%)
Place of birth for the foreign-born population - Other Eastern Asia (%)
Place of birth for the foreign-born population - Afghanistan (%)
Place of birth for the foreign-born population - Bangladesh (%)
Place of birth for the foreign-born population - India (%)
Place of birth for the foreign-born population - Iran (%)
Place of birth for the foreign-born population - Kazakhstan (%)
Place of birth for the foreign-born population - Nepal (%)
Place of birth for the foreign-born population - Pakistan (%)
Place of birth for the foreign-born population - Sri Lanka (%)
Place of birth for the foreign-born population - Uzbekistan (%)
Place of birth for the foreign-born population - Other South Central Asia (%)
Place of birth for the foreign-born population - Burma (%)
Place of birth for the foreign-born population - Cambodia (%)
Place of birth for the foreign-born population - Indonesia (%)
Place of birth for the foreign-born population - Laos (%)
Place of birth for the foreign-born population - Malaysia (%)
Place of birth for the foreign-born population - Philippines (%)
Place of birth for the foreign-born population - Singapore (%)
Place of birth for the foreign-born population - Thailand (%)
Place of birth for the foreign-born population - Vietnam (%)
Place of birth for the foreign-born population - Other South Eastern Asia (%)
Place of birth for the foreign-born population - Armenia (%)
Place of birth for the foreign-born population - Iraq (%)
Place of birth for the foreign-born population - Israel (%)
Place of birth for the foreign-born population - Jordan (%)
Place of birth for the foreign-born population - Kuwait (%)
Place of birth for the foreign-born population - Lebanon (%)
Place of birth for the foreign-born population - Saudi Arabia (%)
Place of birth for the foreign-born population - Syria (%)
Place of birth for the foreign-born population - Turkey (%)
Place of birth for the foreign-born population - Yemen (%)
Place of birth for the foreign-born population - Other Western Asia (%)
Place of birth for the foreign-born population - Eritrea (%)
Place of birth for the foreign-born population - Ethiopia (%)
Place of birth for the foreign-born population - Kenya (%)
Place of birth for the foreign-born population - Somalia (%)
Place of birth for the foreign-born population - Uganda (%)
Place of birth for the foreign-born population - Zimbabwe (%)
Place of birth for the foreign-born population - Other Eastern Africa (%)
Place of birth for the foreign-born population - Cameroon (%)
Place of birth for the foreign-born population - Congo (%)
Place of birth for the foreign-born population - Democratic Republic of Congo (Zaire) (%)
Place of birth for the foreign-born population - Other Middle Africa (%)
Place of birth for the foreign-born population - Egypt (%)
Place of birth for the foreign-born population - Morocco (%)
Place of birth for the foreign-born population - Sudan (%)
Place of birth for the foreign-born population - Other Northern Africa (%)
Place of birth for the foreign-born population - South Africa (%)
Place of birth for the foreign-born population - Other Southern Africa (%)
Place of birth for the foreign-born population - Cabo Verde (%)
Place of birth for the foreign-born population - Ghana (%)
Place of birth for the foreign-born population - Liberia (%)
Place of birth for the foreign-born population - Nigeria (%)
Place of birth for the foreign-born population - Senegal (%)
Place of birth for the foreign-born population - Sierra Leone (%)
Place of birth for the foreign-born population - Other Western Africa (%)
Place of birth for the foreign-born population - Australia (%)
Place of birth for the foreign-born population - New Zealand (%)
Place of birth for the foreign-born population - Fiji (%)
Place of birth for the foreign-born population - Micronesia (%)
Place of birth for the foreign-born population - Bahamas (%)
Place of birth for the foreign-born population - Barbados (%)
Place of birth for the foreign-born population - Cuba (%)
Place of birth for the foreign-born population - Dominica (%)
Place of birth for the foreign-born population - Dominican Republic (%)
Place of birth for the foreign-born population - Grenada (%)
Place of birth for the foreign-born population - Haiti (%)
Place of birth for the foreign-born population - Jamaica (%)
Place of birth for the foreign-born population - St. Vincent and the Grenadines (%)
Place of birth for the foreign-born population - Trinidad and Tobago (%)
Place of birth for the foreign-born population - West Indies (%)
Place of birth for the foreign-born population - Other Caribbean (%)
Place of birth for the foreign-born population - Belize (%)
Place of birth for the foreign-born population - Costa Rica (%)
Place of birth for the foreign-born population - El Salvador (%)
Place of birth for the foreign-born population - Guatemala (%)
Place of birth for the foreign-born population - Honduras (%)
Place of birth for the foreign-born population - Mexico (%)
Place of birth for the foreign-born population - Nicaragua (%)
Place of birth for the foreign-born population - Panama (%)
Place of birth for the foreign-born population - Other Central America (%)
Place of birth for the foreign-born population - Argentina (%)
Place of birth for the foreign-born population - Bolivia (%)
Place of birth for the foreign-born population - Brazil (%)
Place of birth for the foreign-born population - Chile (%)
Place of birth for the foreign-born population - Colombia (%)
Place of birth for the foreign-born population - Ecuador (%)
Place of birth for the foreign-born population - Guyana (%)
Place of birth for the foreign-born population - Peru (%)
Place of birth for the foreign-born population - Uruguay (%)
Place of birth for the foreign-born population - Venezuela (%)
Place of birth for the foreign-born population - Other South America (%)
Place of birth for the foreign-born population - Canada (%)
Place of birth for the foreign-born population - Other Northern America (%)
Place of birth for the foreign-born population - Other (%)
Latest news about races in Camano, WA collected exclusively by city-data.com from local newspapers, TV, and radio stations
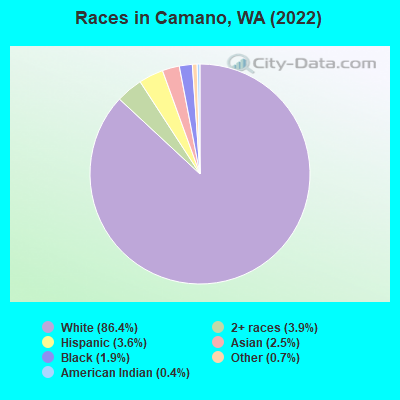
According to 2022 data, the most numerous races in Camano, WA are White alone (15,269 residents), Hispanic (632 residents), and Asian alone (442 residents). 94.3% of Camano residents speak English at home. 6.5% of Camano, WA residents are foreign-born (2.1% born in Europe, 2.0% born in Asia, 1.0% born in North America, 0.7% born in Africa), which is 132.2% less than the foreign-born rate of 15.0% across the entire state of Washington.
Race distribution in Camano
2000
2022
4,652,490 78.9% White alone
441,509 7.5% Hispanic
319,401 5.4% Asian alone
184,631 3.1% Black alone
175,926 3.0% Two or more races
85,396 1.4% American Indian alone
22,779 0.4% Native Hawaiian and Other Pacific Islander alone
11,989 0.2% Other race alone
4,941,456 63.5% White alone
1,093,313 14.0% Hispanic
755,832 9.7% Asian alone
523,448 6.7% Two or more races
299,537 3.8% Black alone
69,024 0.9% American Indian alone
52,231 0.7% Native Hawaiian and Other Pacific Islander alone
50,945 0.7% Other race alone
Income and house value in Camano Median household income in 2022 $97,284 White non-Hispanic householders
$95,246 Black householders
$79,284 Asian householders
$88,913 Two or more races householders
$98,459 Hispanic or Latino race householders
Median 2022 house value $712,982 White Non-Hispanic householders
$692,611 Black or African American householders
$697,614 American Indian or Alaska Native householders
$934,560 Asian householders
$580,749 Native Hawaiian and other Pacific Islander householders
$804,115 Some other race householders
$516,063 Two or more races householders
$603,265 Hispanic or Latino householders
Median age by race in Camano
58.7 Median age for White residents56.2 Males61.3 Females41.0 Median age for Black or African American residents42.1 Males24.8 Females85.6 Median age for American Indian / Alaska Native residents60.6 Males-833,333,332.5 Females69.2 Median age for Asian residents51.1 Males68.8 Females-681,388,011.9 Median age for Native Hawaiian / Pacific Islander residents-696,774,192.9 Males-666,666,666.0 Females81.2 Median age for Other race residents120.6 Males51.8 Females16.5 Median age for Two or more races residents16.6 Males21.7 Females57.6 Median age for White alone residents54.8 Males60.6 Females27.4 Median age for Hispanic or Latino residents55.5 Males26.2 Females
Owner/renter occupied households by race in Camano
House owners and renters - White residents 6,453 91.2% Owner occupied626 8.8% Renter occupiedHouse owners and renters - Black or African American residents 26 100.0% Owner occupiedHouse owners and renters - American Indian / Alaska Native residents 57 100.0% Owner occupiedHouse owners and renters - Asian residents 76 63.1% Owner occupied45 36.9% Renter occupiedHouse owners and renters - Other race residents 117 82.4% Owner occupied25 17.6% Renter occupiedHouse owners and renters - Two or more races residents 275 94.6% Owner occupied16 5.4% Renter occupiedHouse owners and renters - White alone residents 6,344 91.1% Owner occupied621 8.9% Renter occupiedHouse owners and renters - Hispanic or Latino residents 261 91.2% Owner occupied25 8.8% Renter occupied
Language usage in Camano
English speakers - Total 94.3% of residents of Camano speak English at home.
2.9% of residents speak Spanish at home 200 40.8% Speak English very well290 59.2% Speak English less than very well3.2% of residents speak other language at home 474 86.3% Speak English very well75 13.7% Speak English less than very well
English speakers - Born in the United States 97.4% of residents of Camano speak English at home.
0.9% of residents speak Spanish at home 38 65.5% Speak English very well20 34.5% Speak English less than very well1.1% of residents speak other language at home 70 100.0% Speak English very well
All residents speak only English at home
English speakers - Foreign-born 57.3% of residents of Camano speak English at home.
6.5% of residents speak Spanish at home 44 66.7% Speak English very well22 33.3% Speak English less than very well38.3% of residents speak other language at home 331 85.5% Speak English very well56 14.5% Speak English less than very well
White (Caucasian) - Speak only English Native:
98.1% (13,857)Foreign-born:
92.3% (537)
White (Caucasian) - Speak another language Native:
2.0% (282)Foreign-born:
11.7% (68)
Black or African American - Speak only English Native:
100.0% (183)Foreign-born:
12.8% (13)
Asian - Speak only English Native:
75.0% (102)Foreign-born:
16.3% (48)
Asian - Speak another language Native:
24.2% (33)Foreign-born:
83.7% (249)
Other race - Speak only English Native:
96.7% (196)Foreign-born:
26.7% (8)
Other race - Speak another language Native:
11.8% (24)Foreign-born:
73.1% (21)
Two or more races - Speak only English Native:
78.7% (729)Foreign-born:
42.9% (12)
Two or more races - Speak another language Native:
21.7% (201)Foreign-born:
51.1% (14)
White alone - Speak only English Native:
97.8% (13,963)Foreign-born:
86.4% (537)
White alone - Speak another language Native:
2.0% (292)Foreign-born:
12.7% (79)
Hispanic or Latino - Speak another language Native:
32.6% (170)Foreign-born:
98.8% (68)
Foreign-born residents in Camano 1,141 residents are foreign born (2.1% Europe , 2.0% Asia , 1.0% North America , 0.7% Africa ).
This city:
6.5%Washington:
14.9%
Marital status for residents in Camano Marital status - White (Caucasian) population 15 years and over
Males 23.2% Never married60.0% Now married0.4% Separated4.5% Widowed12.0% DivorcedFemales 14.4% Never married63.7% Now married1.6% Separated8.3% Widowed11.9% DivorcedWomen who gave birth in the past 12 months Now married:
100.0% (54)Unmarried:
0.0% (0)
Women who did not give birth in the past 12 months Now married:
56.5% (1,186)Unmarried:
43.5% (915)
Marital status - Black or African American population 15 years and over
Males 42.1% Never married57.9% Now married0.0% Separated0.0% Widowed0.0% DivorcedFemales 40.8% Never married59.2% Now married0.0% Separated0.0% Widowed0.0% DivorcedWomen who did not give birth in the past 12 months Now married:
47.4% (18)Unmarried:
52.6% (20)
Marital status - American Indian / Alaska Native population 15 years and over
Males 23.1% Never married50.0% Now married0.0% Separated0.0% Widowed26.9% DivorcedFemales 0.0% Never married44.0% Now married0.0% Separated0.0% Widowed56.0% DivorcedMarital status - Asian population 15 years and over
Males 9.3% Never married68.5% Now married0.0% Separated4.9% Widowed17.3% DivorcedFemales 7.0% Never married78.6% Now married0.0% Separated0.4% Widowed14.0% DivorcedWomen who gave birth in the past 12 months Now married:
100.0% (5)Unmarried:
0.0% (0)
Women who did not give birth in the past 12 months Now married:
63.5% (44)Unmarried:
36.5% (25)
Marital status - Other race population 15 years and over
Males 27.7% Never married59.0% Now married0.0% Separated0.0% Widowed13.3% DivorcedFemales 42.7% Never married41.6% Now married0.0% Separated0.0% Widowed15.7% DivorcedWomen who did not give birth in the past 12 months Now married:
0.0% (0)Unmarried:
100.0% (45)
Marital status - Two or more races population 15 years and over
Males 29.2% Never married64.0% Now married0.0% Separated6.8% Widowed0.0% DivorcedFemales 42.1% Never married53.6% Now married0.0% Separated0.0% Widowed4.4% DivorcedWomen who did not give birth in the past 12 months Now married:
13.3% (20)Unmarried:
86.7% (133)
Marital status - White alone, not Hispanic / Latino population 15 years and over
Males 23.3% Never married59.9% Now married0.2% Separated4.5% Widowed12.0% DivorcedFemales 14.7% Never married63.4% Now married1.7% Separated8.3% Widowed11.9% DivorcedWomen who gave birth in the past 12 months Now married:
100.0% (57)Unmarried:
0.0% (0)
Women who did not give birth in the past 12 months Now married:
55.3% (1,184)Unmarried:
44.7% (958)
Marital status - Hispanic or Latino population 15 years and over
Males 3.6% Never married79.3% Now married7.2% Separated0.0% Widowed9.9% DivorcedFemales 27.3% Never married60.3% Now married0.0% Separated3.0% Widowed9.4% DivorcedWomen who did not give birth in the past 12 months Now married:
46.3% (66)Unmarried:
53.7% (77)
Ancestries in Camano
875 11.6% English
863 11.4% German
636 8.4% Irish
603 8.0% American
461 6.1% European
440 5.8% Norwegian
305 4.0% Swedish
142 1.9% Northern European
138 1.8% Scandinavian
130 1.7% Polish
126 1.7% Scottish
120 1.6% Italian
87 1.2% British
86 1.1% Dutch
76 1.0% Czech
63 0.8% French
59 0.8% Finnish
59 0.8% Welsh
51 0.7% Ukrainian
37 0.5% Kenyan
29 0.4% Maltese
29 0.4% South African
28 0.4% Eastern European
27 0.4% Danish
26 0.3% Hungarian
26 0.3% Alsatian
24 0.3% French Canadian
21 0.3% Scotch-Irish
17 0.2% Latvian
17 0.2% Portuguese
17 0.2% Russian
17 0.2% Nigerian
14 0.2% Swiss
9 0.1% Canadian
8 0.1% Iranian
6 0.08% Lithuanian
5 0.07% Arab
4 0.05% Czechoslovakian
Geographical mobility in Camano
Same house 1 year ago 13,458 89.4% White (Caucasian)
279 92.6% Black or African American
58 69.2% American Indian / Alaska Native
440 98.4% Asian
13 100.0% Native Hawaiian / Pacific Islander
183 80.1% Other race
1,149 98.9% Two or more races
13,673 89.8% White alone, not Hispanic / Latino
526 83.4% Hispanic or Latino
Moved within same county 231 1.5% White / Caucasian
38 16.5% Other race
35 3.0% Two or more races
230 1.5% White alone, not Hispanic / Latino
63 10.1% Hispanic or Latino
Moved within same state 1,090 7.2% White / Caucasian
26 31.1% American Indian / Alaska Native
2 0.2% Two or more races
1,086 7.1% White alone, not Hispanic / Latino
45 7.1% Hispanic or Latino
Moved from different state 281 1.9% White / Caucasian
276 1.8% White alone, not Hispanic / Latino
Moved from abroad 14 0.1% White
44 14.5% Black or African American
14 0.1% White alone, not Hispanic / Latino
Children Nativity (place of birth) in Camano
Children under 6 years - Living with two parents Both parents native 537 100.0% NativeBoth parents foreign-born 7 100.0% NativeOne native, one foreign-born parent 31 100.0% NativeChildren under 6 years - Living with one parent Native parent 155 100.0% NativeChildren 6 to 17 years - Living with two parents Both parents native 1,224 100.0% NativeBoth parents foreign-born 11 100.0% NativeOne native, one foreign-born parent 123 100.0% NativeChildren 6 to 17 years - Living with one parent Native parent 567 100.0% NativeForeign-born parent 23 50.6% Native23 49.4% Foreign-born
Grandparents responsible for own grandchildren in Camano
Grandparents (30 to 59 years) White / Caucasian 60 100.0% Not responsible for grandchildrenWhite alone, not Hispanic / Latino 66 100.0% Not responsible for grandchildrenGrandparents (60 years and over) White / Caucasian 55 31.7% Responsible for grandchildren119 68.3% Not responsible for grandchildrenWhite alone, not Hispanic / Latino 57 31.4% Responsible for grandchildren124 68.6% Not responsible for grandchildren