Races in Bull Mountain, Oregon (OR) Detailed Stats
Data:
Races - White alone (%)
Races - White alone (% change since 2000)
Races - Black alone (%)
Races - Black alone (% change since 2000)
Races - American Indian alone (%)
Races - American Indian alone (% change since 2000)
Races - Asian alone (%)
Races - Asian alone (% change since 2000)
Races - Hispanic (%)
Races - Hispanic (% change since 2000)
Races - Native Hawaiian and Other Pacific Islander alone (%)
Races - Native Hawaiian and Other Pacific Islander alone (% change since 2000)
Races - Two or more races(%)
Races - Two or more races(% change since 2000)
Races - Other race alone (%)
Races - Other race alone (% change since 2000)
Racial diversity
Place of birth - Born in state of residence (%)
Place of birth - Born in state of residence (%) - White
Place of birth - Born in state of residence (%) - Black or African American
Place of birth - Born in state of residence (%) - Asian
Place of birth - Born in state of residence (%) - Hispanic or Latino
Place of birth - Born in state of residence (%) - American Indian and Alaska Native
Place of birth - Born in state of residence (%) - Multirace
Place of birth - Born in state of residence (%) - Other Race
Place of birth - Born in other state (%)
Place of birth - Born in other state (%) - White
Place of birth - Born in other state (%) - Black or African American
Place of birth - Born in other state (%) - Asian
Place of birth - Born in other state (%) - Hispanic or Latino
Place of birth - Born in other state (%) - American Indian and Alaska Native
Place of birth - Born in other state (%) - Multirace
Place of birth - Born in other state (%) - Other Race
Place of birth - Native, outside of US (%)
Place of birth - Native, outside of US (%) - White
Place of birth - Native, outside of US (%) - Black or African American
Place of birth - Native, outside of US (%) - Asian
Place of birth - Native, outside of US (%) - Hispanic or Latino
Place of birth - Native, outside of US (%) - American Indian and Alaska Native
Place of birth - Native, outside of US (%) - Multirace
Place of birth - Native, outside of US (%) - Other Race
Place of birth - Foreign born (%)
Place of birth - Foreign born (%) - White
Place of birth - Foreign born (%) - Black or African American
Place of birth - Foreign born (%) - Asian
Place of birth - Foreign born (%) - Hispanic or Latino
Place of birth - Foreign born (%) - American Indian and Alaska Native
Place of birth - Foreign born (%) - Multirace
Place of birth - Foreign born (%) - Other Race
Residents speaking English at home (%)
Residents speaking English at home - Born in the United States (%)
Residents speaking English at home - Native, born elsewhere (%)
Residents speaking English at home - Foreign born (%)
Residents speaking Spanish at home (%)
Residents speaking Spanish at home - Born in the United States (%)
Residents speaking Spanish at home - Native, born elsewhere (%)
Residents speaking Spanish at home - Foreign born (%)
Residents speaking other language at home (%)
Residents speaking other language at home - Born in the United States (%)
Residents speaking other language at home - Native, born elsewhere (%)
Residents speaking other language at home - Foreign born (%)
Marital status - Never married (%)
Marital status - Now married (%)
Marital status - Separated (%)
Marital status - Widowed (%)
Marital status - Divorced (%)
Ancestries Reported - Arab (%)
Ancestries Reported - Czech (%)
Ancestries Reported - Danish (%)
Ancestries Reported - Dutch (%)
Ancestries Reported - English (%)
Ancestries Reported - French (%)
Ancestries Reported - French Canadian (%)
Ancestries Reported - German (%)
Ancestries Reported - Greek (%)
Ancestries Reported - Hungarian (%)
Ancestries Reported - Irish (%)
Ancestries Reported - Italian (%)
Ancestries Reported - Lithuanian (%)
Ancestries Reported - Norwegian (%)
Ancestries Reported - Polish (%)
Ancestries Reported - Portuguese (%)
Ancestries Reported - Russian (%)
Ancestries Reported - Scotch-Irish (%)
Ancestries Reported - Scottish (%)
Ancestries Reported - Slovak (%)
Ancestries Reported - Subsaharan African (%)
Ancestries Reported - Swedish (%)
Ancestries Reported - Swiss (%)
Ancestries Reported - Ukrainian (%)
Ancestries Reported - United States (%)
Ancestries Reported - Welsh (%)
Ancestries Reported - West Indian (%)
Ancestries Reported - Other (%)
Geographical mobility - Same house 1 year ago (%)
Geographical mobility - Same house 1 year ago (%) - White
Geographical mobility - Same house 1 year ago (%) - Black or African American
Geographical mobility - Same house 1 year ago (%) - Asian
Geographical mobility - Same house 1 year ago (%) - Hispanic or Latino
Geographical mobility - Same house 1 year ago (%) - American Indian and Alaska Native
Geographical mobility - Same house 1 year ago (%) - Multirace
Geographical mobility - Same house 1 year ago (%) - Other Race
Geographical mobility - Moved within same county (%)
Geographical mobility - Moved within same county (%) - White
Geographical mobility - Moved within same county (%) - Black or African American
Geographical mobility - Moved within same county (%) - Asian
Geographical mobility - Moved within same county (%) - Hispanic or Latino
Geographical mobility - Moved within same county (%) - American Indian and Alaska Native
Geographical mobility - Moved within same county (%) - Multirace
Geographical mobility - Moved within same county (%) - Other Race
Geographical mobility - Moved from different county within same state (%)
Geographical mobility - Moved from different county within same state (%) - White
Geographical mobility - Moved from different county within same state (%) - Black or African American
Geographical mobility - Moved from different county within same state (%) - Asian
Geographical mobility - Moved from different county within same state (%) - Hispanic or Latino
Geographical mobility - Moved from different county within same state (%) - American Indian and Alaska Native
Geographical mobility - Moved from different county within same state (%) - Multirace
Geographical mobility - Moved from different county within same state (%) - Other Race
Geographical mobility - Moved from different state (%)
Geographical mobility - Moved from different state (%) - White
Geographical mobility - Moved from different state (%) - Black or African American
Geographical mobility - Moved from different state (%) - Asian
Geographical mobility - Moved from different state (%) - Hispanic or Latino
Geographical mobility - Moved from different state (%) - American Indian and Alaska Native
Geographical mobility - Moved from different state (%) - Multirace
Geographical mobility - Moved from different state (%) - Other Race
Geographical mobility - Moved from abroad (%)
Geographical mobility - Moved from abroad (%) - White
Geographical mobility - Moved from abroad (%) - Black or African American
Geographical mobility - Moved from abroad (%) - Asian
Geographical mobility - Moved from abroad (%) - Hispanic or Latino
Geographical mobility - Moved from abroad (%) - American Indian and Alaska Native
Geographical mobility - Moved from abroad (%) - Multirace
Geographical mobility - Moved from abroad (%) - Other Race
Place of birth for the foreign-born population - Ireland (%)
Place of birth for the foreign-born population - Denmark (%)
Place of birth for the foreign-born population - Norway (%)
Place of birth for the foreign-born population - Sweden (%)
Place of birth for the foreign-born population - United Kingdom (%)
Place of birth for the foreign-born population - England (%)
Place of birth for the foreign-born population - Scotland (%)
Place of birth for the foreign-born population - Other Northern Europe (%)
Place of birth for the foreign-born population - Austria (%)
Place of birth for the foreign-born population - Belgium (%)
Place of birth for the foreign-born population - France (%)
Place of birth for the foreign-born population - Germany (%)
Place of birth for the foreign-born population - Netherlands (%)
Place of birth for the foreign-born population - Switzerland (%)
Place of birth for the foreign-born population - Other Western Europe (%)
Place of birth for the foreign-born population - Greece (%)
Place of birth for the foreign-born population - Italy (%)
Place of birth for the foreign-born population - Portugal (%)
Place of birth for the foreign-born population - Spain (%)
Place of birth for the foreign-born population - Other Southern Europe (%)
Place of birth for the foreign-born population - Albania (%)
Place of birth for the foreign-born population - Belarus (%)
Place of birth for the foreign-born population - Bosnia and Herzegovina (%)
Place of birth for the foreign-born population - Bulgaria (%)
Place of birth for the foreign-born population - Croatia (%)
Place of birth for the foreign-born population - Czechoslovakia (%)
Place of birth for the foreign-born population - Hungary (%)
Place of birth for the foreign-born population - Latvia (%)
Place of birth for the foreign-born population - Lithuania (%)
Place of birth for the foreign-born population - North Macedonia (Macedonia) (%)
Place of birth for the foreign-born population - Moldova (%)
Place of birth for the foreign-born population - Poland (%)
Place of birth for the foreign-born population - Romania (%)
Place of birth for the foreign-born population - Russia (%)
Place of birth for the foreign-born population - Serbia (%)
Place of birth for the foreign-born population - Ukraine (%)
Place of birth for the foreign-born population - Other Eastern Europe (%)
Place of birth for the foreign-born population - China (%)
Place of birth for the foreign-born population - Hong Kong (%)
Place of birth for the foreign-born population - Taiwan (%)
Place of birth for the foreign-born population - Japan (%)
Place of birth for the foreign-born population - Korea (%)
Place of birth for the foreign-born population - Other Eastern Asia (%)
Place of birth for the foreign-born population - Afghanistan (%)
Place of birth for the foreign-born population - Bangladesh (%)
Place of birth for the foreign-born population - India (%)
Place of birth for the foreign-born population - Iran (%)
Place of birth for the foreign-born population - Kazakhstan (%)
Place of birth for the foreign-born population - Nepal (%)
Place of birth for the foreign-born population - Pakistan (%)
Place of birth for the foreign-born population - Sri Lanka (%)
Place of birth for the foreign-born population - Uzbekistan (%)
Place of birth for the foreign-born population - Other South Central Asia (%)
Place of birth for the foreign-born population - Burma (%)
Place of birth for the foreign-born population - Cambodia (%)
Place of birth for the foreign-born population - Indonesia (%)
Place of birth for the foreign-born population - Laos (%)
Place of birth for the foreign-born population - Malaysia (%)
Place of birth for the foreign-born population - Philippines (%)
Place of birth for the foreign-born population - Singapore (%)
Place of birth for the foreign-born population - Thailand (%)
Place of birth for the foreign-born population - Vietnam (%)
Place of birth for the foreign-born population - Other South Eastern Asia (%)
Place of birth for the foreign-born population - Armenia (%)
Place of birth for the foreign-born population - Iraq (%)
Place of birth for the foreign-born population - Israel (%)
Place of birth for the foreign-born population - Jordan (%)
Place of birth for the foreign-born population - Kuwait (%)
Place of birth for the foreign-born population - Lebanon (%)
Place of birth for the foreign-born population - Saudi Arabia (%)
Place of birth for the foreign-born population - Syria (%)
Place of birth for the foreign-born population - Turkey (%)
Place of birth for the foreign-born population - Yemen (%)
Place of birth for the foreign-born population - Other Western Asia (%)
Place of birth for the foreign-born population - Eritrea (%)
Place of birth for the foreign-born population - Ethiopia (%)
Place of birth for the foreign-born population - Kenya (%)
Place of birth for the foreign-born population - Somalia (%)
Place of birth for the foreign-born population - Uganda (%)
Place of birth for the foreign-born population - Zimbabwe (%)
Place of birth for the foreign-born population - Other Eastern Africa (%)
Place of birth for the foreign-born population - Cameroon (%)
Place of birth for the foreign-born population - Congo (%)
Place of birth for the foreign-born population - Democratic Republic of Congo (Zaire) (%)
Place of birth for the foreign-born population - Other Middle Africa (%)
Place of birth for the foreign-born population - Egypt (%)
Place of birth for the foreign-born population - Morocco (%)
Place of birth for the foreign-born population - Sudan (%)
Place of birth for the foreign-born population - Other Northern Africa (%)
Place of birth for the foreign-born population - South Africa (%)
Place of birth for the foreign-born population - Other Southern Africa (%)
Place of birth for the foreign-born population - Cabo Verde (%)
Place of birth for the foreign-born population - Ghana (%)
Place of birth for the foreign-born population - Liberia (%)
Place of birth for the foreign-born population - Nigeria (%)
Place of birth for the foreign-born population - Senegal (%)
Place of birth for the foreign-born population - Sierra Leone (%)
Place of birth for the foreign-born population - Other Western Africa (%)
Place of birth for the foreign-born population - Australia (%)
Place of birth for the foreign-born population - New Zealand (%)
Place of birth for the foreign-born population - Fiji (%)
Place of birth for the foreign-born population - Micronesia (%)
Place of birth for the foreign-born population - Bahamas (%)
Place of birth for the foreign-born population - Barbados (%)
Place of birth for the foreign-born population - Cuba (%)
Place of birth for the foreign-born population - Dominica (%)
Place of birth for the foreign-born population - Dominican Republic (%)
Place of birth for the foreign-born population - Grenada (%)
Place of birth for the foreign-born population - Haiti (%)
Place of birth for the foreign-born population - Jamaica (%)
Place of birth for the foreign-born population - St. Vincent and the Grenadines (%)
Place of birth for the foreign-born population - Trinidad and Tobago (%)
Place of birth for the foreign-born population - West Indies (%)
Place of birth for the foreign-born population - Other Caribbean (%)
Place of birth for the foreign-born population - Belize (%)
Place of birth for the foreign-born population - Costa Rica (%)
Place of birth for the foreign-born population - El Salvador (%)
Place of birth for the foreign-born population - Guatemala (%)
Place of birth for the foreign-born population - Honduras (%)
Place of birth for the foreign-born population - Mexico (%)
Place of birth for the foreign-born population - Nicaragua (%)
Place of birth for the foreign-born population - Panama (%)
Place of birth for the foreign-born population - Other Central America (%)
Place of birth for the foreign-born population - Argentina (%)
Place of birth for the foreign-born population - Bolivia (%)
Place of birth for the foreign-born population - Brazil (%)
Place of birth for the foreign-born population - Chile (%)
Place of birth for the foreign-born population - Colombia (%)
Place of birth for the foreign-born population - Ecuador (%)
Place of birth for the foreign-born population - Guyana (%)
Place of birth for the foreign-born population - Peru (%)
Place of birth for the foreign-born population - Uruguay (%)
Place of birth for the foreign-born population - Venezuela (%)
Place of birth for the foreign-born population - Other South America (%)
Place of birth for the foreign-born population - Canada (%)
Place of birth for the foreign-born population - Other Northern America (%)
Place of birth for the foreign-born population - Other (%)
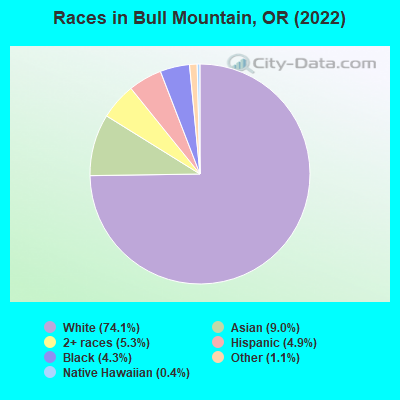
According to 2022 data, the most numerous races in Bull Mountain, OR are White alone (6,911 residents), Hispanic (459 residents), and Two or more races (490 residents). 82.7% of Bull Mountain residents speak English at home.
Race distribution in Bull Mountain 6,911 74.1% White alone 838 9.0% Asian alone 490 5.3% Two or more races 459 4.9% Hispanic 401 4.3% Black alone 106 1.1% Other race alone 36 0.4% Native Hawaiian and Other
2000 2022
2,857,616 83.5% White alone 275,314 8.0% Hispanic 100,333 2.9% Asian alone 82,733 2.4% Two or more races 53,325 1.6% Black alone 40,130 1.2% American Indian alone 7,398 0.2% Native Hawaiian and Other 4,550 0.1% Other race alone
3,037,571 71.6% White alone 609,538 14.4% Hispanic 252,744 6.0% Two or more races 191,283 4.5% Asian alone 78,228 1.8% Black alone 29,399 0.7% American Indian alone 25,731 0.6% Other race alone 15,643 0.4% Native Hawaiian and Other
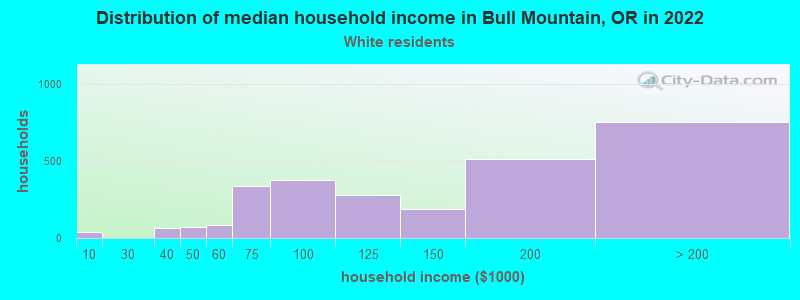
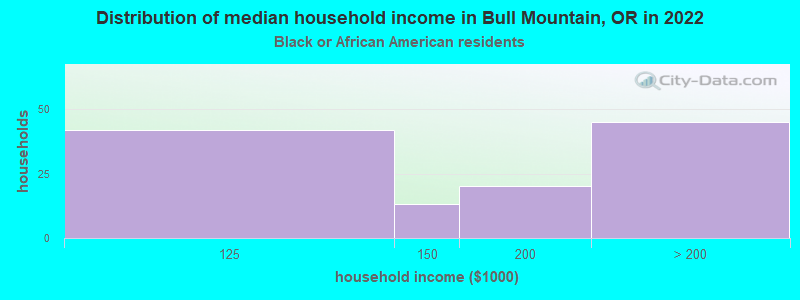
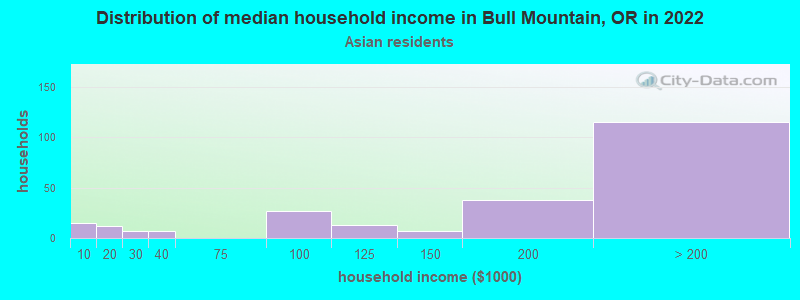
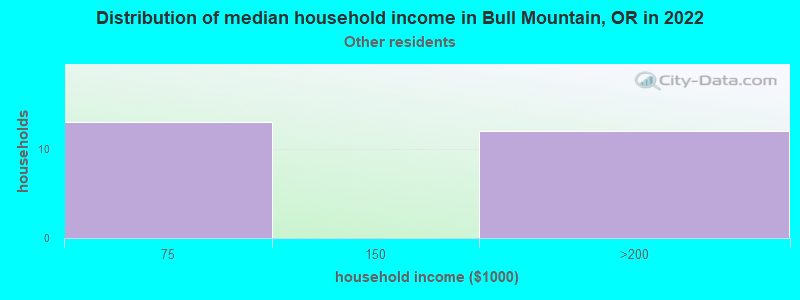
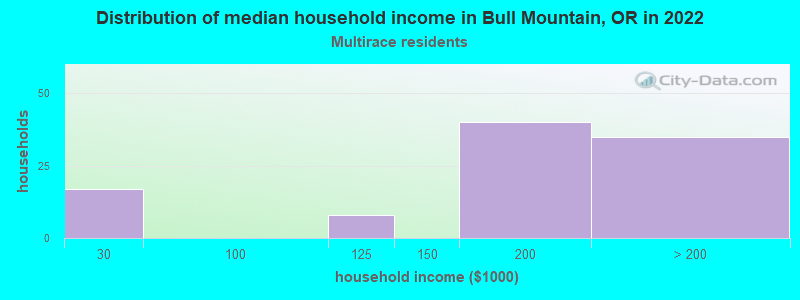
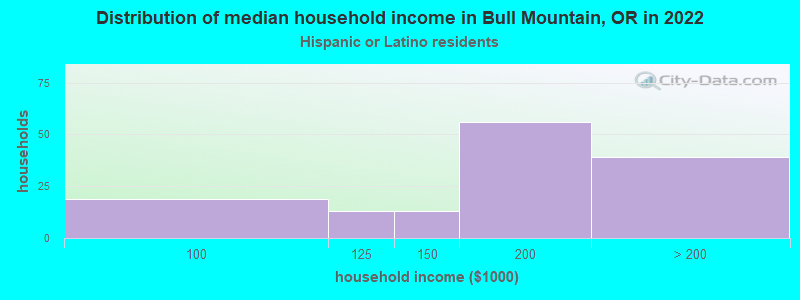
Income and house value in Bull Mountain Median household income in 2022 $137,493 White non-Hispanic householders$155,999 Black householders$180,939 Asian householders$167,287 Two or more races householders$148,146 Hispanic or Latino race householders
Median age by race in Bull Mountain
43.9 Median age for White residents42.7 44.6 40.8 Median age for Black or African American residents41.0 40.4 -740,740,740.0 Median age for American Indian / Alaska Native residents-838,647,342.2 -658,119,657.5 41.6 Median age for Asian residents42.3 38.8 23.6 Median age for Native Hawaiian / Pacific Islander residents-476,923,076.4 31.3 33.1 Median age for Other race residents24.7 32.6 24.8 Median age for Two or more races residents22.8 35.8 43.3 Median age for White alone residents42.2 43.9 35.3 Median age for Hispanic or Latino residents35.3 37.4
Owner/renter occupied households by race in Bull Mountain
House owners and renters - White residents 2,210 80.9% Owner occupied521 19.1% Renter occupiedHouse owners and renters - Black or African American residents 76 75.8% Owner occupied24 24.2% Renter occupiedHouse owners and renters - Asian residents 271 100.0% Owner occupiedHouse owners and renters - Native Hawaiian / Pacific Islander residents 11 100.0% Renter occupiedHouse owners and renters - Other race residents 12 55.2% Owner occupied10 44.8% Renter occupiedHouse owners and renters - Two or more races residents 96 100.0% Owner occupiedHouse owners and renters - White alone residents 2,137 80.2% Owner occupied526 19.8% Renter occupiedHouse owners and renters - Hispanic or Latino residents 123 85.3% Owner occupied21 14.7% Renter occupied
Language usage in Bull Mountain
English speakers - Total 82.7% of residents of Bull Mountain speak English at home.
2.0% of residents speak Spanish at home 140 79.1% Speak English very well37 20.9% Speak English less than very well14.1% of residents speak other language at home 881 69.3% Speak English very well391 30.7% Speak English less than very well
English speakers - Born in the United States 94.3% of residents of Bull Mountain speak English at home.
2.3% of residents speak Spanish at home 83 100.0% Speak English very well2.4% of residents speak other language at home 90 100.0% Speak English very well
English speakers - Native, born elsewhere 43.9% of residents of Bull Mountain speak English at home.
102.3% of residents speak other language at home 100 74.1% Speak English very well35 25.9% Speak English less than very well
English speakers - Foreign-born 17.4% of residents of Bull Mountain speak English at home.
7.2% of residents speak Spanish at home 45 55.6% Speak English very well36 44.4% Speak English less than very well71.5% of residents speak other language at home 547 68.4% Speak English very well253 31.6% Speak English less than very well
White (Caucasian) - Speak only English Native:
96.7% (6,088)Foreign-born:
25.5% (96)
White (Caucasian) - Speak another language Native:
3.5% (220)Foreign-born:
74.2% (280)
Black or African American - Speak another language Native:
6.1% (24)Foreign-born:
100.0% (32)
Asian - Speak only English Native:
41.6% (145)Foreign-born:
16.1% (75)
Asian - Speak another language Native:
60.0% (209)Foreign-born:
83.0% (384)
Other race - Speak only English Native:
69.4% (126)Foreign-born:
87.6% (16)
White alone - Speak only English Native:
95.5% (5,969)Foreign-born:
25.5% (107)
White alone - Speak another language Native:
4.7% (293)Foreign-born:
74.4% (313)
Hispanic or Latino - Speak only English Native:
76.3% (258)Foreign-born:
13.2% (13)
Hispanic or Latino - Speak another language Native:
19.3% (65)Foreign-born:
85.3% (82)
Foreign-born residents in Bull Mountain
Marital status for residents in Bull Mountain Marital status - White (Caucasian) population 15 years and over
Males 30.1% Never married66.7% Now married0.0% Separated0.2% Widowed3.0% DivorcedFemales 18.6% Never married59.8% Now married0.6% Separated3.1% Widowed17.9% DivorcedWomen who gave birth in the past 12 months Now married:
100.0% (32)Unmarried:
0.0% (0)
Women who did not give birth in the past 12 months Now married:
55.5% (751)Unmarried:
44.5% (603)
Marital status - Black or African American population 15 years and over
Males 18.3% Never married73.1% Now married0.0% Separated8.6% Widowed0.0% DivorcedFemales 18.5% Never married72.2% Now married0.0% Separated0.0% Widowed9.3% DivorcedWomen who gave birth in the past 12 months Now married:
100.0% (22)Unmarried:
0.0% (0)
Women who did not give birth in the past 12 months Now married:
65.5% (41)Unmarried:
34.5% (21)
Marital status - Asian population 15 years and over
Males 27.8% Never married72.2% Now married0.0% Separated0.0% Widowed0.0% DivorcedFemales 21.4% Never married69.4% Now married2.5% Separated0.0% Widowed6.7% DivorcedWomen who gave birth in the past 12 months Now married:
100.0% (18)Unmarried:
0.0% (0)
Women who did not give birth in the past 12 months Now married:
59.1% (146)Unmarried:
40.9% (101)
Marital status - Other race population 15 years and over
Males 63.2% Never married36.8% Now married0.0% Separated0.0% Widowed0.0% DivorcedFemales 34.0% Never married66.0% Now married0.0% Separated0.0% Widowed0.0% DivorcedWomen who did not give birth in the past 12 months Now married:
0.0% (0)Unmarried:
100.0% (23)
Marital status - Two or more races population 15 years and over
Males 67.6% Never married32.4% Now married0.0% Separated0.0% Widowed0.0% DivorcedFemales 22.4% Never married77.6% Now married0.0% Separated0.0% Widowed0.0% DivorcedWomen who did not give birth in the past 12 months Now married:
61.1% (71)Unmarried:
38.9% (45)
Marital status - White alone, not Hispanic / Latino population 15 years and over
Males 30.0% Never married66.6% Now married0.0% Separated0.2% Widowed3.2% DivorcedFemales 18.4% Never married60.0% Now married0.6% Separated2.7% Widowed18.3% DivorcedWomen who gave birth in the past 12 months Now married:
100.0% (34)Unmarried:
0.0% (0)
Women who did not give birth in the past 12 months Now married:
55.6% (774)Unmarried:
44.4% (619)
Marital status - Hispanic or Latino population 15 years and over
Males 36.5% Never married63.5% Now married0.0% Separated0.0% Widowed0.0% DivorcedFemales 13.2% Never married76.2% Now married0.0% Separated10.6% Widowed0.0% DivorcedWomen who did not give birth in the past 12 months Now married:
75.6% (64)Unmarried:
24.4% (21)
Ancestries in Bull Mountain
555 12.4% German442 9.9% English285 6.4% European237 5.3% American217 4.9% Jordanian189 4.2% Irish97 2.2% Danish97 2.2% Israeli96 2.2% Scandinavian82 1.8% Northern European73 1.6% Italian69 1.5% Norwegian63 1.4% Haitian53 1.2% Romanian48 1.1% Finnish43 1.0% Czechoslovakian37 0.8% Canadian37 0.8% Iranian37 0.8% Polish34 0.8% Portuguese32 0.7% Palestinian28 0.6% Swedish24 0.5% Dutch20 0.4% Swiss19 0.4% Scottish17 0.4% Iraqi16 0.4% Russian16 0.4% Ukrainian12 0.3% Austrian10 0.2% British10 0.2% Eastern European8 0.2% French7 0.2% French Canadian6 0.1% Moroccan4 0.09% Brazilian4 0.09% African
Children Nativity (place of birth) in Bull Mountain
Children under 6 years - Living with two parents Both parents native 384 100.0% NativeBoth parents foreign-born 33 100.0% NativeOne native, one foreign-born parent 27 100.0% NativeChildren 6 to 17 years - Living with two parents Both parents native 1,150 99.9% Native1 0.1% Foreign-bornBoth parents foreign-born 228 89.0% Native28 11.0% Foreign-bornOne native, one foreign-born parent 177 100.0% NativeChildren 6 to 17 years - Living with one parent Native parent 192 100.0% NativeForeign-born parent 14 51.3% Native13 48.7% Foreign-born
Grandparents responsible for own grandchildren in Bull Mountain
Grandparents (30 to 59 years) White / Caucasian 11 100.0% Responsible for grandchildrenWhite alone, not Hispanic / Latino 12 100.0% Responsible for grandchildrenGrandparents (60 years and over) White / Caucasian 3 10.6% Responsible for grandchildren26 89.4% Not responsible for grandchildrenWhite alone, not Hispanic / Latino 3 9.3% Responsible for grandchildren31 90.7% Not responsible for grandchildren