Races in Brownwood, Texas (TX) Detailed Stats
Data:
Races - White alone (%)
Races - White alone (% change since 2000)
Races - Black alone (%)
Races - Black alone (% change since 2000)
Races - American Indian alone (%)
Races - American Indian alone (% change since 2000)
Races - Asian alone (%)
Races - Asian alone (% change since 2000)
Races - Hispanic (%)
Races - Hispanic (% change since 2000)
Races - Native Hawaiian and Other Pacific Islander alone (%)
Races - Native Hawaiian and Other Pacific Islander alone (% change since 2000)
Races - Two or more races(%)
Races - Two or more races(% change since 2000)
Races - Other race alone (%)
Races - Other race alone (% change since 2000)
Racial diversity
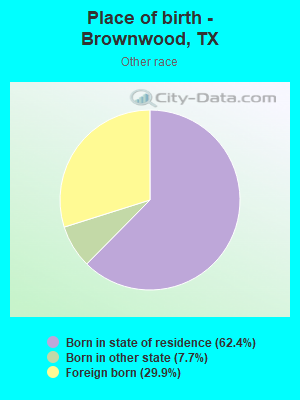
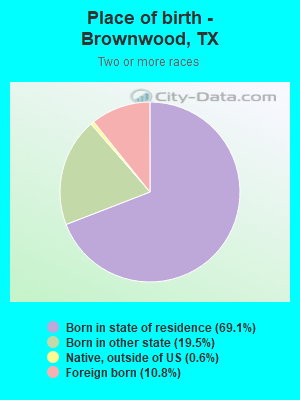
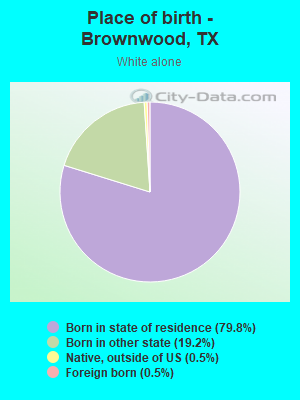
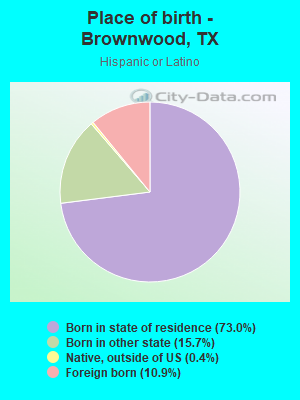
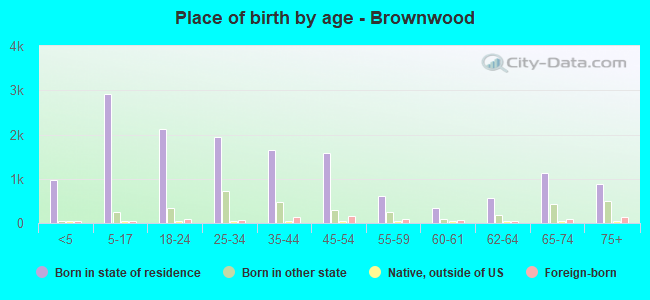
Place of birth - Born in state of residence (%)
Place of birth - Born in state of residence (%) - White
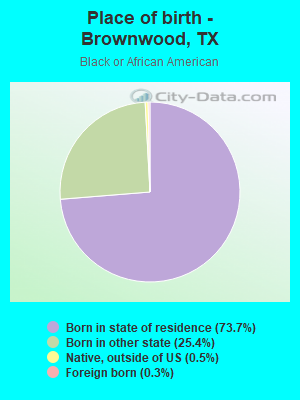
Place of birth - Born in state of residence (%) - Black or African American
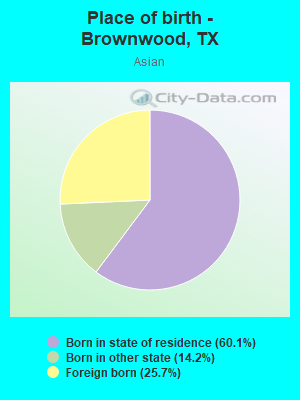
Place of birth - Born in state of residence (%) - Asian
Place of birth - Born in state of residence (%) - Hispanic or Latino
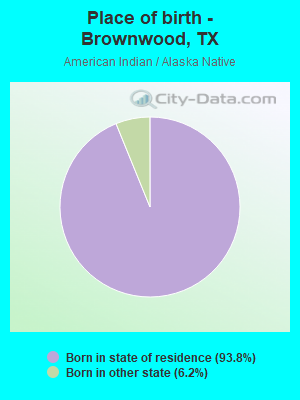
Place of birth - Born in state of residence (%) - American Indian and Alaska Native
Place of birth - Born in state of residence (%) - Multirace
Place of birth - Born in state of residence (%) - Other Race
Place of birth - Born in other state (%)
Place of birth - Born in other state (%) - White
Place of birth - Born in other state (%) - Black or African American
Place of birth - Born in other state (%) - Asian
Place of birth - Born in other state (%) - Hispanic or Latino
Place of birth - Born in other state (%) - American Indian and Alaska Native
Place of birth - Born in other state (%) - Multirace
Place of birth - Born in other state (%) - Other Race
Place of birth - Native, outside of US (%)
Place of birth - Native, outside of US (%) - White
Place of birth - Native, outside of US (%) - Black or African American
Place of birth - Native, outside of US (%) - Asian
Place of birth - Native, outside of US (%) - Hispanic or Latino
Place of birth - Native, outside of US (%) - American Indian and Alaska Native
Place of birth - Native, outside of US (%) - Multirace
Place of birth - Native, outside of US (%) - Other Race
Place of birth - Foreign born (%)
Place of birth - Foreign born (%) - White
Place of birth - Foreign born (%) - Black or African American
Place of birth - Foreign born (%) - Asian
Place of birth - Foreign born (%) - Hispanic or Latino
Place of birth - Foreign born (%) - American Indian and Alaska Native
Place of birth - Foreign born (%) - Multirace
Place of birth - Foreign born (%) - Other Race
Residents speaking English at home (%)
Residents speaking English at home - Born in the United States (%)
Residents speaking English at home - Native, born elsewhere (%)
Residents speaking English at home - Foreign born (%)
Residents speaking Spanish at home (%)
Residents speaking Spanish at home - Born in the United States (%)
Residents speaking Spanish at home - Native, born elsewhere (%)
Residents speaking Spanish at home - Foreign born (%)
Residents speaking other language at home (%)
Residents speaking other language at home - Born in the United States (%)
Residents speaking other language at home - Native, born elsewhere (%)
Residents speaking other language at home - Foreign born (%)
Marital status - Never married (%)
Marital status - Now married (%)
Marital status - Separated (%)
Marital status - Widowed (%)
Marital status - Divorced (%)
Ancestries Reported - Arab (%)
Ancestries Reported - Czech (%)
Ancestries Reported - Danish (%)
Ancestries Reported - Dutch (%)
Ancestries Reported - English (%)
Ancestries Reported - French (%)
Ancestries Reported - French Canadian (%)
Ancestries Reported - German (%)
Ancestries Reported - Greek (%)
Ancestries Reported - Hungarian (%)
Ancestries Reported - Irish (%)
Ancestries Reported - Italian (%)
Ancestries Reported - Lithuanian (%)
Ancestries Reported - Norwegian (%)
Ancestries Reported - Polish (%)
Ancestries Reported - Portuguese (%)
Ancestries Reported - Russian (%)
Ancestries Reported - Scotch-Irish (%)
Ancestries Reported - Scottish (%)
Ancestries Reported - Slovak (%)
Ancestries Reported - Subsaharan African (%)
Ancestries Reported - Swedish (%)
Ancestries Reported - Swiss (%)
Ancestries Reported - Ukrainian (%)
Ancestries Reported - United States (%)
Ancestries Reported - Welsh (%)
Ancestries Reported - West Indian (%)
Ancestries Reported - Other (%)
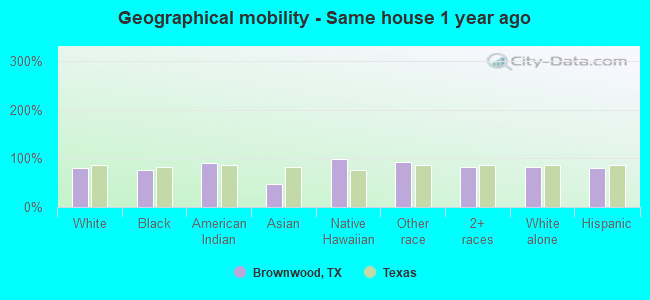
Geographical mobility - Same house 1 year ago (%)
Geographical mobility - Same house 1 year ago (%) - White
Geographical mobility - Same house 1 year ago (%) - Black or African American
Geographical mobility - Same house 1 year ago (%) - Asian
Geographical mobility - Same house 1 year ago (%) - Hispanic or Latino
Geographical mobility - Same house 1 year ago (%) - American Indian and Alaska Native
Geographical mobility - Same house 1 year ago (%) - Multirace
Geographical mobility - Same house 1 year ago (%) - Other Race
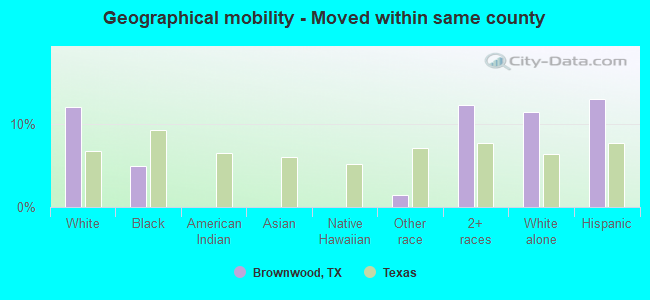
Geographical mobility - Moved within same county (%)
Geographical mobility - Moved within same county (%) - White
Geographical mobility - Moved within same county (%) - Black or African American
Geographical mobility - Moved within same county (%) - Asian
Geographical mobility - Moved within same county (%) - Hispanic or Latino
Geographical mobility - Moved within same county (%) - American Indian and Alaska Native
Geographical mobility - Moved within same county (%) - Multirace
Geographical mobility - Moved within same county (%) - Other Race
Geographical mobility - Moved from different county within same state (%)
Geographical mobility - Moved from different county within same state (%) - White
Geographical mobility - Moved from different county within same state (%) - Black or African American
Geographical mobility - Moved from different county within same state (%) - Asian
Geographical mobility - Moved from different county within same state (%) - Hispanic or Latino
Geographical mobility - Moved from different county within same state (%) - American Indian and Alaska Native
Geographical mobility - Moved from different county within same state (%) - Multirace
Geographical mobility - Moved from different county within same state (%) - Other Race
Geographical mobility - Moved from different state (%)
Geographical mobility - Moved from different state (%) - White
Geographical mobility - Moved from different state (%) - Black or African American
Geographical mobility - Moved from different state (%) - Asian
Geographical mobility - Moved from different state (%) - Hispanic or Latino
Geographical mobility - Moved from different state (%) - American Indian and Alaska Native
Geographical mobility - Moved from different state (%) - Multirace
Geographical mobility - Moved from different state (%) - Other Race
Geographical mobility - Moved from abroad (%)
Geographical mobility - Moved from abroad (%) - White
Geographical mobility - Moved from abroad (%) - Black or African American
Geographical mobility - Moved from abroad (%) - Asian
Geographical mobility - Moved from abroad (%) - Hispanic or Latino
Geographical mobility - Moved from abroad (%) - American Indian and Alaska Native
Geographical mobility - Moved from abroad (%) - Multirace
Geographical mobility - Moved from abroad (%) - Other Race
Place of birth for the foreign-born population - Ireland (%)
Place of birth for the foreign-born population - Denmark (%)
Place of birth for the foreign-born population - Norway (%)
Place of birth for the foreign-born population - Sweden (%)
Place of birth for the foreign-born population - United Kingdom (%)
Place of birth for the foreign-born population - England (%)
Place of birth for the foreign-born population - Scotland (%)
Place of birth for the foreign-born population - Other Northern Europe (%)
Place of birth for the foreign-born population - Austria (%)
Place of birth for the foreign-born population - Belgium (%)
Place of birth for the foreign-born population - France (%)
Place of birth for the foreign-born population - Germany (%)
Place of birth for the foreign-born population - Netherlands (%)
Place of birth for the foreign-born population - Switzerland (%)
Place of birth for the foreign-born population - Other Western Europe (%)
Place of birth for the foreign-born population - Greece (%)
Place of birth for the foreign-born population - Italy (%)
Place of birth for the foreign-born population - Portugal (%)
Place of birth for the foreign-born population - Spain (%)
Place of birth for the foreign-born population - Other Southern Europe (%)
Place of birth for the foreign-born population - Albania (%)
Place of birth for the foreign-born population - Belarus (%)
Place of birth for the foreign-born population - Bosnia and Herzegovina (%)
Place of birth for the foreign-born population - Bulgaria (%)
Place of birth for the foreign-born population - Croatia (%)
Place of birth for the foreign-born population - Czechoslovakia (%)
Place of birth for the foreign-born population - Hungary (%)
Place of birth for the foreign-born population - Latvia (%)
Place of birth for the foreign-born population - Lithuania (%)
Place of birth for the foreign-born population - North Macedonia (Macedonia) (%)
Place of birth for the foreign-born population - Moldova (%)
Place of birth for the foreign-born population - Poland (%)
Place of birth for the foreign-born population - Romania (%)
Place of birth for the foreign-born population - Russia (%)
Place of birth for the foreign-born population - Serbia (%)
Place of birth for the foreign-born population - Ukraine (%)
Place of birth for the foreign-born population - Other Eastern Europe (%)
Place of birth for the foreign-born population - China (%)
Place of birth for the foreign-born population - Hong Kong (%)
Place of birth for the foreign-born population - Taiwan (%)
Place of birth for the foreign-born population - Japan (%)
Place of birth for the foreign-born population - Korea (%)
Place of birth for the foreign-born population - Other Eastern Asia (%)
Place of birth for the foreign-born population - Afghanistan (%)
Place of birth for the foreign-born population - Bangladesh (%)
Place of birth for the foreign-born population - India (%)
Place of birth for the foreign-born population - Iran (%)
Place of birth for the foreign-born population - Kazakhstan (%)
Place of birth for the foreign-born population - Nepal (%)
Place of birth for the foreign-born population - Pakistan (%)
Place of birth for the foreign-born population - Sri Lanka (%)
Place of birth for the foreign-born population - Uzbekistan (%)
Place of birth for the foreign-born population - Other South Central Asia (%)
Place of birth for the foreign-born population - Burma (%)
Place of birth for the foreign-born population - Cambodia (%)
Place of birth for the foreign-born population - Indonesia (%)
Place of birth for the foreign-born population - Laos (%)
Place of birth for the foreign-born population - Malaysia (%)
Place of birth for the foreign-born population - Philippines (%)
Place of birth for the foreign-born population - Singapore (%)
Place of birth for the foreign-born population - Thailand (%)
Place of birth for the foreign-born population - Vietnam (%)
Place of birth for the foreign-born population - Other South Eastern Asia (%)
Place of birth for the foreign-born population - Armenia (%)
Place of birth for the foreign-born population - Iraq (%)
Place of birth for the foreign-born population - Israel (%)
Place of birth for the foreign-born population - Jordan (%)
Place of birth for the foreign-born population - Kuwait (%)
Place of birth for the foreign-born population - Lebanon (%)
Place of birth for the foreign-born population - Saudi Arabia (%)
Place of birth for the foreign-born population - Syria (%)
Place of birth for the foreign-born population - Turkey (%)
Place of birth for the foreign-born population - Yemen (%)
Place of birth for the foreign-born population - Other Western Asia (%)
Place of birth for the foreign-born population - Eritrea (%)
Place of birth for the foreign-born population - Ethiopia (%)
Place of birth for the foreign-born population - Kenya (%)
Place of birth for the foreign-born population - Somalia (%)
Place of birth for the foreign-born population - Uganda (%)
Place of birth for the foreign-born population - Zimbabwe (%)
Place of birth for the foreign-born population - Other Eastern Africa (%)
Place of birth for the foreign-born population - Cameroon (%)
Place of birth for the foreign-born population - Congo (%)
Place of birth for the foreign-born population - Democratic Republic of Congo (Zaire) (%)
Place of birth for the foreign-born population - Other Middle Africa (%)
Place of birth for the foreign-born population - Egypt (%)
Place of birth for the foreign-born population - Morocco (%)
Place of birth for the foreign-born population - Sudan (%)
Place of birth for the foreign-born population - Other Northern Africa (%)
Place of birth for the foreign-born population - South Africa (%)
Place of birth for the foreign-born population - Other Southern Africa (%)
Place of birth for the foreign-born population - Cabo Verde (%)
Place of birth for the foreign-born population - Ghana (%)
Place of birth for the foreign-born population - Liberia (%)
Place of birth for the foreign-born population - Nigeria (%)
Place of birth for the foreign-born population - Senegal (%)
Place of birth for the foreign-born population - Sierra Leone (%)
Place of birth for the foreign-born population - Other Western Africa (%)
Place of birth for the foreign-born population - Australia (%)
Place of birth for the foreign-born population - New Zealand (%)
Place of birth for the foreign-born population - Fiji (%)
Place of birth for the foreign-born population - Micronesia (%)
Place of birth for the foreign-born population - Bahamas (%)
Place of birth for the foreign-born population - Barbados (%)
Place of birth for the foreign-born population - Cuba (%)
Place of birth for the foreign-born population - Dominica (%)
Place of birth for the foreign-born population - Dominican Republic (%)
Place of birth for the foreign-born population - Grenada (%)
Place of birth for the foreign-born population - Haiti (%)
Place of birth for the foreign-born population - Jamaica (%)
Place of birth for the foreign-born population - St. Vincent and the Grenadines (%)
Place of birth for the foreign-born population - Trinidad and Tobago (%)
Place of birth for the foreign-born population - West Indies (%)
Place of birth for the foreign-born population - Other Caribbean (%)
Place of birth for the foreign-born population - Belize (%)
Place of birth for the foreign-born population - Costa Rica (%)
Place of birth for the foreign-born population - El Salvador (%)
Place of birth for the foreign-born population - Guatemala (%)
Place of birth for the foreign-born population - Honduras (%)
Place of birth for the foreign-born population - Mexico (%)
Place of birth for the foreign-born population - Nicaragua (%)
Place of birth for the foreign-born population - Panama (%)
Place of birth for the foreign-born population - Other Central America (%)
Place of birth for the foreign-born population - Argentina (%)
Place of birth for the foreign-born population - Bolivia (%)
Place of birth for the foreign-born population - Brazil (%)
Place of birth for the foreign-born population - Chile (%)
Place of birth for the foreign-born population - Colombia (%)
Place of birth for the foreign-born population - Ecuador (%)
Place of birth for the foreign-born population - Guyana (%)
Place of birth for the foreign-born population - Peru (%)
Place of birth for the foreign-born population - Uruguay (%)
Place of birth for the foreign-born population - Venezuela (%)
Place of birth for the foreign-born population - Other South America (%)
Place of birth for the foreign-born population - Canada (%)
Place of birth for the foreign-born population - Other Northern America (%)
Place of birth for the foreign-born population - Other (%)
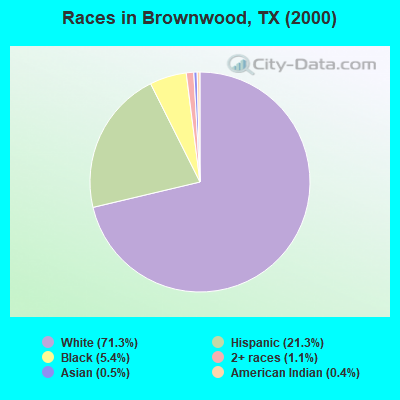
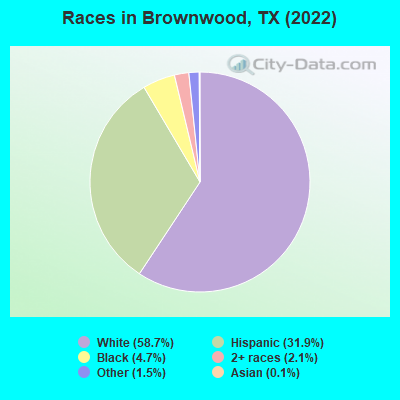
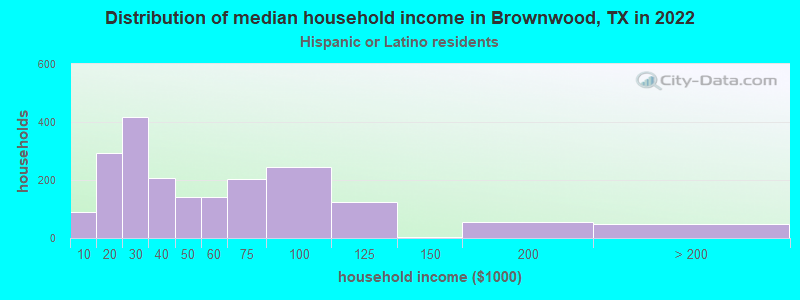
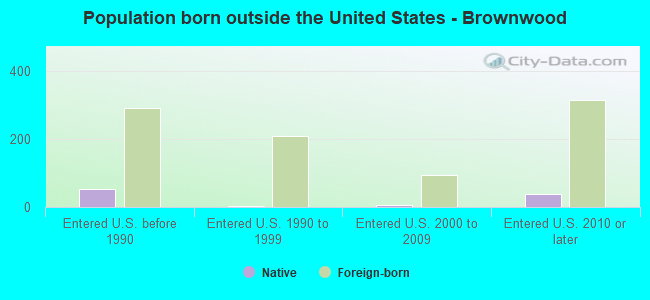
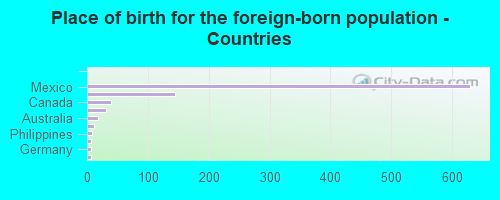
According to 2022 data, the most numerous races in Brownwood, TX are Hispanic (6,167 residents), White alone (11,350 residents), and Black alone (915 residents). 77.6% of Brownwood residents speak English at home. 4.7% of Brownwood, TX residents are foreign-born (4.2% born in Latin America), which is 260.6% less than the foreign-born rate of 17.0% across the entire state of Texas.
Race distribution in Brownwood
2000 2022
10,933,313 52.4% White alone 6,669,666 32.0% Hispanic 2,364,255 11.3% Black alone 554,445 2.7% Asian alone 230,567 1.1% Two or more races 68,859 0.3% American Indian alone 19,958 0.10% Other race alone 10,757 0.05% Native Hawaiian and Other
12,070,642 40.2% Hispanic 11,683,430 38.9% White alone 3,508,706 11.7% Black alone 1,608,173 5.4% Asian alone 956,560 3.2% Two or more races 125,763 0.4% Other race alone 47,023 0.2% American Indian alone 29,275 0.10% Native Hawaiian and Other
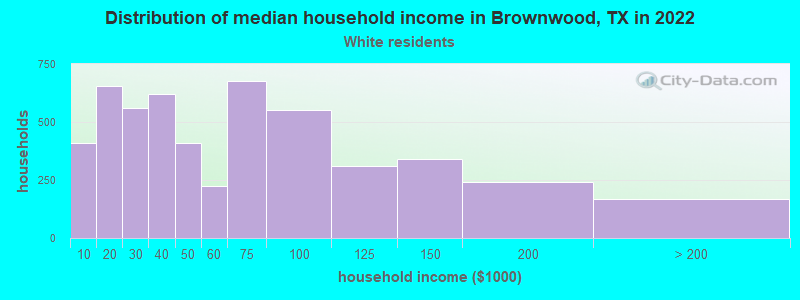
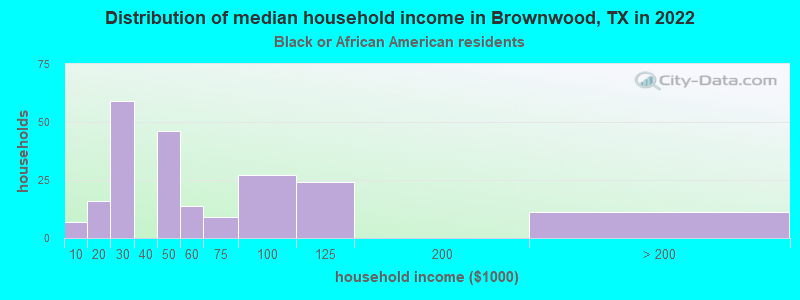
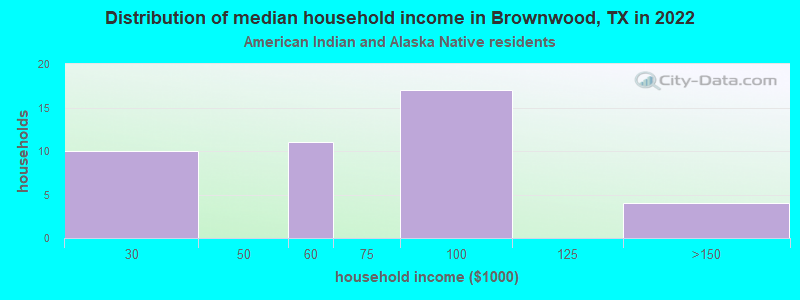
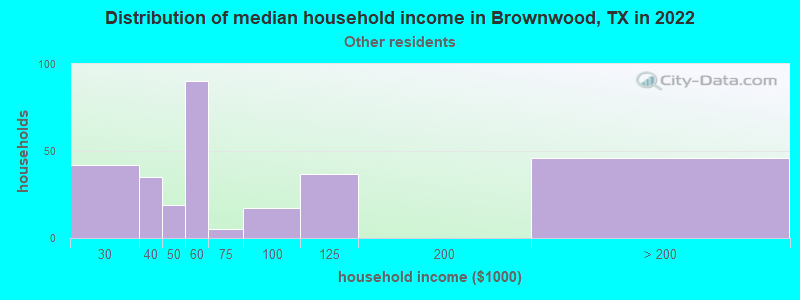
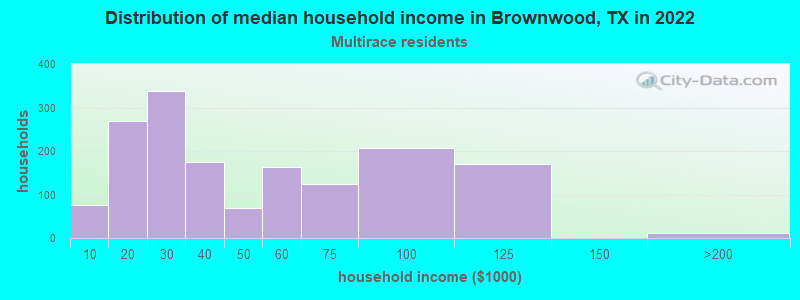
Income and house value in Brownwood Median household income in 2022 $44,416 White non-Hispanic householders$46,214 Black householders$84,889 American Indian and Alaska Native householders$54,662 Some other race householders$31,662 Two or more races householders$38,121 Hispanic or Latino race householdersMedian 2022 house value $149,701 White Non-Hispanic householders$100,424 Black or African American householders$122,879 American Indian or Alaska Native householders $140,344 Asian householders$71,731 Some other race householders$41,167 Two or more races householders$74,226 Hispanic or Latino householders
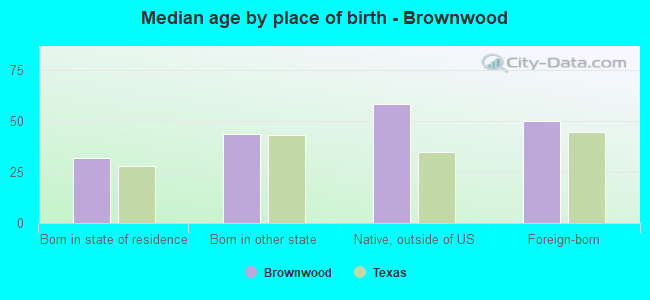
Median age by race in Brownwood
38.4 Median age for White residents38.3 38.6 19.9 Median age for Black or African American residents22.6 19.3 57.3 Median age for American Indian / Alaska Native residents47.5 59.0 26.0 Median age for Asian residents21.3 -679,245,282.3 -581,560,283.1 Median age for Native Hawaiian / Pacific Islander residents-612,729,233.5 -577,777,777.2 29.7 Median age for Other race residents24.3 46.3 36.0 Median age for Two or more races residents36.3 35.9 40.1 Median age for White alone residents39.0 42.1 29.8 Median age for Hispanic or Latino residents28.3 32.0
Owner/renter occupied households by race in Brownwood
House owners and renters - White residents 2,882 55.2% Owner occupied2,337 44.8% Renter occupiedHouse owners and renters - Black or African American residents 100 44.9% Owner occupied123 55.1% Renter occupiedHouse owners and renters - American Indian / Alaska Native residents 40 90.7% Owner occupied4 9.3% Renter occupiedHouse owners and renters - Native Hawaiian / Pacific Islander residents 5 100.0% Owner occupiedHouse owners and renters - Other race residents 160 55.8% Owner occupied127 44.2% Renter occupiedHouse owners and renters - Two or more races residents 920 57.2% Owner occupied687 42.8% Renter occupiedHouse owners and renters - White alone residents 2,793 54.7% Owner occupied2,310 45.3% Renter occupiedHouse owners and renters - Hispanic or Latino residents 1,069 53.9% Owner occupied913 46.1% Renter occupied
Language usage in Brownwood
English speakers - Total 77.6% of residents of Brownwood speak English at home.
21.6% of residents speak Spanish at home 3,166 80.3% Speak English very well777 19.7% Speak English less than very well0.6% of residents speak other language at home 78 74.3% Speak English very well27 25.7% Speak English less than very well
English speakers - Born in the United States 81.4% of residents of Brownwood speak English at home.
17.3% of residents speak Spanish at home 583 96.4% Speak English very well22 3.6% Speak English less than very well1.3% of residents speak other language at home 13 28.9% Speak English very well32 71.1% Speak English less than very well
English speakers - Native, born elsewhere 73.0% of residents of Brownwood speak English at home.
24.0% of residents speak Spanish at home 4 16.7% Speak English very well20 83.3% Speak English less than very well1.0% of residents speak other language at home 1 100.0% Speak English very well
English speakers - Foreign-born 13.3% of residents of Brownwood speak English at home.
83.7% of residents speak Spanish at home 325 45.0% Speak English very well398 55.0% Speak English less than very well2.2% of residents speak other language at home 19 100.0% Speak English very well
White (Caucasian) - Speak only English Native:
97.2% (11,020)Foreign-born:
37.3% (58)
White (Caucasian) - Speak another language Native:
6.2% (703)Foreign-born:
69.7% (108)
Black or African American - Speak another language Native:
0.9% (8)Foreign-born:
100.0% (3)
Asian - Speak another language Native:
17.4% (3)Foreign-born:
99.6% (6)
Other race - Speak only English Native:
52.5% (339)Foreign-born:
17.7% (41)
Other race - Speak another language Native:
48.6% (314)Foreign-born:
83.3% (192)
Two or more races - Speak only English Native:
34.4% (1,397)Foreign-born:
3.4% (18)
Two or more races - Speak another language Native:
67.7% (2,750)Foreign-born:
96.8% (512)
White alone - Speak only English Native:
96.1% (10,357)Foreign-born:
100.0% (56)
Hispanic or Latino - Speak only English Native:
44.5% (2,270)Foreign-born:
6.9% (47)
Hispanic or Latino - Speak another language Native:
55.6% (2,838)Foreign-born:
93.2% (628)
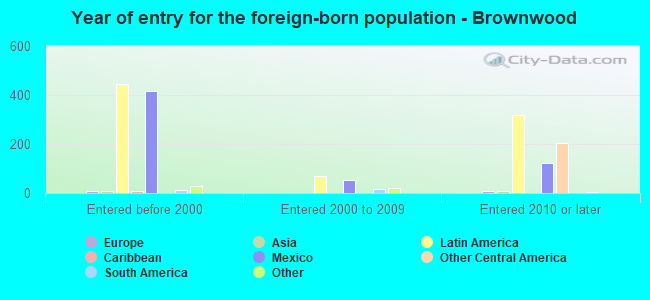
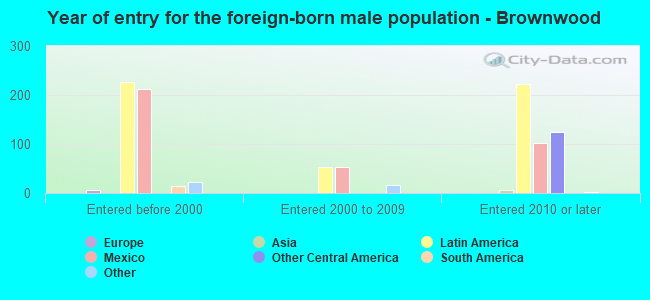
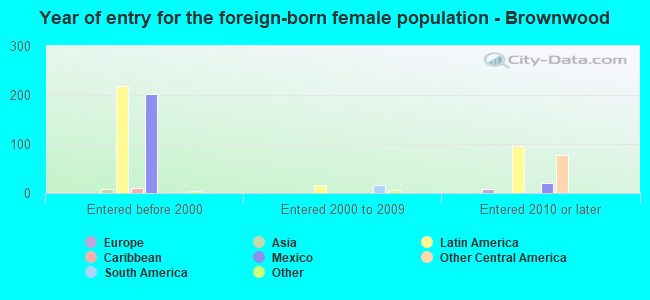
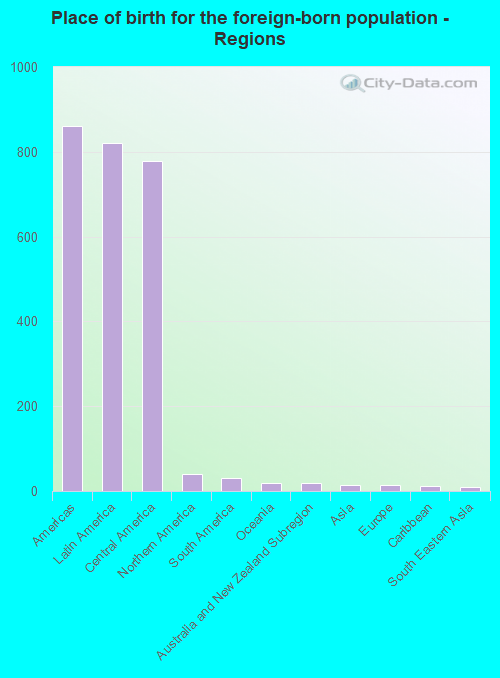
Foreign-born residents in Brownwood 911 residents are foreign born (4.2% Latin America ).
This city:
4.7%Texas:
17.1%
Marital status for residents in Brownwood Marital status - White (Caucasian) population 15 years and over
Males 33.3% Never married48.2% Now married1.9% Separated4.5% Widowed12.0% DivorcedFemales 31.7% Never married36.4% Now married2.6% Separated13.6% Widowed15.8% DivorcedWomen who gave birth in the past 12 months Now married:
83.5% (53)Unmarried:
16.5% (11)
Women who did not give birth in the past 12 months Now married:
34.5% (992)Unmarried:
65.5% (1,880)
Marital status - Black or African American population 15 years and over
Males 46.9% Never married25.0% Now married4.2% Separated0.0% Widowed23.8% DivorcedFemales 76.8% Never married13.3% Now married2.4% Separated0.9% Widowed6.7% DivorcedWomen who did not give birth in the past 12 months Now married:
3.1% (11)Unmarried:
96.9% (352)
Marital status - American Indian / Alaska Native population 15 years and over
Males 30.4% Never married60.9% Now married0.0% Separated0.0% Widowed8.7% DivorcedFemales 0.0% Never married57.6% Now married0.0% Separated0.0% Widowed42.4% DivorcedWomen who did not give birth in the past 12 months Now married:
22.2% (3)Unmarried:
77.8% (10)
Marital status - Asian population 15 years and over
Males 100.0% Never married0.0% Now married0.0% Separated0.0% Widowed0.0% DivorcedFemales 0.0% Never married100.0% Now married0.0% Separated0.0% Widowed0.0% DivorcedWomen who did not give birth in the past 12 months Now married:
100.0% (9)Unmarried:
0.0% (0)
Marital status - Native Hawaiian / Pacific Islander population 15 years and over
Males 0.0% Never married100.0% Now married0.0% Separated0.0% Widowed0.0% DivorcedFemales 0.0% Never married100.0% Now married0.0% Separated0.0% Widowed0.0% DivorcedWomen who did not give birth in the past 12 months Now married:
100.0% (4)Unmarried:
0.0% (0)
Marital status - Other race population 15 years and over
Males 51.4% Never married36.1% Now married0.0% Separated1.9% Widowed10.5% DivorcedFemales 36.0% Never married57.5% Now married6.5% Separated0.0% Widowed0.0% DivorcedWomen who did not give birth in the past 12 months Now married:
37.7% (82)Unmarried:
62.3% (136)
Marital status - Two or more races population 15 years and over
Males 52.0% Never married30.5% Now married0.0% Separated2.4% Widowed15.1% DivorcedFemales 30.4% Never married43.3% Now married3.9% Separated5.7% Widowed16.7% DivorcedWomen who gave birth in the past 12 months Now married:
0.0% (0)Unmarried:
100.0% (57)
Women who did not give birth in the past 12 months Now married:
43.3% (605)Unmarried:
56.7% (791)
Marital status - White alone, not Hispanic / Latino population 15 years and over
Males 32.4% Never married48.7% Now married1.8% Separated5.5% Widowed11.6% DivorcedFemales 28.6% Never married36.7% Now married2.4% Separated15.1% Widowed17.2% DivorcedWomen who gave birth in the past 12 months Now married:
70.5% (31)Unmarried:
29.5% (13)
Women who did not give birth in the past 12 months Now married:
35.7% (980)Unmarried:
64.3% (1,768)
Marital status - Hispanic or Latino population 15 years and over
Males 45.9% Never married37.8% Now married1.0% Separated1.1% Widowed14.2% DivorcedFemales 36.1% Never married42.5% Now married3.5% Separated4.9% Widowed13.0% DivorcedWomen who gave birth in the past 12 months Now married:
50.0% (36)Unmarried:
50.0% (36)
Women who did not give birth in the past 12 months Now married:
38.1% (647)Unmarried:
61.9% (1,050)
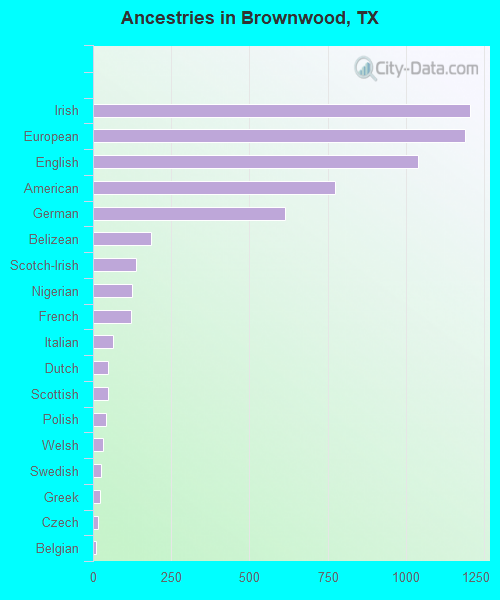
Ancestries in Brownwood
1,205 10.7% Irish1,190 10.6% European1,039 9.2% English774 6.9% American614 5.4% German184 1.6% Belizean137 1.2% Scotch-Irish124 1.1% Nigerian123 1.1% French63 0.6% Italian49 0.4% Dutch47 0.4% Scottish42 0.4% Polish31 0.3% Welsh27 0.2% Swedish23 0.2% Greek17 0.2% Czech11 0.10% Belgian9 0.08% Norwegian9 0.08% African4 0.04% Canadian4 0.04% Scandinavian3 0.03% British
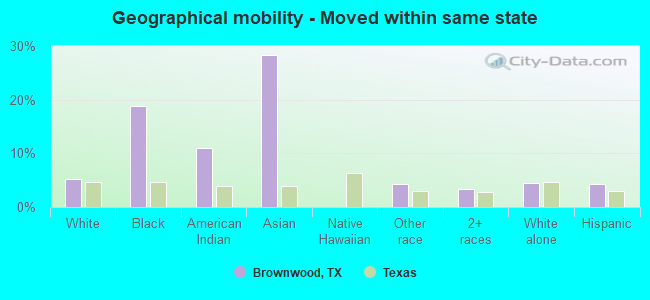
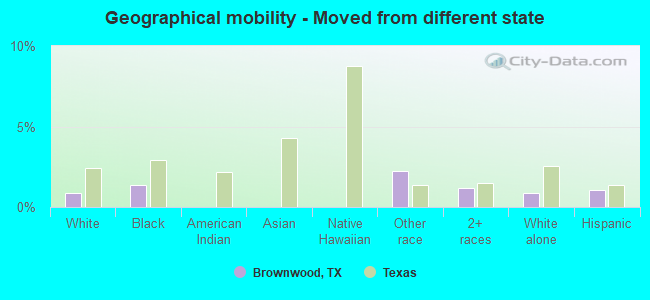
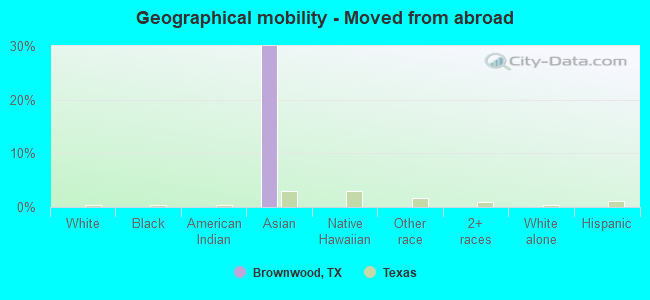
Geographical mobility in Brownwood Same house 1 year ago 9,323 80.9% White (Caucasian)708 75.5% Black or African American74 89.8% American Indian / Alaska Native12 47.5% Asian5 98.2% Native Hawaiian / Pacific Islander897 92.3% Other race4,114 82.8% Two or more races9,297 82.3% White alone, not Hispanic / Latino4,965 81.0% Hispanic or LatinoMoved within same county 1,397 12.1% White / Caucasian46 4.9% Black or African American15 1.5% Other race615 12.4% Two or more races1,306 11.6% White alone, not Hispanic / Latino800 13.1% Hispanic or LatinoMoved within same state 604 5.2% White / Caucasian177 18.8% Black or African American9 10.9% American Indian / Alaska Native7 28.3% Asian42 4.3% Other race163 3.3% Two or more races506 4.5% White alone, not Hispanic / Latino262 4.3% Hispanic or LatinoMoved from different state 98 0.9% White / Caucasian13 1.3% Black or African American22 2.2% Other race58 1.2% Two or more races102 0.9% White alone, not Hispanic / Latino65 1.1% Hispanic or LatinoMoved from abroad 7 0.1% White7 30.0% Asian10 0.1% White alone, not Hispanic / Latino
Children Nativity (place of birth) in Brownwood
Children under 6 years - Living with two parents Both parents native 462 100.0% NativeBoth parents foreign-born 23 100.0% NativeOne native, one foreign-born parent 36 100.0% NativeChildren under 6 years - Living with one parent Native parent 640 100.0% NativeForeign-born parent 45 100.0% Foreign-bornChildren 6 to 17 years - Living with two parents Both parents native 1,140 100.0% NativeBoth parents foreign-born 123 100.0% NativeOne native, one foreign-born parent 71 100.0% NativeChildren 6 to 17 years - Living with one parent Native parent 1,302 100.0% NativeForeign-born parent 44 50.5% Native44 49.5% Foreign-born
Grandparents responsible for own grandchildren in Brownwood
Grandparents (30 to 59 years) White / Caucasian 87 87.2% Responsible for grandchildren13 12.8% Not responsible for grandchildrenBlack or African American 8 100.0% Not responsible for grandchildrenOther race 17 100.0% Not responsible for grandchildrenTwo or more races 106 37.2% Responsible for grandchildren180 62.8% Not responsible for grandchildrenWhite alone, not Hispanic / Latino 102 83.5% Responsible for grandchildren20 16.5% Not responsible for grandchildrenHispanic or Latino 76 39.2% Responsible for grandchildren119 60.8% Not responsible for grandchildrenGrandparents (60 years and over) White / Caucasian 69 58.3% Responsible for grandchildren50 41.7% Not responsible for grandchildrenBlack or African American 8 29.9% Responsible for grandchildren19 70.1% Not responsible for grandchildrenTwo or more races 7 8.8% Responsible for grandchildren68 91.2% Not responsible for grandchildrenWhite alone, not Hispanic / Latino 62 47.7% Responsible for grandchildren68 52.3% Not responsible for grandchildrenHispanic or Latino 23 37.8% Responsible for grandchildren37 62.2% Not responsible for grandchildren