Races in Blackstone, Massachusetts (MA) Detailed Stats
Ancestries, Foreign-born residents, place of birth

Recent posts about races in Blackstone, Massachusetts on our local forum with over 2,400,000 registered users:
 | 2023 Real Estate Observations (5278 replies) |
| Big MA Ancestry Data Thread by Town (31 replies) |
| Town in Massachusetts You’d Least Like To Live In? (179 replies) |
| Any restaurants sous vide? (29 replies) |
| Is Massachusetts Real Estate Affordable? (132 replies) |
| Worcester wants Pawtucket Red Sox (36 replies) |
Latest news about races in Blackstone, MA collected exclusively by city-data.com from local newspapers, TV, and radio stations
2.7% of Blackstone, MA residents are foreign-born (1.1% born in Asia, 0.7% born in North America, 0.7% born in Europe), which is 560.3% less than the foreign-born rate of 18.0% across the entire state of Massachusetts.
Race distribution in Blackstone

- 8,50896.6%White alone
- 911.0%Hispanic
- 881.0%Two or more races
- 670.8%Asian alone
- 280.3%Black alone
- 180.2%American Indian alone
- 40.05%Other race alone
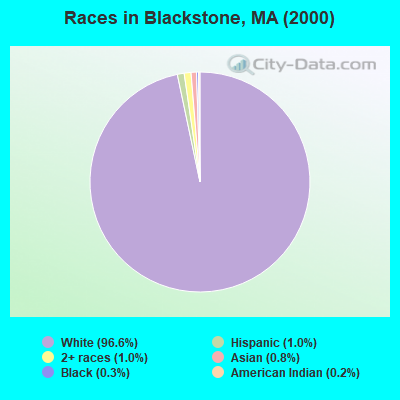
2000
2022
-
- 5,198,35981.9%White alone
- 428,7296.8%Hispanic
- 318,3295.0%Black alone
- 236,7863.7%Asian alone
- 110,3381.7%Two or more races
- 43,5860.7%Other race alone
- 11,2640.2%American Indian alone
- 1,7060.03%Native Hawaiian and Other
Pacific Islander alone

-
- 4,676,62767.0%White alone
- 911,03813.0%Hispanic
- 501,4637.2%Asian alone
- 459,7406.6%Black alone
- 341,8894.9%Two or more races
- 84,4031.2%Other race alone
- 5,8380.08%American Indian alone
- 9760.01%Native Hawaiian and Other
Pacific Islander alone

Income and house value in Blackstone
- Median household income in 2022
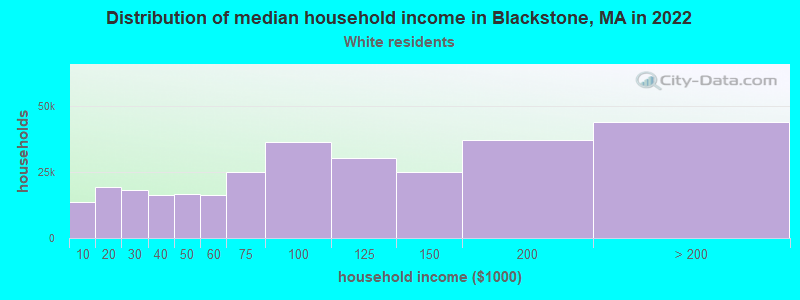
- $101,889White non-Hispanic householders
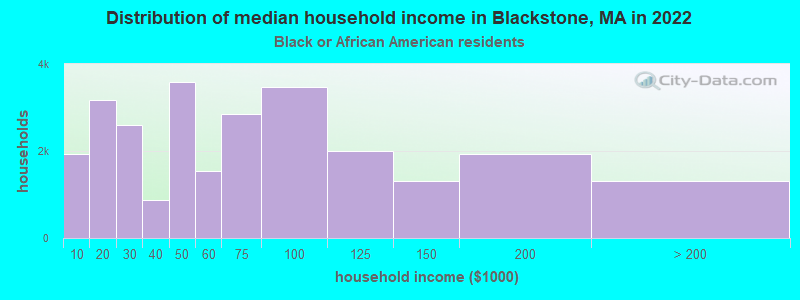
- $102,144Black householders
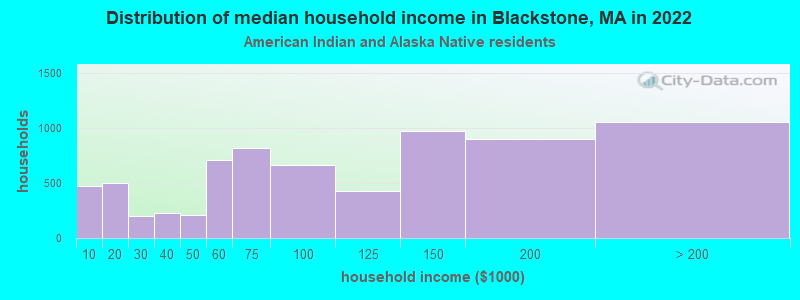
- $126,601American Indian and Alaska Native householders
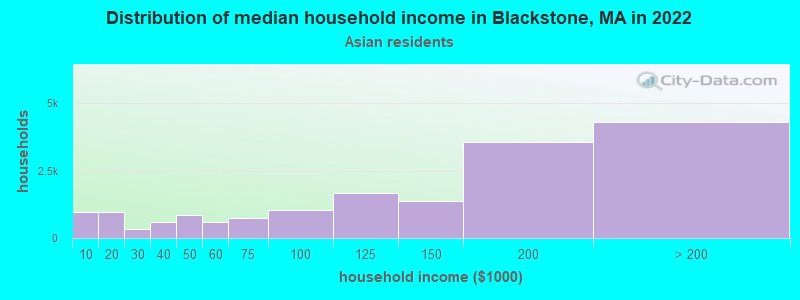
- $153,568Asian householders
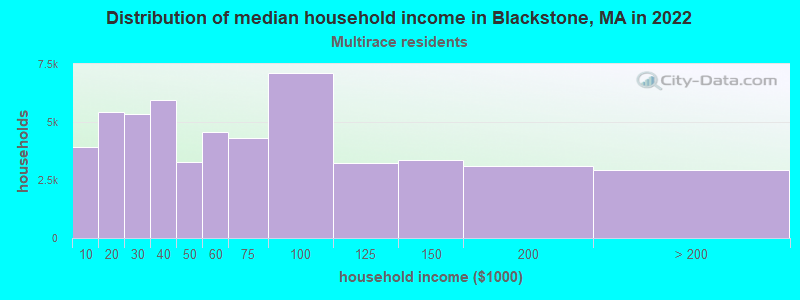
- $104,897Two or more races householders
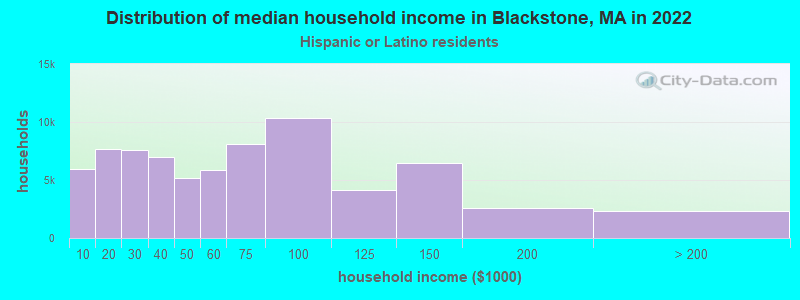
- $116,417Hispanic or Latino race householders
- Median 2022 house value
- $404,017White Non-Hispanic householders
- $310,676Black or African American householders
- $207,117American Indian or Alaska Native householders
- $345,196Asian householders
- $245,227Two or more races householders
- $690,392Hispanic or Latino householders
Household income for White non-Hispanic householders
Household income for Black householders
Household income for American Indian and Alaska Native householders
Household income for Asian householders
Household income for Two or more races householders
Household income for Hispanic or Latino race householders
Foreign-born residents in Blackstone
240 residents are foreign born (1.1% Asia, 0.7% North America, 0.7% Europe).
| This city: | 2.7% |
| Massachusetts: | 12.2% |
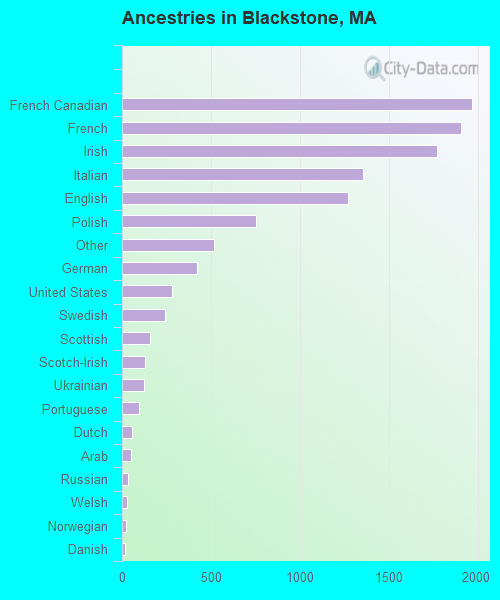
Ancestries in Blackstone

- 1,96417.5%French Canadian
- 1,90617.0%French
- 1,76815.8%Irish
- 1,35312.1%Italian
- 1,26911.3%English
- 7516.7%Polish
- 5164.6%Other
- 4203.7%German
- 2822.5%United States
- 2432.2%Swedish
- 1551.4%Scottish
- 1281.1%Scotch-Irish
- 1241.1%Ukrainian
- 970.9%Portuguese
- 590.5%Dutch
- 480.4%Arab
- 340.3%Russian
- 290.3%Welsh
- 200.2%Norwegian
- 180.2%Danish
- 160.1%Greek
- 130.1%Lithuanian
- 60.05%Slovak
Zip codes: 01504.