Races in Beloit, Wisconsin (WI) Detailed Stats
Data:
Races - White alone (%)
Races - White alone (% change since 2000)
Races - Black alone (%)
Races - Black alone (% change since 2000)
Races - American Indian alone (%)
Races - American Indian alone (% change since 2000)
Races - Asian alone (%)
Races - Asian alone (% change since 2000)
Races - Hispanic (%)
Races - Hispanic (% change since 2000)
Races - Native Hawaiian and Other Pacific Islander alone (%)
Races - Native Hawaiian and Other Pacific Islander alone (% change since 2000)
Races - Two or more races(%)
Races - Two or more races(% change since 2000)
Races - Other race alone (%)
Races - Other race alone (% change since 2000)
Racial diversity
Place of birth - Born in state of residence (%)
Place of birth - Born in state of residence (%) - White
Place of birth - Born in state of residence (%) - Black or African American
Place of birth - Born in state of residence (%) - Asian
Place of birth - Born in state of residence (%) - Hispanic or Latino
Place of birth - Born in state of residence (%) - American Indian and Alaska Native
Place of birth - Born in state of residence (%) - Multirace
Place of birth - Born in state of residence (%) - Other Race
Place of birth - Born in other state (%)
Place of birth - Born in other state (%) - White
Place of birth - Born in other state (%) - Black or African American
Place of birth - Born in other state (%) - Asian
Place of birth - Born in other state (%) - Hispanic or Latino
Place of birth - Born in other state (%) - American Indian and Alaska Native
Place of birth - Born in other state (%) - Multirace
Place of birth - Born in other state (%) - Other Race
Place of birth - Native, outside of US (%)
Place of birth - Native, outside of US (%) - White
Place of birth - Native, outside of US (%) - Black or African American
Place of birth - Native, outside of US (%) - Asian
Place of birth - Native, outside of US (%) - Hispanic or Latino
Place of birth - Native, outside of US (%) - American Indian and Alaska Native
Place of birth - Native, outside of US (%) - Multirace
Place of birth - Native, outside of US (%) - Other Race
Place of birth - Foreign born (%)
Place of birth - Foreign born (%) - White
Place of birth - Foreign born (%) - Black or African American
Place of birth - Foreign born (%) - Asian
Place of birth - Foreign born (%) - Hispanic or Latino
Place of birth - Foreign born (%) - American Indian and Alaska Native
Place of birth - Foreign born (%) - Multirace
Place of birth - Foreign born (%) - Other Race
Residents speaking English at home (%)
Residents speaking English at home - Born in the United States (%)
Residents speaking English at home - Native, born elsewhere (%)
Residents speaking English at home - Foreign born (%)
Residents speaking Spanish at home (%)
Residents speaking Spanish at home - Born in the United States (%)
Residents speaking Spanish at home - Native, born elsewhere (%)
Residents speaking Spanish at home - Foreign born (%)
Residents speaking other language at home (%)
Residents speaking other language at home - Born in the United States (%)
Residents speaking other language at home - Native, born elsewhere (%)
Residents speaking other language at home - Foreign born (%)
Marital status - Never married (%)
Marital status - Now married (%)
Marital status - Separated (%)
Marital status - Widowed (%)
Marital status - Divorced (%)
Ancestries Reported - Arab (%)
Ancestries Reported - Czech (%)
Ancestries Reported - Danish (%)
Ancestries Reported - Dutch (%)
Ancestries Reported - English (%)
Ancestries Reported - French (%)
Ancestries Reported - French Canadian (%)
Ancestries Reported - German (%)
Ancestries Reported - Greek (%)
Ancestries Reported - Hungarian (%)
Ancestries Reported - Irish (%)
Ancestries Reported - Italian (%)
Ancestries Reported - Lithuanian (%)
Ancestries Reported - Norwegian (%)
Ancestries Reported - Polish (%)
Ancestries Reported - Portuguese (%)
Ancestries Reported - Russian (%)
Ancestries Reported - Scotch-Irish (%)
Ancestries Reported - Scottish (%)
Ancestries Reported - Slovak (%)
Ancestries Reported - Subsaharan African (%)
Ancestries Reported - Swedish (%)
Ancestries Reported - Swiss (%)
Ancestries Reported - Ukrainian (%)
Ancestries Reported - United States (%)
Ancestries Reported - Welsh (%)
Ancestries Reported - West Indian (%)
Ancestries Reported - Other (%)
Geographical mobility - Same house 1 year ago (%)
Geographical mobility - Same house 1 year ago (%) - White
Geographical mobility - Same house 1 year ago (%) - Black or African American
Geographical mobility - Same house 1 year ago (%) - Asian
Geographical mobility - Same house 1 year ago (%) - Hispanic or Latino
Geographical mobility - Same house 1 year ago (%) - American Indian and Alaska Native
Geographical mobility - Same house 1 year ago (%) - Multirace
Geographical mobility - Same house 1 year ago (%) - Other Race
Geographical mobility - Moved within same county (%)
Geographical mobility - Moved within same county (%) - White
Geographical mobility - Moved within same county (%) - Black or African American
Geographical mobility - Moved within same county (%) - Asian
Geographical mobility - Moved within same county (%) - Hispanic or Latino
Geographical mobility - Moved within same county (%) - American Indian and Alaska Native
Geographical mobility - Moved within same county (%) - Multirace
Geographical mobility - Moved within same county (%) - Other Race
Geographical mobility - Moved from different county within same state (%)
Geographical mobility - Moved from different county within same state (%) - White
Geographical mobility - Moved from different county within same state (%) - Black or African American
Geographical mobility - Moved from different county within same state (%) - Asian
Geographical mobility - Moved from different county within same state (%) - Hispanic or Latino
Geographical mobility - Moved from different county within same state (%) - American Indian and Alaska Native
Geographical mobility - Moved from different county within same state (%) - Multirace
Geographical mobility - Moved from different county within same state (%) - Other Race
Geographical mobility - Moved from different state (%)
Geographical mobility - Moved from different state (%) - White
Geographical mobility - Moved from different state (%) - Black or African American
Geographical mobility - Moved from different state (%) - Asian
Geographical mobility - Moved from different state (%) - Hispanic or Latino
Geographical mobility - Moved from different state (%) - American Indian and Alaska Native
Geographical mobility - Moved from different state (%) - Multirace
Geographical mobility - Moved from different state (%) - Other Race
Geographical mobility - Moved from abroad (%)
Geographical mobility - Moved from abroad (%) - White
Geographical mobility - Moved from abroad (%) - Black or African American
Geographical mobility - Moved from abroad (%) - Asian
Geographical mobility - Moved from abroad (%) - Hispanic or Latino
Geographical mobility - Moved from abroad (%) - American Indian and Alaska Native
Geographical mobility - Moved from abroad (%) - Multirace
Geographical mobility - Moved from abroad (%) - Other Race
Place of birth for the foreign-born population - Ireland (%)
Place of birth for the foreign-born population - Denmark (%)
Place of birth for the foreign-born population - Norway (%)
Place of birth for the foreign-born population - Sweden (%)
Place of birth for the foreign-born population - United Kingdom (%)
Place of birth for the foreign-born population - England (%)
Place of birth for the foreign-born population - Scotland (%)
Place of birth for the foreign-born population - Other Northern Europe (%)
Place of birth for the foreign-born population - Austria (%)
Place of birth for the foreign-born population - Belgium (%)
Place of birth for the foreign-born population - France (%)
Place of birth for the foreign-born population - Germany (%)
Place of birth for the foreign-born population - Netherlands (%)
Place of birth for the foreign-born population - Switzerland (%)
Place of birth for the foreign-born population - Other Western Europe (%)
Place of birth for the foreign-born population - Greece (%)
Place of birth for the foreign-born population - Italy (%)
Place of birth for the foreign-born population - Portugal (%)
Place of birth for the foreign-born population - Spain (%)
Place of birth for the foreign-born population - Other Southern Europe (%)
Place of birth for the foreign-born population - Albania (%)
Place of birth for the foreign-born population - Belarus (%)
Place of birth for the foreign-born population - Bosnia and Herzegovina (%)
Place of birth for the foreign-born population - Bulgaria (%)
Place of birth for the foreign-born population - Croatia (%)
Place of birth for the foreign-born population - Czechoslovakia (%)
Place of birth for the foreign-born population - Hungary (%)
Place of birth for the foreign-born population - Latvia (%)
Place of birth for the foreign-born population - Lithuania (%)
Place of birth for the foreign-born population - North Macedonia (Macedonia) (%)
Place of birth for the foreign-born population - Moldova (%)
Place of birth for the foreign-born population - Poland (%)
Place of birth for the foreign-born population - Romania (%)
Place of birth for the foreign-born population - Russia (%)
Place of birth for the foreign-born population - Serbia (%)
Place of birth for the foreign-born population - Ukraine (%)
Place of birth for the foreign-born population - Other Eastern Europe (%)
Place of birth for the foreign-born population - China (%)
Place of birth for the foreign-born population - Hong Kong (%)
Place of birth for the foreign-born population - Taiwan (%)
Place of birth for the foreign-born population - Japan (%)
Place of birth for the foreign-born population - Korea (%)
Place of birth for the foreign-born population - Other Eastern Asia (%)
Place of birth for the foreign-born population - Afghanistan (%)
Place of birth for the foreign-born population - Bangladesh (%)
Place of birth for the foreign-born population - India (%)
Place of birth for the foreign-born population - Iran (%)
Place of birth for the foreign-born population - Kazakhstan (%)
Place of birth for the foreign-born population - Nepal (%)
Place of birth for the foreign-born population - Pakistan (%)
Place of birth for the foreign-born population - Sri Lanka (%)
Place of birth for the foreign-born population - Uzbekistan (%)
Place of birth for the foreign-born population - Other South Central Asia (%)
Place of birth for the foreign-born population - Burma (%)
Place of birth for the foreign-born population - Cambodia (%)
Place of birth for the foreign-born population - Indonesia (%)
Place of birth for the foreign-born population - Laos (%)
Place of birth for the foreign-born population - Malaysia (%)
Place of birth for the foreign-born population - Philippines (%)
Place of birth for the foreign-born population - Singapore (%)
Place of birth for the foreign-born population - Thailand (%)
Place of birth for the foreign-born population - Vietnam (%)
Place of birth for the foreign-born population - Other South Eastern Asia (%)
Place of birth for the foreign-born population - Armenia (%)
Place of birth for the foreign-born population - Iraq (%)
Place of birth for the foreign-born population - Israel (%)
Place of birth for the foreign-born population - Jordan (%)
Place of birth for the foreign-born population - Kuwait (%)
Place of birth for the foreign-born population - Lebanon (%)
Place of birth for the foreign-born population - Saudi Arabia (%)
Place of birth for the foreign-born population - Syria (%)
Place of birth for the foreign-born population - Turkey (%)
Place of birth for the foreign-born population - Yemen (%)
Place of birth for the foreign-born population - Other Western Asia (%)
Place of birth for the foreign-born population - Eritrea (%)
Place of birth for the foreign-born population - Ethiopia (%)
Place of birth for the foreign-born population - Kenya (%)
Place of birth for the foreign-born population - Somalia (%)
Place of birth for the foreign-born population - Uganda (%)
Place of birth for the foreign-born population - Zimbabwe (%)
Place of birth for the foreign-born population - Other Eastern Africa (%)
Place of birth for the foreign-born population - Cameroon (%)
Place of birth for the foreign-born population - Congo (%)
Place of birth for the foreign-born population - Democratic Republic of Congo (Zaire) (%)
Place of birth for the foreign-born population - Other Middle Africa (%)
Place of birth for the foreign-born population - Egypt (%)
Place of birth for the foreign-born population - Morocco (%)
Place of birth for the foreign-born population - Sudan (%)
Place of birth for the foreign-born population - Other Northern Africa (%)
Place of birth for the foreign-born population - South Africa (%)
Place of birth for the foreign-born population - Other Southern Africa (%)
Place of birth for the foreign-born population - Cabo Verde (%)
Place of birth for the foreign-born population - Ghana (%)
Place of birth for the foreign-born population - Liberia (%)
Place of birth for the foreign-born population - Nigeria (%)
Place of birth for the foreign-born population - Senegal (%)
Place of birth for the foreign-born population - Sierra Leone (%)
Place of birth for the foreign-born population - Other Western Africa (%)
Place of birth for the foreign-born population - Australia (%)
Place of birth for the foreign-born population - New Zealand (%)
Place of birth for the foreign-born population - Fiji (%)
Place of birth for the foreign-born population - Micronesia (%)
Place of birth for the foreign-born population - Bahamas (%)
Place of birth for the foreign-born population - Barbados (%)
Place of birth for the foreign-born population - Cuba (%)
Place of birth for the foreign-born population - Dominica (%)
Place of birth for the foreign-born population - Dominican Republic (%)
Place of birth for the foreign-born population - Grenada (%)
Place of birth for the foreign-born population - Haiti (%)
Place of birth for the foreign-born population - Jamaica (%)
Place of birth for the foreign-born population - St. Vincent and the Grenadines (%)
Place of birth for the foreign-born population - Trinidad and Tobago (%)
Place of birth for the foreign-born population - West Indies (%)
Place of birth for the foreign-born population - Other Caribbean (%)
Place of birth for the foreign-born population - Belize (%)
Place of birth for the foreign-born population - Costa Rica (%)
Place of birth for the foreign-born population - El Salvador (%)
Place of birth for the foreign-born population - Guatemala (%)
Place of birth for the foreign-born population - Honduras (%)
Place of birth for the foreign-born population - Mexico (%)
Place of birth for the foreign-born population - Nicaragua (%)
Place of birth for the foreign-born population - Panama (%)
Place of birth for the foreign-born population - Other Central America (%)
Place of birth for the foreign-born population - Argentina (%)
Place of birth for the foreign-born population - Bolivia (%)
Place of birth for the foreign-born population - Brazil (%)
Place of birth for the foreign-born population - Chile (%)
Place of birth for the foreign-born population - Colombia (%)
Place of birth for the foreign-born population - Ecuador (%)
Place of birth for the foreign-born population - Guyana (%)
Place of birth for the foreign-born population - Peru (%)
Place of birth for the foreign-born population - Uruguay (%)
Place of birth for the foreign-born population - Venezuela (%)
Place of birth for the foreign-born population - Other South America (%)
Place of birth for the foreign-born population - Canada (%)
Place of birth for the foreign-born population - Other Northern America (%)
Place of birth for the foreign-born population - Other (%)
Latest news about races in Beloit, WI collected exclusively by city-data.com from local newspapers, TV, and radio stations
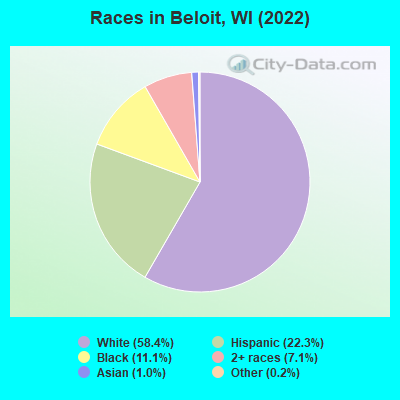
According to 2022 data, the most numerous races in Beloit, WI are White alone (21,448 residents), Hispanic (8,179 residents), and Black alone (4,065 residents). 81.0% of Beloit residents speak English at home. 10.4% of Beloit, WI residents are foreign-born (9.3% born in Latin America), which is 52.1% greater than the foreign-born rate of 5.0% across the entire state of Wisconsin.
Race distribution in Beloit
2000 2022
4,681,630 87.3% White alone 300,245 5.6% Black alone 192,921 3.6% Hispanic 87,995 1.6% Asian alone 51,921 1.0% Two or more races 43,980 0.8% American Indian alone 3,637 0.07% Other race alone 1,346 0.03% Native Hawaiian and Other
4,654,031 79.0% White alone 447,022 7.6% Hispanic 345,678 5.9% Black alone 217,532 3.7% Two or more races 172,242 2.9% Asian alone 33,762 0.6% American Indian alone 19,680 0.3% Other race alone 2,592 0.04% Native Hawaiian and Other
Income and house value in Beloit Median household income in 2022 $58,539 White non-Hispanic householders$40,516 Black householders$47,653 American Indian and Alaska Native householders$59,061 Some other race householders$59,642 Two or more races householders$58,212 Hispanic or Latino race householdersMedian 2022 house value $134,931 White Non-Hispanic householders$119,807 Black or African American householders$299,126 American Indian or Alaska Native householders $220,956 Asian householders$102,720 Some other race householders$126,878 Two or more races householders$113,129 Hispanic or Latino householders
Median age by race in Beloit
41.6 Median age for White residents39.5 44.1 32.1 Median age for Black or African American residents33.0 43.5 46.6 Median age for American Indian / Alaska Native residents48.5 22.2 29.1 Median age for Asian residents31.4 47.1 -825,688,072.6 Median age for Native Hawaiian / Pacific Islander residents-666,666,666.0 -666,666,666.0 24.9 Median age for Other race residents24.5 24.4 18.8 Median age for Two or more races residents16.3 20.3 43.5 Median age for White alone residents40.4 46.2 21.7 Median age for Hispanic or Latino residents22.0 21.3
Owner/renter occupied households by race in Beloit
House owners and renters - White residents 6,542 66.7% Owner occupied3,271 33.3% Renter occupiedHouse owners and renters - Black or African American residents 460 28.7% Owner occupied1,141 71.3% Renter occupiedHouse owners and renters - American Indian / Alaska Native residents 47 100.0% Renter occupiedHouse owners and renters - Asian residents 76 33.9% Owner occupied148 66.1% Renter occupiedHouse owners and renters - Other race residents 248 45.4% Owner occupied299 54.6% Renter occupiedHouse owners and renters - Two or more races residents 1,096 49.3% Owner occupied1,129 50.7% Renter occupiedHouse owners and renters - White alone residents 6,390 66.6% Owner occupied3,202 33.4% Renter occupiedHouse owners and renters - Hispanic or Latino residents 988 48.9% Owner occupied1,033 51.1% Renter occupied
Language usage in Beloit
English speakers - Total 81.0% of residents of Beloit speak English at home.
18.9% of residents speak Spanish at home 4,398 67.7% Speak English very well2,101 32.3% Speak English less than very well1.6% of residents speak other language at home 324 57.8% Speak English very well237 42.2% Speak English less than very well
English speakers - Born in the United States 90.3% of residents of Beloit speak English at home.
10.1% of residents speak Spanish at home 1,074 97.8% Speak English very well24 2.2% Speak English less than very well0.4% of residents speak other language at home 41 100.0% Speak English very well
English speakers - Native, born elsewhere 40.1% of residents of Beloit speak English at home.
64.3% of residents speak Spanish at home 155 88.6% Speak English very well20 11.4% Speak English less than very well10.7% of residents speak other language at home 29 100.0% Speak English very well
English speakers - Foreign-born 7.0% of residents of Beloit speak English at home.
92.0% of residents speak Spanish at home 1,306 37.0% Speak English very well2,220 63.0% Speak English less than very well9.8% of residents speak other language at home 194 51.7% Speak English very well181 48.3% Speak English less than very well
White (Caucasian) - Speak only English Native:
97.9% (20,891)Foreign-born:
16.5% (80)
White (Caucasian) - Speak another language Native:
2.0% (420)Foreign-born:
76.0% (370)
Black or African American - Speak only English Native:
100.0% (4,041)Foreign-born:
37.8% (38)
American Indian / Alaska Native - Speak another language Native:
66.8% (69)Foreign-born:
100.0% (36)
Asian - Speak only English Native:
67.1% (76)Foreign-born:
11.6% (29)
Asian - Speak another language Native:
31.8% (36)Foreign-born:
89.7% (222)
Other race - Speak only English Native:
38.5% (199)Foreign-born:
3.1% (20)
Other race - Speak another language Native:
100.0% (517)Foreign-born:
96.7% (622)
Two or more races - Speak only English Native:
51.1% (2,646)Foreign-born:
2.2% (62)
Two or more races - Speak another language Native:
38.3% (1,985)Foreign-born:
72.4% (2,071)
White alone - Speak only English Native:
98.4% (20,256)Foreign-born:
54.4% (30)
White alone - Speak another language Native:
1.6% (329)Foreign-born:
100.0% (55)
Hispanic or Latino - Speak only English Native:
29.3% (1,095)Foreign-born:
2.7% (97)
Hispanic or Latino - Speak another language Native:
71.9% (2,690)Foreign-born:
97.8% (3,527)
Foreign-born residents in Beloit 3,827 residents are foreign born (9.3% Latin America ).
This city:
10.4%Wisconsin:
5.0%
Marital status for residents in Beloit Marital status - White (Caucasian) population 15 years and over
Males 42.0% Never married42.6% Now married1.2% Separated2.8% Widowed11.5% DivorcedFemales 33.9% Never married39.8% Now married2.8% Separated8.8% Widowed14.8% DivorcedWomen who gave birth in the past 12 months Now married:
41.5% (96)Unmarried:
58.5% (136)
Women who did not give birth in the past 12 months Now married:
36.3% (1,908)Unmarried:
63.7% (3,341)
Marital status - Black or African American population 15 years and over
Males 59.4% Never married34.6% Now married0.6% Separated2.1% Widowed3.2% DivorcedFemales 55.9% Never married21.5% Now married1.4% Separated4.0% Widowed17.2% DivorcedWomen who gave birth in the past 12 months Now married:
19.8% (17)Unmarried:
80.2% (70)
Women who did not give birth in the past 12 months Now married:
16.5% (149)Unmarried:
83.5% (752)
Marital status - American Indian / Alaska Native population 15 years and over
Males 51.9% Never married0.0% Now married0.0% Separated0.0% Widowed48.1% DivorcedFemales 81.7% Never married0.0% Now married0.0% Separated18.3% Widowed0.0% DivorcedWomen who did not give birth in the past 12 months Now married:
0.0% (0)Unmarried:
100.0% (46)
Marital status - Asian population 15 years and over
Males 85.4% Never married14.6% Now married0.0% Separated0.0% Widowed0.0% DivorcedFemales 19.3% Never married51.5% Now married18.1% Separated1.2% Widowed9.9% DivorcedWomen who gave birth in the past 12 months Now married:
100.0% (11)Unmarried:
0.0% (0)
Women who did not give birth in the past 12 months Now married:
67.1% (95)Unmarried:
32.9% (46)
Marital status - Other race population 15 years and over
Males 57.7% Never married31.0% Now married5.1% Separated0.5% Widowed5.7% DivorcedFemales 59.7% Never married25.6% Now married6.4% Separated1.1% Widowed7.2% DivorcedWomen who gave birth in the past 12 months Now married:
65.5% (17)Unmarried:
34.5% (9)
Women who did not give birth in the past 12 months Now married:
23.5% (167)Unmarried:
76.5% (543)
Marital status - Two or more races population 15 years and over
Males 47.3% Never married43.5% Now married1.3% Separated0.2% Widowed7.8% DivorcedFemales 47.9% Never married38.9% Now married8.7% Separated2.7% Widowed1.9% DivorcedWomen who gave birth in the past 12 months Now married:
52.4% (44)Unmarried:
47.6% (40)
Women who did not give birth in the past 12 months Now married:
41.3% (856)Unmarried:
58.7% (1,217)
Marital status - White alone, not Hispanic / Latino population 15 years and over
Males 41.5% Never married42.6% Now married1.3% Separated3.0% Widowed11.8% DivorcedFemales 31.9% Never married40.4% Now married2.8% Separated9.4% Widowed15.5% DivorcedWomen who gave birth in the past 12 months Now married:
44.2% (100)Unmarried:
55.8% (126)
Women who did not give birth in the past 12 months Now married:
38.4% (1,896)Unmarried:
61.6% (3,040)
Marital status - Hispanic or Latino population 15 years and over
Males 49.0% Never married41.6% Now married2.5% Separated0.2% Widowed6.8% DivorcedFemales 55.2% Never married34.3% Now married5.5% Separated0.9% Widowed4.1% DivorcedWomen who gave birth in the past 12 months Now married:
62.1% (41)Unmarried:
37.9% (25)
Women who did not give birth in the past 12 months Now married:
30.0% (578)Unmarried:
70.0% (1,350)
Ancestries in Beloit
2,822 15.9% German842 4.7% Norwegian802 4.5% Irish793 4.5% English531 3.0% American344 1.9% French341 1.9% Italian294 1.7% Swedish212 1.2% European191 1.1% Polish184 1.0% Dutch87 0.5% Scandinavian80 0.4% Scottish73 0.4% African37 0.2% Austrian36 0.2% Czech35 0.2% British28 0.2% Danish24 0.1% French Canadian21 0.1% Hungarian20 0.1% Eastern European20 0.1% Yugoslavian18 0.1% Finnish18 0.1% Swiss18 0.1% Welsh13 0.07% Northern European12 0.07% Slovene10 0.06% Latvian10 0.06% Croatian9 0.05% Serbian7 0.04% Greek6 0.03% Armenian5 0.03% Ethiopian3 0.02% Scotch-Irish2 0.01% Guyanese
Geographical mobility in Beloit Same house 1 year ago 20,120 89.1% White (Caucasian)4,051 86.9% Black or African American98 73.8% American Indian / Alaska Native340 93.8% Asian2,092 80.6% Other race8,265 96.1% Two or more races18,917 88.9% White alone, not Hispanic / Latino7,373 92.8% Hispanic or LatinoMoved within same county 1,281 5.7% White / Caucasian271 5.8% Black or African American29 21.8% American Indian / Alaska Native11 3.1% Asian287 11.1% Other race424 4.9% Two or more races1,250 5.9% White alone, not Hispanic / Latino419 5.3% Hispanic or LatinoMoved within same state 327 1.4% White / Caucasian289 6.2% Black or African American5 3.5% American Indian / Alaska Native66 2.5% Other race17 0.2% Two or more races323 1.5% White alone, not Hispanic / Latino117 1.5% Hispanic or LatinoMoved from different state 726 3.2% White / Caucasian36 0.8% Black or African American60 16.5% Asian8 99.3% Native Hawaiian / Pacific Islander110 4.2% Other race181 2.1% Two or more races690 3.2% White alone, not Hispanic / Latino95 1.2% Hispanic or LatinoMoved from abroad 13 0.1% White3 0.8% Asian3 0.0% White alone, not Hispanic / Latino22 0.3% Hispanic or Latino
Children Nativity (place of birth) in Beloit
Children under 6 years - Living with two parents Both parents native 934 100.0% NativeBoth parents foreign-born 237 100.0% NativeOne native, one foreign-born parent 64 100.0% NativeChildren under 6 years - Living with one parent Native parent 1,324 100.0% NativeForeign-born parent 137 85.0% Native24 15.0% Foreign-bornChildren 6 to 17 years - Living with two parents Both parents native 1,931 100.0% NativeBoth parents foreign-born 495 79.8% Native125 20.2% Foreign-bornOne native, one foreign-born parent 494 100.0% NativeChildren 6 to 17 years - Living with one parent Native parent 1,548 100.0% NativeForeign-born parent 588 62.5% Native353 37.5% Foreign-born
Grandparents responsible for own grandchildren in Beloit
Grandparents (30 to 59 years) White / Caucasian 65 46.8% Responsible for grandchildren74 53.2% Not responsible for grandchildrenBlack or African American 125 100.0% Not responsible for grandchildrenOther race 88 100.0% Not responsible for grandchildrenTwo or more races 23 13.9% Responsible for grandchildren142 86.1% Not responsible for grandchildrenWhite alone, not Hispanic / Latino 67 50.9% Responsible for grandchildren65 49.1% Not responsible for grandchildrenHispanic or Latino 14 11.9% Responsible for grandchildren101 88.1% Not responsible for grandchildrenGrandparents (60 years and over) White / Caucasian 95 73.1% Responsible for grandchildren35 26.9% Not responsible for grandchildrenBlack or African American 15 100.0% Not responsible for grandchildrenOther race 59 81.0% Responsible for grandchildren14 19.0% Not responsible for grandchildrenTwo or more races 26 100.0% Not responsible for grandchildrenWhite alone, not Hispanic / Latino 97 72.1% Responsible for grandchildren38 27.9% Not responsible for grandchildrenHispanic or Latino 53 62.3% Responsible for grandchildren32 37.7% Not responsible for grandchildren