Races in Beaver Creek, Oregon (OR) Detailed Stats
Ancestries, Foreign-born residents, place of birth
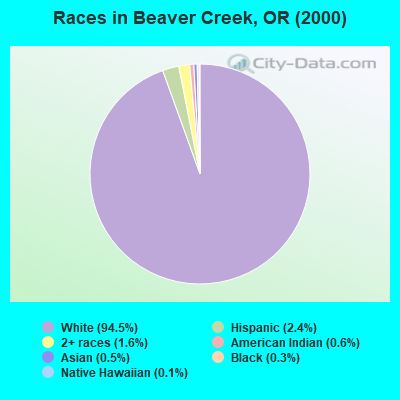
Race distribution in Beaver Creek

- 6,70694.5%White alone
- 1702.4%Hispanic
- 1111.6%Two or more races
- 400.6%American Indian alone
- 340.5%Asian alone
- 220.3%Black alone
- 90.1%Native Hawaiian and Other
Pacific Islander alone - 30.04%Other race alone
2000
2022
-
- 2,857,61683.5%White alone
- 275,3148.0%Hispanic
- 100,3332.9%Asian alone
- 82,7332.4%Two or more races
- 53,3251.6%Black alone
- 40,1301.2%American Indian alone
- 7,3980.2%Native Hawaiian and Other
Pacific Islander alone - 4,5500.1%Other race alone

-
- 3,037,57171.6%White alone
- 609,53814.4%Hispanic
- 252,7446.0%Two or more races
- 191,2834.5%Asian alone
- 78,2281.8%Black alone
- 29,3990.7%American Indian alone
- 25,7310.6%Other race alone
- 15,6430.4%Native Hawaiian and Other
Pacific Islander alone

Income and house value in Beaver Creek
- Median household income in 2022
- $115,100White non-Hispanic householders
- $100,580Black householders
- $110,455Asian householders
- $103,598Native Hawaiian and other Pacific Islander householders
- $188,980Some other race householders
- $20,584Two or more races householders
- $95,654Hispanic or Latino race householders
- Median 2022 house value
- $666,185White Non-Hispanic householders
- $356,375Black or African American householders
- $712,751Some other race householders
- $712,751Hispanic or Latino householders
Household income for White non-Hispanic householders

Household income for Black householders

Household income for Asian householders

Household income for Native Hawaiian and other Pacific Islander householders

Household income for Two or more races householders

Household income for Hispanic or Latino race householders

Zip code: 97045