Westview (Pacific Highlands) neighborhood in Pacifica, California (CA), 94044 detailed profile
Settings
X


Business Search - 14 Million verified businesses
Area: 0.810 square miles
Population: 6,518
Population density:
| Westview (Pacific Highlands): | 8,045 people per square mile |
| Pacifica: | 3,012 people per square mile |

- 3,04145.6%Asian
- 1,39620.9%White
- 1,35720.4%Hispanic or Latino
- 4977.5%Two or more races
- 1872.8%Black
- 1021.5%Some other race
- 761.1%Native Hawaiian and Other
Pacific Islander - 80.1%American Indian

Median household income in 2022:
| Westview (Pacific Highlands): | $146,892 |
| Pacifica: | $151,849 |
Distribution of median household income
![Distribution of median household income]()
- 76Less than $10,000
- 207$10,000 to $19,999
- 247$20,000 to $29,999
- 237$30,000 to $39,999
- 291$40,000 to $49,999
- 146$50,000 to $59,999
- 147$60,000 to $74,999
- 137$75,000 to $99,999
- 146$100,000 to $124,999
- 155$125,000 to $149,999
- 539$150,000 to $199,999
- 589$200,000 or more

Distribution of owner-occupied house/condo value
![Distribution of owner-occupied house/condo value]()
- 69Less than $50,000
- 26$50,000 to $99,999
- 559$100,000 to $149,999
- 123$150,000 to $199,999
- 70$250,000 to $299,999
- 31$300,000 to $399,999
- 2$400,000 to $499,999
- 126$500,000 to $749,999
- 211$750,000 to $999,999
- 1,154$1,000,000 or more

Distribution of rent paid by renters
![Distribution of rent paid by renters]()
- 20$200 to $299
- 120$300 to $399
- 11$400 to $499
- 12$500 to $599
- 615$600 to $699
- 6$700 to $799
- 31$800 to $899
- 67$900 to $999
- 2$1,000 to $1,249
- 23$1,250 to $1,499
- 188$1,500 to $1,999
- 794$2,000 or more

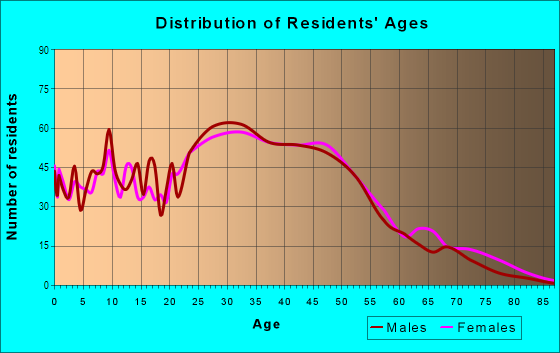
| Males: | 3,559 |
| Females: | 2,958 |
Males:
| This neighborhood: | 41.0 years |
| Whole city: | 42.2 years |
| This neighborhood: | 45.4 years |
| Whole city: | 44.6 years |
Average household size:
| Westview (Pacific Highlands): | 2.9 people |
| Pacifica: | 2.7 people |
Percentage of family households:
| Westview (Pacific Highlands): | 50.0% |
| Pacifica: | 45.8% |
| Here: | 55.5% |
| Pacifica: | 55.6% |
Percentage of married-couple families with children (among all households):
| Westview (Pacific Highlands): | 31.4% |
| Pacifica: | 30.5% |
Percentage of single-mother households (among all households):
| Westview (Pacific Highlands): | 2.5% |
| Pacifica: | 4.0% |
Percentage of never married males 15 years old and over:
Percentage of never married females 15 years old and over:
| Westview (Pacific Highlands): | 23.2% |
| Pacifica: | 18.0% |
Percentage of never married females 15 years old and over:
| Westview (Pacific Highlands): | 12.6% |
| city: | 13.5% |
Percentage of people that speak English not well or not at all:
| Westview (Pacific Highlands): | 4.2% |
| Pacifica: | 2.3% |
Percentage of people born in this state:
Percentage of people born in another U.S. state:
Percentage of native residents but born outside the U.S.:
Percentage of foreign born residents:
| Here: | 50.6% |
| Pacifica: | 58.3% |
Percentage of people born in another U.S. state:
| Westview (Pacific Highlands): | 11.9% |
| Pacifica: | 17.9% |
Percentage of native residents but born outside the U.S.:
| Here: | 1.5% |
| city: | 1.9% |
Percentage of foreign born residents:
| Here: | 36.0% |
| Pacifica: | 21.9% |

Owner-occupied
Renter-occupied


- Rooms in owner-occupied houses and condos in Westview <
> - 1131 room
- 1212 rooms
- 533 rooms
- 994 rooms
- 5375 rooms
- 4026 rooms
- 1727 rooms
- 1388 rooms
- 1239+ rooms

- Rooms in renter-occupied apartments in Westview <
> - 231 room
- 552 rooms
- 2163 rooms
- 3604 rooms
- 1405 rooms
- 306 rooms
- 397 rooms
- 368 rooms
- 239+ rooms
Owner-occupied
Renter-occupied

- Bedrooms in owner-occupied houses and condos in Westview <
> - 113no bedroom
- 441 bedroom
- 632 bedrooms
- 8903 bedrooms
- 4024 bedrooms
- 1205+ bedrooms

- Bedrooms in renter-occupied apartments in Westview <
> - 23no bedroom
- 1991 bedroom
- 4642 bedrooms
- 1563 bedrooms
- 504 bedrooms
- 465+ bedrooms
Average number of cars or other vehicles available in houses/condos:
Average number of cars or other vehicles available in apartments:
| This neighborhood: | 2.3 |
| Pacifica: | 2.4 |
Average number of cars or other vehicles available in apartments:
| Here: | 2.1 |
| city: | 1.7 |
Percentage of units with a mortgage:
| Westview (Pacific Highlands): | 69.0% |
| Pacifica: | 69.8% |
Average estimated value of detached houses in 2022 (66.0% of all units):
| Westview (Pacific Highlands): | $1,248,599 |
| California: | $988,808 |

- Year house built in Westview <
> - 682020 or later
- 752010 to 2019
- 2342000 to 2009
- 1931990 to 1999
- 2581980 to 1989
- 3061970 to 1979
- 7761960 to 1969
- 4411950 to 1959
- 1431940 to 1949
- 531939 or earlier

City-data.com crime index for city in 2020 (higher means more crime):
| City: | 150.9 |
| U.S. average: | 219.5 |
Travel time to work (commute)
![Travel time to work (commute)]()
- 56Less than 5 minutes
- 1215 to 9 minutes
- 28610 to 14 minutes
- 42315 to 19 minutes
- 54220 to 24 minutes
- 17725 to 29 minutes
- 62830 to 34 minutes
- 7135 to 39 minutes
- 24640 to 44 minutes
- 20345 to 59 minutes
- 16460 to 89 minutes
- 6990 or more minutes

Means of transportation to work
![Means of transportation to work]()
- 56.6%2,150Drove a car alone
- 7.2%272Carpooled
- 8.1%309Bus
- 3.9%150Subway or elevated rail
- 1.0%38Long-distance train or commuter rail
- 0.0%1Light rail, streetcar or trolley
- 6.3%238Taxi
- 2.3%89Motorcycle
- 5.1%193Bicycle
- 1.3%48Walked
- 2.7%102Other means
- 22.3%847Worked at home

Time leaving home to go to work
![Time leaving home to go to work]()
- 9212:00 a.m. to 4:59 a.m.
- 565:00 a.m. to 5:29 a.m.
- 585:30 a.m. to 5:59 a.m.
- 2256:00 a.m. to 6:29 a.m.
- 2776:30 a.m. to 6:59 a.m.
- 5077:00 a.m. to 7:29 a.m.
- 2867:30 a.m. to 7:59 a.m.
- 3378:00 a.m. to 8:29 a.m.
- 1788:30 a.m. to 8:59 a.m.
- 2589:00 a.m. to 9:59 a.m.
- 19310:00 a.m. to 10:59 a.m.
- 2911:00 a.m. to 11:59 a.m.
- 37912:00 p.m. to 3:59 p.m.
- 1074:00 p.m. to 11:59 p.m.

Occupations of males:
- Percentage of males in management occupations (except farmers):
Here: 9.1% city: 14.5%
- Percentage of males in business and financial operations occupations:
Here: 7.6% city: 5.0%
- Percentage of males in computer and mathematical occupations:
Here: 8.3% city: 8.8%
- Percentage of males in architecture and engineering occupations:
Here: 2.0% city: 4.6%
- Percentage of males in life, physical, and social science occupations:
Here: 4.2% city: 2.5%
- Percentage of males in education, training, and library occupations:
Here: 1.9% city: 3.6%
- Percentage of males in arts, design, entertainment, sports, and media occupations:
Here: 2.4% city: 3.3%
- Percentage of males in healthcare practitioners and technical occupations:
Here: 4.4% city: 3.5%
- Percentage of males in service occupations:
Here: 9.8% city: 12.5%
- Percentage of males in sales and office occupations:
Here: 23.4% city: 14.8%
- Percentage of males in construction, extraction, and maintenance occupations:
Here: 6.7% city: 7.7%
- Percentage of males in production occupations:
Here: 1.7% city: 4.4%
- Percentage of males in transportation occupations:
Here: 12.7% city: 8.0%
- Percentage of males in material moving occupations:
Here: 1.9% city: 1.6%
Occupations of females:
- Percentage of females in management occupations (except farmers):
Here: 12.7% city: 13.8%
- Percentage of females in business and financial operations occupations:
Here: 9.7% city: 7.1%
- Percentage of females in computer and mathematical occupations:
Here: 2.7% city: 1.5%
- Percentage of females in architecture and engineering occupations:
Here: 2.9% city: 2.1%
- Percentage of females in life, physical, and social science occupations:
Here: 3.3% city: 3.8%
- Percentage of females in education, training, and library occupations:
Here: 7.3% city: 10.7%
- Percentage of females in arts, design, entertainment, sports, and media occupations:
Here: 3.0% city: 4.6%
- Percentage of females in healthcare practitioners and technical occupations:
Here: 12.9% city: 10.8%
- Percentage of females in service occupations:
Here: 20.9% city: 15.1%
- Percentage of females in sales and office occupations:
Here: 22.6% city: 21.8%
Percentage of people 16-64 in Armed Forces:
| Westview (Pacific Highlands): | 0.0% |
| Pacifica: | 0.1% |
Education in this neighborhood (subdivision or community):
- Percentage of people 3 years and older in K-12 schools:
Westview (Pacific Highlands): 17.5% Pacifica: 14.7%
- Percentage of people 3 years and older in undergraduate colleges:
Westview (Pacific Highlands): 8.4% Pacifica: 5.6%
- Percentage of people 3 years and older in grad. or professional schools:
Westview (Pacific Highlands): 1.8% Pacifica: 1.1%
- Percentage of students K-12 enrolled in private schools:
Westview (Pacific Highlands): 121.9% Pacifica: 16.2%
Percentage of population below poverty level:
| Westview (Pacific Highlands): | 4.3% |
| Pacifica: | 5.6% |
Median year owner moved in (as recorded in 2022):
Median year renter moved in (as recorded in 2022):
| Westview (Pacific Highlands): | 2002 |
| Pacifica: | 2002 |
Median year renter moved in (as recorded in 2022):
| Westview (Pacific Highlands): | 2014 |
| Pacifica: | 2015 |
Percentage of married-couple families with both working:
| Westview (Pacific Highlands): | 66.3% |
| Pacifica: | 76.9% |

- 60.2%Utility gas
- 30.5%Electricity
- 3.3%No fuel used
- 2.3%Bottled, tank, or LP gas
- 2.2%Solar energy
- 1.6%Wood
Highways in this neighborhood:
Skyline Blvd (State Hwy 35)
Length: 1.80 miles
Directions: N-S, SE-NW
Address range: 2100 to 2899
Directions: N-S, SE-NW
Address range: 2100 to 2899
Roads and streets:
Manor Dr
Length: 0.97 miles
Directions: E-W, N-S, SE-NW
Address range: 328 to 699
Directions: E-W, N-S, SE-NW
Address range: 328 to 699
Inverness Dr
Length: 0.78 miles
Directions: N-S, SE-NW
Address range: 300 to 600
Directions: N-S, SE-NW
Address range: 300 to 600
Heathcliff Dr
Length: 0.76 miles
Directions: E-W, N-S, SE-NW, SW-NE
Address range: 300 to 599
Directions: E-W, N-S, SE-NW, SW-NE
Address range: 300 to 599
Hickey Blvd
Length: 0.69 miles
Directions: N-S, SE-NW, SW-NE
Address range: 100 to 674
Directions: N-S, SE-NW, SW-NE
Address range: 100 to 674
Imperial Dr
Length: 0.66 miles
Directions: E-W, N-S, SE-NW, SW-NE
Address range: 200 to 799
Directions: E-W, N-S, SE-NW, SW-NE
Address range: 200 to 799
Monterey Rd
Length: 0.51 miles
Directions: E-W, N-S, SE-NW, SW-NE
Address range: 451 to 599
Directions: E-W, N-S, SE-NW, SW-NE
Address range: 451 to 599
Firecrest Ave (E Firecrest Ave)
Length: 0.47 miles
Directions: E-W, SE-NW
Address range: 300 to 499
Directions: E-W, SE-NW
Address range: 300 to 499
Lockhaven Dr
Length: 0.39 miles
Directions: E-W, SE-NW, SW-NE
Address range: 600 to 799
Directions: E-W, SE-NW, SW-NE
Address range: 600 to 799
Claridge Dr
Length: 0.33 miles
Direction: SE-NW
Address range: 600 to 799
Direction: SE-NW
Address range: 600 to 799
Lynbrook Dr
Length: 0.32 miles
Directions: E-W, N-S, SE-NW, SW-NE
Address range: 300 to 598
Directions: E-W, N-S, SE-NW, SW-NE
Address range: 300 to 598
Foothill Dr (E Foothill Dr)
Length: 0.31 miles
Directions: E-W, N-S, SE-NW, SW-NE
Address range: 600 to 699
Directions: E-W, N-S, SE-NW, SW-NE
Address range: 600 to 699
Glencourt Way
Length: 0.29 miles
Directions: E-W, SW-NE
Address range: 300 to 399
Directions: E-W, SW-NE
Address range: 300 to 399
Skyridge Dr
Length: 0.29 miles
Directions: E-W, N-S, SE-NW, SW-NE
Address range: 780 to 899
Directions: E-W, N-S, SE-NW, SW-NE
Address range: 780 to 899
Andover Dr
Length: 0.27 miles
Directions: E-W, N-S, SE-NW
Address range: 300 to 599
Directions: E-W, N-S, SE-NW
Address range: 300 to 599
Forest Lake Dr
Length: 0.26 miles
Directions: E-W, SE-NW, SW-NE
Address range: 600 to 699
Directions: E-W, SE-NW, SW-NE
Address range: 600 to 699
Norfolk Dr
Length: 0.26 miles
Directions: N-S, SE-NW, SW-NE
Address range: 300 to 499
Directions: N-S, SE-NW, SW-NE
Address range: 300 to 499
Horizon Way
Length: 0.20 miles
Directions: E-W, N-S, SE-NW
Address range: 300 to 399
Directions: E-W, N-S, SE-NW
Address range: 300 to 399
Glasgow Dr
Length: 0.19 miles
Directions: N-S, SE-NW, SW-NE
Address range: 400 to 499
Directions: N-S, SE-NW, SW-NE
Address range: 400 to 499
Lorry Ln
Length: 0.16 miles
Directions: N-S, SE-NW, SW-NE
Address range: 100 to 199
Directions: N-S, SE-NW, SW-NE
Address range: 100 to 199
Sharp Park Rd
Length: 0.16 miles
Directions: E-W, SW-NE
Directions: E-W, SW-NE
Kavanaugh Way
Length: 0.16 miles
Directions: N-S, SE-NW
Address range: 200 to 299
Directions: N-S, SE-NW
Address range: 200 to 299
Southmoor Dr
Length: 0.15 miles
Directions: E-W, SW-NE
Address range: 600 to 699
Directions: E-W, SW-NE
Address range: 600 to 699
Cragmont Ct
Length: 0.13 miles
Directions: E-W, N-S, SW-NE
Address range: 1 to 99
Directions: E-W, N-S, SW-NE
Address range: 1 to 99
Lomond Dr
Length: 0.13 miles
Directions: N-S, SE-NW
Address range: 400 to 499
Directions: N-S, SE-NW
Address range: 400 to 499
Sea Spray Ln
Length: 0.12 miles
Direction: SE-NW
Address range: 500 to 569
Direction: SE-NW
Address range: 500 to 569
Mina Ln
Length: 0.11 miles
Directions: E-W, SE-NW, SW-NE
Address range: 300 to 399
Directions: E-W, SE-NW, SW-NE
Address range: 300 to 399
Miller Ave
Length: 0.11 miles
Directions: N-S, SE-NW
Address range: 569 to 637
Directions: N-S, SE-NW
Address range: 569 to 637
Idlewild Ct
Length: 0.09 miles
Directions: E-W, SE-NW
Address range: 1 to 99
Directions: E-W, SE-NW
Address range: 1 to 99
Heather Ct
Length: 0.09 miles
Directions: N-S, SE-NW
Address range: 600 to 699
Directions: N-S, SE-NW
Address range: 600 to 699
Viewridge Dr
Length: 0.09 miles
Direction: E-W
Address range: 600 to 665
Direction: E-W
Address range: 600 to 665
Panorama Ct
Length: 0.09 miles
Direction: SE-NW
Address range: 100 to 178
Direction: SE-NW
Address range: 100 to 178
Susan Dr
Length: 0.07 miles
Directions: N-S, SW-NE
Directions: N-S, SW-NE
Sunset Ct
Length: 0.07 miles
Directions: N-S, SE-NW
Address range: 200 to 234
Directions: N-S, SE-NW
Address range: 200 to 234
Gateway Dr
Length: 0.07 miles
Directions: N-S, SE-NW, SW-NE
Address range: 401 to 499
Directions: N-S, SE-NW, SW-NE
Address range: 401 to 499
Clark Ct
Length: 0.07 miles
Direction: SW-NE
Direction: SW-NE
Waverly Pl
Length: 0.06 miles
Direction: E-W
Address range: 500 to 699
Direction: E-W
Address range: 500 to 699
Lewis Ln
Length: 0.06 miles
Direction: SE-NW
Address range: 500 to 599
Direction: SE-NW
Address range: 500 to 599
Hacienda Ct
Length: 0.03 miles
Direction: E-W
Direction: E-W
View Point Ct
Length: 0.03 miles
Directions: N-S, SE-NW
Address range: 300 to 372
Directions: N-S, SE-NW
Address range: 300 to 372
Other features:
Milagra Crk
Length: 0.37 miles
Directions: E-W, SE-NW
Directions: E-W, SE-NW