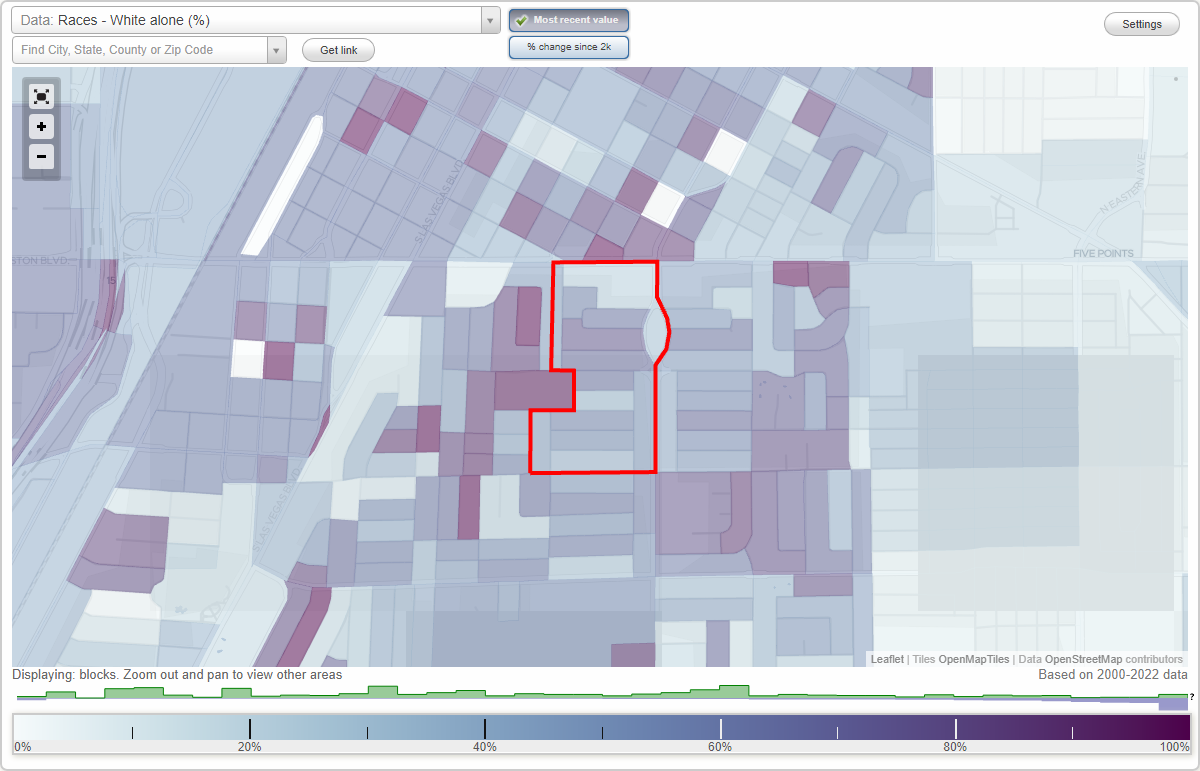
West Circle neighborhood in Las Vegas, Nevada (NV), 89104 detailed profile
Settings
X

Business Search - 14 Million verified businesses
Area: 0.131 square miles
Population: 741
Population density:
| West Circle: | 5,639 people per square mile |
| Las Vegas: | 5,792 people per square mile |

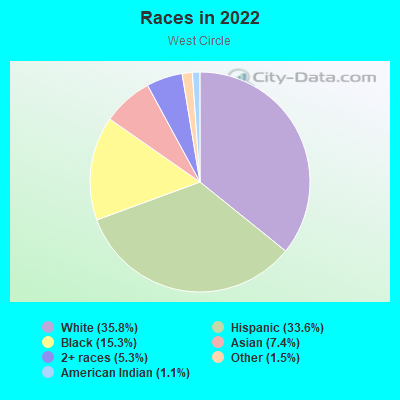
- 26935.8%White
- 25333.6%Hispanic or Latino
- 11515.3%Black
- 567.4%Asian
- 405.3%Two or more races
- 111.5%Some other race
- 81.1%American Indian
Median household income in 2022:
| West Circle: | $74,088 |
| Las Vegas: | $68,905 |
Distribution of median household income
![Distribution of median household income]()
- 11Less than $10,000
- 31$10,000 to $19,999
- 25$20,000 to $29,999
- 56$30,000 to $39,999
- 42$40,000 to $49,999
- 16$50,000 to $59,999
- 28$60,000 to $74,999
- 35$75,000 to $99,999
- 31$100,000 to $124,999
- 38$125,000 to $149,999
- 49$150,000 to $199,999
- 31$200,000 or more

Distribution of owner-occupied house/condo value
![Distribution of owner-occupied house/condo value]()
- 13Less than $50,000
- 13$50,000 to $99,999
- 12$100,000 to $149,999
- 25$150,000 to $199,999
- 14$200,000 to $249,999
- 41$250,000 to $299,999
- 52$300,000 to $399,999
- 54$400,000 to $499,999
- 19$500,000 to $749,999

Distribution of rent paid by renters
![Distribution of rent paid by renters]()
- 4Less than $100
- 5$100 to $199
- 7$400 to $499
- 21$500 to $599
- 20$600 to $699
- 16$700 to $799
- 11$800 to $899
- 17$900 to $999
- 10$1,000 to $1,249
- 38$1,250 to $1,499
- 66$1,500 to $1,999
- 12$2,000 or more

Median rent in 2022:
| West Circle: | $1,308 |
| Las Vegas: | $1,277 |
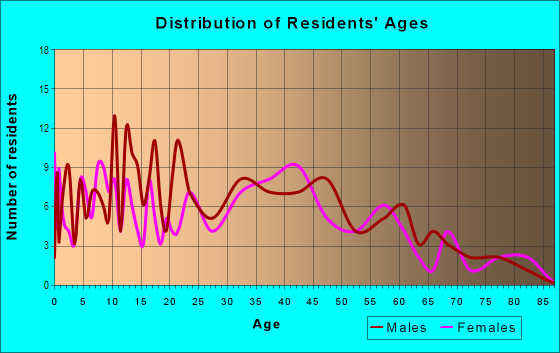
| Males: | 392 |
| Females: | 348 |
Males:
| This neighborhood: | 42.6 years |
| Whole city: | 38.4 years |
| This neighborhood: | 42.7 years |
| Whole city: | 38.9 years |
Average household size:
| West Circle: | 2.6 people |
| Las Vegas: | 2.7 people |
Percentage of family households:
| West Circle: | 40.8% |
| Las Vegas: | 45.8% |
| Here: | 40.3% |
| Las Vegas: | 40.9% |
Percentage of married-couple families with children (among all households):
| West Circle: | 35.3% |
| Las Vegas: | 23.4% |
Percentage of single-mother households (among all households):
| West Circle: | 15.7% |
| Las Vegas: | 10.1% |
Percentage of never married males 15 years old and over:
Percentage of never married females 15 years old and over:
| West Circle: | 20.4% |
| Las Vegas: | 19.7% |
Percentage of never married females 15 years old and over:
| West Circle: | 19.3% |
| city: | 17.0% |
Percentage of people that speak English not well or not at all:
| West Circle: | 11.4% |
| Las Vegas: | 7.0% |
Percentage of people born in this state:
Percentage of people born in another U.S. state:
Percentage of native residents but born outside the U.S.:
Percentage of foreign born residents:
| Here: | 27.0% |
| Las Vegas: | 27.3% |
Percentage of people born in another U.S. state:
| West Circle: | 38.8% |
| Las Vegas: | 49.8% |
Percentage of native residents but born outside the U.S.:
| Here: | 2.2% |
| city: | 1.9% |
Percentage of foreign born residents:
| Here: | 32.0% |
| Las Vegas: | 21.0% |
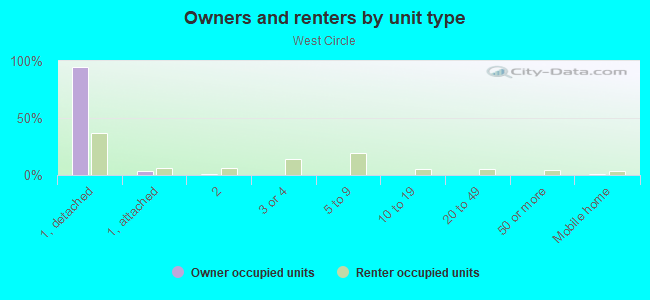
Owner-occupied
Renter-occupied

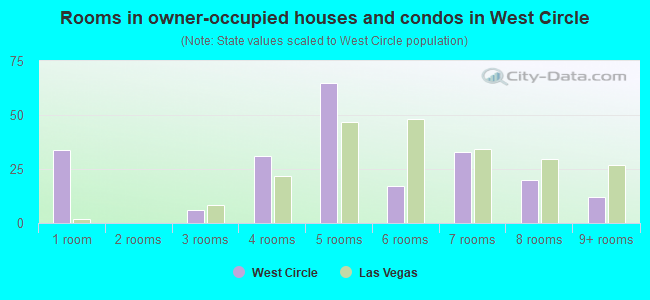
- Rooms in owner-occupied houses and condos in West Circle
- 341 room
- 02 rooms
- 63 rooms
- 314 rooms
- 655 rooms
- 176 rooms
- 337 rooms
- 208 rooms
- 129+ rooms
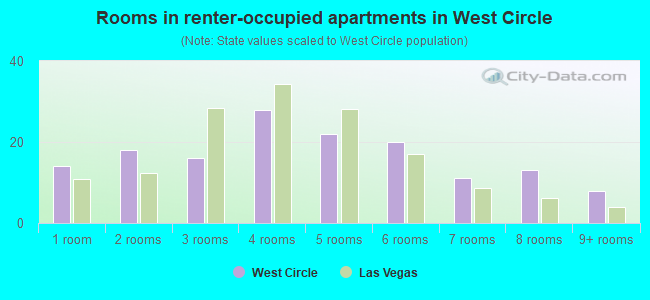
- Rooms in renter-occupied apartments in West Circle
- 141 room
- 182 rooms
- 163 rooms
- 284 rooms
- 225 rooms
- 206 rooms
- 117 rooms
- 138 rooms
- 89+ rooms
Owner-occupied
Renter-occupied
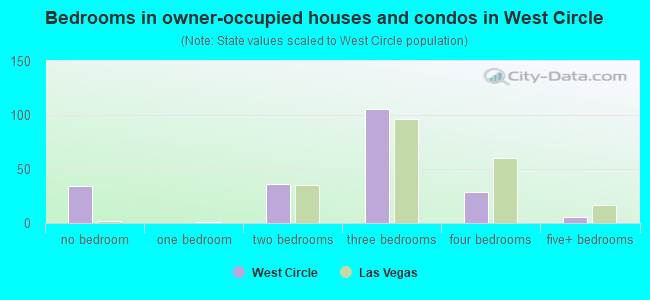
- Bedrooms in owner-occupied houses and condos in West Circle
- 34no bedroom
- 01 bedroom
- 362 bedrooms
- 1063 bedrooms
- 294 bedrooms
- 65+ bedrooms
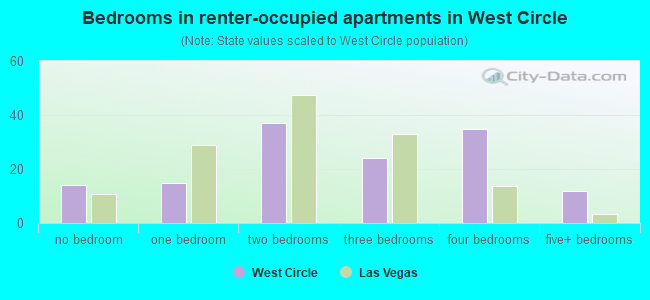
- Bedrooms in renter-occupied apartments in West Circle
- 14no bedroom
- 151 bedroom
- 372 bedrooms
- 243 bedrooms
- 354 bedrooms
- 125+ bedrooms
Average number of cars or other vehicles available in houses/condos:
Average number of cars or other vehicles available in apartments:
| This neighborhood: | 1.8 |
| Las Vegas: | 2.0 |
Average number of cars or other vehicles available in apartments:
| Here: | 2.2 |
| city: | 1.3 |
Percentage of units with a mortgage:
| West Circle: | 67.9% |
| Las Vegas: | 69.3% |
Average estimated value of detached houses in 2022 (99.7% of all units):
| West Circle: | $320,580 |
| Nevada: | $549,327 |
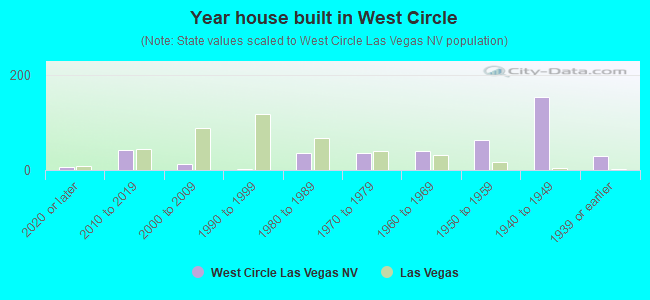
- Year house built in West Circle
- 62020 or later
- 432010 to 2019
- 132000 to 2009
- 31990 to 1999
- 361980 to 1989
- 361970 to 1979
- 411960 to 1969
- 641950 to 1959
- 1531940 to 1949
- 291939 or earlier
City-data.com crime index for city in 2020 (higher means more crime):
| City: | 280.7 |
| U.S. average: | 219.5 |
Travel time to work (commute)
![Travel time to work (commute)]()
- 3Less than 5 minutes
- 385 to 9 minutes
- 8310 to 14 minutes
- 8815 to 19 minutes
- 6720 to 24 minutes
- 725 to 29 minutes
- 5930 to 34 minutes
- 435 to 39 minutes
- 740 to 44 minutes
- 6445 to 59 minutes
- 1160 to 89 minutes
- 490 or more minutes

Means of transportation to work
![Means of transportation to work]()
- 67.0%301Drove a car alone
- 3.8%17Carpooled
- 5.1%23Bus
- 3.1%14Subway or elevated rail
- 0.2%1Taxi
- 1.6%7Motorcycle
- 1.6%7Bicycle
- 10.0%45Walked
- 4.0%18Other means
- 15.6%70Worked at home

Time leaving home to go to work
![Time leaving home to go to work]()
- 2612:00 a.m. to 4:59 a.m.
- 565:00 a.m. to 5:29 a.m.
- 175:30 a.m. to 5:59 a.m.
- 166:00 a.m. to 6:29 a.m.
- 306:30 a.m. to 6:59 a.m.
- 307:00 a.m. to 7:29 a.m.
- 427:30 a.m. to 7:59 a.m.
- 248:00 a.m. to 8:29 a.m.
- 288:30 a.m. to 8:59 a.m.
- 159:00 a.m. to 9:59 a.m.
- 1310:00 a.m. to 10:59 a.m.
- 411:00 a.m. to 11:59 a.m.
- 8112:00 p.m. to 3:59 p.m.
- 414:00 p.m. to 11:59 p.m.

Occupations of males:
- Percentage of males in management occupations (except farmers):
Here: 10.7% city: 9.6%
- Percentage of males in business and financial operations occupations:
Here: 2.4% city: 3.6%
- Percentage of males in computer and mathematical occupations:
Here: 2.2% city: 3.4%
- Percentage of males in architecture and engineering occupations:
Here: 1.6% city: 1.8%
- Percentage of males in legal occupations:
Here: 8.1% city: 0.9%
- Percentage of males in education, training, and library occupations:
Here: 3.3% city: 2.5%
- Percentage of males in arts, design, entertainment, sports, and media occupations:
Here: 4.1% city: 2.5%
- Percentage of males in service occupations:
Here: 35.5% city: 23.3%
- Percentage of males in sales and office occupations:
Here: 6.6% city: 16.6%
- Percentage of males in construction, extraction, and maintenance occupations:
Here: 6.4% city: 10.6%
- Percentage of males in transportation occupations:
Here: 4.5% city: 6.6%
- Percentage of males in material moving occupations:
Here: 10.3% city: 5.4%
Occupations of females:
- Percentage of females in management occupations (except farmers):
Here: 3.4% city: 8.5%
- Percentage of females in business and financial operations occupations:
Here: 2.3% city: 5.7%
- Percentage of females in life, physical, and social science occupations:
Here: 4.2% city: 0.4%
- Percentage of females in community and social services occupations:
Here: 10.7% city: 1.9%
- Percentage of females in legal occupations:
Here: 17.0% city: 1.5%
- Percentage of females in education, training, and library occupations:
Here: 3.9% city: 8.0%
- Percentage of females in arts, design, entertainment, sports, and media occupations:
Here: 1.1% city: 1.8%
- Percentage of females in healthcare practitioners and technical occupations:
Here: 12.0% city: 7.4%
- Percentage of females in service occupations:
Here: 24.6% city: 26.5%
- Percentage of females in sales and office occupations:
Here: 35.4% city: 30.5%
- Percentage of females in transportation occupations:
Here: 2.9% city: 1.6%
- Percentage of females in material moving occupations:
Here: 2.2% city: 2.2%
Percentage of people 16-64 in Armed Forces:
| West Circle: | 0.5% |
| Las Vegas: | 1.0% |
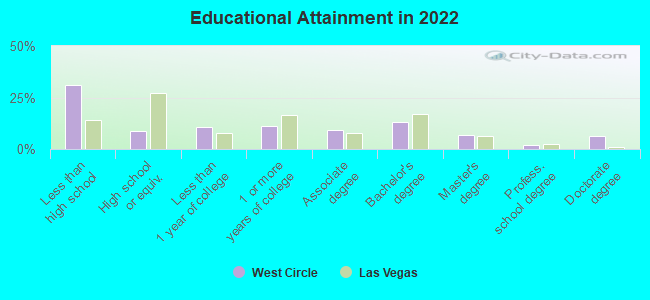
Education in this neighborhood (subdivision or community):
- Percentage of people 3 years and older in K-12 schools:
West Circle: 15.6% Las Vegas: 17.4%
- Percentage of people 3 years and older in undergraduate colleges:
West Circle: 5.7% Las Vegas: 4.2%
- Percentage of people 3 years and older in grad. or professional schools:
West Circle: 6.1% Las Vegas: 1.0%
- Percentage of students K-12 enrolled in private schools:
West Circle: 6.2% Las Vegas: 12.9%
Percentage of population below poverty level:
| West Circle: | 19.2% |
| Las Vegas: | 14.1% |
Median year owner moved in (as recorded in 2022):
Median year renter moved in (as recorded in 2022):
| West Circle: | 2006 |
| Las Vegas: | 2015 |
Median year renter moved in (as recorded in 2022):
| West Circle: | 2017 |
| Las Vegas: | 2020 |
Percentage of married-couple families with both working:
| West Circle: | 128.3% |
| Las Vegas: | 62.0% |
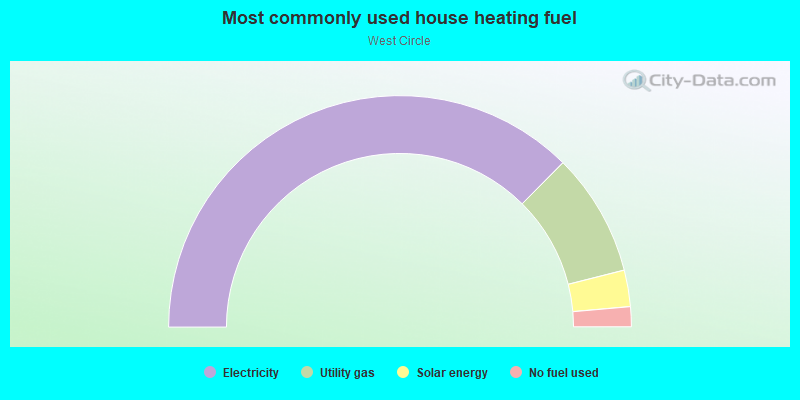
- 74.9%Electricity
- 17.2%Utility gas
- 5.1%Solar energy
- 2.8%No fuel used
Roads and streets:
S Maryland Pkwy
Length: 0.66 miles
Directions: N-S, SE-NW, SW-NE
Address range: 1137 to 1699
Directions: N-S, SE-NW, SW-NE
Address range: 1137 to 1699
E Oakey Blvd
Length: 0.31 miles
Direction: E-W
Address range: 1000 to 1199
Direction: E-W
Address range: 1000 to 1199
S 10th St
Length: 0.30 miles
Direction: N-S
Address range: 1113 to 1699
Direction: N-S
Address range: 1113 to 1699
Franklin Ave
Length: 0.28 miles
Direction: E-W
Address range: 1000 to 1199
Direction: E-W
Address range: 1000 to 1199
Francis Ave
Length: 0.28 miles
Directions: E-W, N-S, SW-NE
Address range: 1000 to 1199
Directions: E-W, N-S, SW-NE
Address range: 1000 to 1199
Norman Ave
Length: 0.25 miles
Direction: E-W
Address range: 1000 to 1199
Direction: E-W
Address range: 1000 to 1199
Bracken Ave
Length: 0.25 miles
Direction: E-W
Address range: 1000 to 1099
Direction: E-W
Address range: 1000 to 1099
Griffith Ave
Length: 0.25 miles
Direction: E-W
Address range: 1000 to 1099
Direction: E-W
Address range: 1000 to 1099
S 11th St
Length: 0.24 miles
Direction: N-S
Address range: 1300 to 1699
Direction: N-S
Address range: 1300 to 1699
Jessica Ave
Length: 0.20 miles
Directions: E-W, N-S, SE-NW
Address range: 1000 to 1199
Directions: E-W, N-S, SE-NW
Address range: 1000 to 1199
Yucca Ave
Length: 0.15 miles
Directions: E-W, N-S
Address range: 1000 to 1107
Directions: E-W, N-S
Address range: 1000 to 1107