Village (The Village) neighborhood in Glendora, California (CA), 91741 detailed profile
Settings
X


Business Search - 14 Million verified businesses
Area: 0.533 square miles
Population: 3,808
Population density:
| Village (The Village): | 7,148 people per square mile |
| Glendora: | 2,721 people per square mile |

- 1,54237.0%Hispanic or Latino
- 1,47935.5%White
- 60314.5%Black
- 2596.2%Asian
- 1884.5%Two or more races
- 751.8%Some other race
- 160.4%Native Hawaiian and Other
Pacific Islander

Distribution of median household income
![Distribution of median household income]()
- 63Less than $10,000
- 207$10,000 to $19,999
- 95$20,000 to $29,999
- 88$30,000 to $39,999
- 98$40,000 to $49,999
- 98$50,000 to $59,999
- 169$60,000 to $74,999
- 189$75,000 to $99,999
- 73$100,000 to $124,999
- 166$125,000 to $149,999
- 199$150,000 to $199,999
- 192$200,000 or more

Distribution of owner-occupied house/condo value
![Distribution of owner-occupied house/condo value]()
- 49Less than $50,000
- 159$50,000 to $99,999
- 30$100,000 to $149,999
- 37$400,000 to $499,999
- 225$500,000 to $749,999
- 348$750,000 to $999,999
- 115$1,000,000 or more

Distribution of rent paid by renters
![Distribution of rent paid by renters]()
- 20Less than $100
- 37$100 to $199
- 267$200 to $299
- 6$700 to $799
- 62$800 to $899
- 8$900 to $999
- 51$1,000 to $1,249
- 196$1,250 to $1,499
- 243$1,500 to $1,999
- 432$2,000 or more

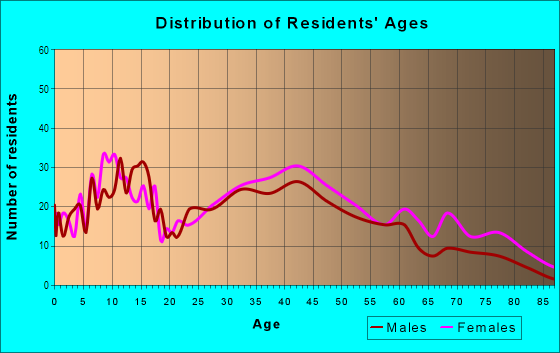
| Males: | 1,803 |
| Females: | 2,005 |
Males:
| This neighborhood: | 39.2 years |
| Whole city: | 39.9 years |
| This neighborhood: | 42.9 years |
| Whole city: | 40.8 years |
Average household size:
| Village (The Village): | 2.9 people |
| Glendora: | 34.0 people |
Percentage of family households:
| Village (The Village): | 49.6% |
| Glendora: | 52.7% |
| Here: | 48.5% |
| Glendora: | 57.8% |
Percentage of married-couple families with children (among all households):
| Village (The Village): | 29.1% |
| Glendora: | 26.1% |
Percentage of single-mother households (among all households):
| Village (The Village): | 5.3% |
| Glendora: | 3.6% |
Percentage of never married males 15 years old and over:
Percentage of never married females 15 years old and over:
| Village (The Village): | 19.3% |
| Glendora: | 17.4% |
Percentage of never married females 15 years old and over:
| Village (The Village): | 15.2% |
| city: | 16.0% |
Percentage of people that speak English not well or not at all:
| Village (The Village): | 1.9% |
| Glendora: | 3.7% |
Percentage of people born in this state:
Percentage of people born in another U.S. state:
Percentage of native residents but born outside the U.S.:
Percentage of foreign born residents:
| Here: | 67.4% |
| Glendora: | 67.2% |
Percentage of people born in another U.S. state:
| Village (The Village): | 16.5% |
| Glendora: | 13.1% |
Percentage of native residents but born outside the U.S.:
| Here: | 1.0% |
| city: | 1.1% |
Percentage of foreign born residents:
| Here: | 15.1% |
| Glendora: | 18.6% |

Owner-occupied
Renter-occupied


- Rooms in owner-occupied houses and condos in Village <
> - 31 room
- 252 rooms
- 643 rooms
- 1064 rooms
- 935 rooms
- 1916 rooms
- 1857 rooms
- 638 rooms
- 839+ rooms

- Rooms in renter-occupied apartments in Village <
> - 1431 room
- 1112 rooms
- 2643 rooms
- 3444 rooms
- 3085 rooms
- 656 rooms
- 357 rooms
- 328 rooms
- 359+ rooms
Owner-occupied
Renter-occupied

- Bedrooms in owner-occupied houses and condos in Village <
> - 3no bedroom
- 531 bedroom
- 1412 bedrooms
- 3623 bedrooms
- 1914 bedrooms
- 435+ bedrooms

- Bedrooms in renter-occupied apartments in Village <
> - 143no bedroom
- 2901 bedroom
- 5542 bedrooms
- 1553 bedrooms
- 224 bedrooms
- 615+ bedrooms
Average number of cars or other vehicles available in houses/condos:
Average number of cars or other vehicles available in apartments:
| This neighborhood: | 2.7 |
| Glendora: | 2.4 |
Average number of cars or other vehicles available in apartments:
| Here: | 2.2 |
| city: | 1.9 |
Percentage of units with a mortgage:
| Village (The Village): | 68.2% |
| Glendora: | 66.7% |
Average estimated value of detached houses in 2022 (57.2% of all units):
| Village (The Village): | $811,774 |
| California: | $988,808 |

- Year house built in Village <
> - 02020 or later
- 2932010 to 2019
- 382000 to 2009
- 821990 to 1999
- 1981980 to 1989
- 1511970 to 1979
- 1921960 to 1969
- 4331950 to 1959
- 1641940 to 1949
- 2681939 or earlier

City-data.com crime index for city in 2020 (higher means more crime):
| City: | 171.1 |
| U.S. average: | 219.5 |
Travel time to work (commute)
![Travel time to work (commute)]()
- 48Less than 5 minutes
- 1075 to 9 minutes
- 7610 to 14 minutes
- 15015 to 19 minutes
- 13820 to 24 minutes
- 7625 to 29 minutes
- 17630 to 34 minutes
- 6535 to 39 minutes
- 10240 to 44 minutes
- 19645 to 59 minutes
- 23060 to 89 minutes
- 7890 or more minutes

Means of transportation to work
![Means of transportation to work]()
- 67.9%1,236Drove a car alone
- 14.8%270Carpooled
- 2.9%52Bus
- 3.9%71Subway or elevated rail
- 3.0%55Long-distance train or commuter rail
- 1.4%26Light rail, streetcar or trolley
- 0.8%14Motorcycle
- 0.7%12Bicycle
- 1.9%35Walked
- 2.0%37Other means
- 11.5%209Worked at home

Time leaving home to go to work
![Time leaving home to go to work]()
- 10312:00 a.m. to 4:59 a.m.
- 1425:00 a.m. to 5:29 a.m.
- 885:30 a.m. to 5:59 a.m.
- 1646:00 a.m. to 6:29 a.m.
- 926:30 a.m. to 6:59 a.m.
- 1777:00 a.m. to 7:29 a.m.
- 1147:30 a.m. to 7:59 a.m.
- 2208:00 a.m. to 8:29 a.m.
- 718:30 a.m. to 8:59 a.m.
- 1329:00 a.m. to 9:59 a.m.
- 1410:00 a.m. to 10:59 a.m.
- 1611:00 a.m. to 11:59 a.m.
- 6012:00 p.m. to 3:59 p.m.
- 544:00 p.m. to 11:59 p.m.

Occupations of males:
- Percentage of males in management occupations (except farmers):
Here: 17.3% city: 13.1%
- Percentage of males in business and financial operations occupations:
Here: 5.1% city: 5.5%
- Percentage of males in computer and mathematical occupations:
Here: 1.1% city: 3.5%
- Percentage of males in architecture and engineering occupations:
Here: 3.1% city: 3.6%
- Percentage of males in life, physical, and social science occupations:
Here: 1.3% city: 1.4%
- Percentage of males in community and social services occupations:
Here: 2.3% city: 1.6%
- Percentage of males in education, training, and library occupations:
Here: 5.1% city: 4.0%
- Percentage of males in arts, design, entertainment, sports, and media occupations:
Here: 4.1% city: 4.2%
- Percentage of males in healthcare practitioners and technical occupations:
Here: 1.9% city: 4.6%
- Percentage of males in service occupations:
Here: 14.8% city: 12.0%
- Percentage of males in sales and office occupations:
Here: 15.9% city: 18.6%
- Percentage of males in construction, extraction, and maintenance occupations:
Here: 9.3% city: 9.3%
- Percentage of males in production occupations:
Here: 3.2% city: 4.9%
- Percentage of males in transportation occupations:
Here: 5.6% city: 4.0%
- Percentage of males in material moving occupations:
Here: 4.8% city: 3.9%
Occupations of females:
- Percentage of females in management occupations (except farmers):
Here: 7.5% city: 9.7%
- Percentage of females in business and financial operations occupations:
Here: 10.4% city: 5.5%
- Percentage of females in computer and mathematical occupations:
Here: 1.4% city: 1.3%
- Percentage of females in life, physical, and social science occupations:
Here: 2.1% city: 0.9%
- Percentage of females in community and social services occupations:
Here: 4.8% city: 2.3%
- Percentage of females in education, training, and library occupations:
Here: 10.6% city: 10.6%
- Percentage of females in arts, design, entertainment, sports, and media occupations:
Here: 2.3% city: 2.2%
- Percentage of females in healthcare practitioners and technical occupations:
Here: 8.4% city: 11.0%
- Percentage of females in service occupations:
Here: 13.2% city: 14.7%
- Percentage of females in sales and office occupations:
Here: 32.4% city: 33.7%
- Percentage of females in production occupations:
Here: 1.7% city: 2.4%
- Percentage of females in material moving occupations:
Here: 3.2% city: 3.2%
Education in this neighborhood (subdivision or community):
- Percentage of people 3 years and older in K-12 schools:
Village (The Village): 20.1% Glendora: 17.2%
- Percentage of people 3 years and older in undergraduate colleges:
Village (The Village): 6.6% Glendora: 7.5%
- Percentage of people 3 years and older in grad. or professional schools:
Village (The Village): 4.2% Glendora: 1.4%
- Percentage of students K-12 enrolled in private schools:
Village (The Village): 51.6% Glendora: 14.9%
Percentage of population below poverty level:
| Village (The Village): | 6.5% |
| Glendora: | 7.2% |
Median year owner moved in (as recorded in 2022):
| Village (The Village): | 1999 |
| Glendora: | 2005 |
Percentage of married-couple families with both working:
| Village (The Village): | 87.7% |
| Glendora: | 65.2% |

- 79.8%Utility gas
- 10.6%Electricity
- 3.7%Bottled, tank, or LP gas
- 2.2%Solar energy
- 2.0%No fuel used
- 1.6%Coal or coke
Roads and streets:
E Bennett Ave
Length: 0.91 miles
Direction: E-W
Address range: 100 to 799
Direction: E-W
Address range: 100 to 799
E Foothill Blvd
Length: 0.88 miles
Direction: E-W
Address range: 100 to 753
Direction: E-W
Address range: 100 to 753
E Whitcomb Ave
Length: 0.73 miles
Direction: E-W
Address range: 100 to 699
Direction: E-W
Address range: 100 to 699
E Leadora Ave
Length: 0.72 miles
Direction: E-W
Address range: 100 to 699
Direction: E-W
Address range: 100 to 699
Sycamore Ave
Length: 0.60 miles
Direction: E-W
Address range: 400 to 799
Direction: E-W
Address range: 400 to 799
N Glendora Ave
Length: 0.50 miles
Direction: N-S
Address range: 100 to 499
Direction: N-S
Address range: 100 to 499
N Live Oak Ave
Length: 0.50 miles
Direction: N-S
Address range: 100 to 499
Direction: N-S
Address range: 100 to 499
N Wabash Ave
Length: 0.50 miles
Direction: N-S
Address range: 100 to 499
Direction: N-S
Address range: 100 to 499
N Cullen Ave
Length: 0.50 miles
Direction: N-S
Address range: 100 to 499
Direction: N-S
Address range: 100 to 499
N Vista Bonita Ave
Length: 0.50 miles
Direction: N-S
Address range: 100 to 499
Direction: N-S
Address range: 100 to 499
N Vermont Ave
Length: 0.46 miles
Direction: N-S
Address range: 100 to 499
Direction: N-S
Address range: 100 to 499
E Dalton Ave
Length: 0.45 miles
Directions: E-W, SW-NE
Address range: 400 to 699
Directions: E-W, SW-NE
Address range: 400 to 699
E Cypress Ave
Length: 0.44 miles
Directions: E-W, SW-NE
Address range: 500 to 799
Directions: E-W, SW-NE
Address range: 500 to 799
E Meda Ave
Length: 0.41 miles
Directions: E-W, N-S, SE-NW, SW-NE
Address range: 100 to 699
Directions: E-W, N-S, SE-NW, SW-NE
Address range: 100 to 699
N Minnesota Ave
Length: 0.40 miles
Direction: N-S
Address range: 100 to 499
Direction: N-S
Address range: 100 to 499
E Comstock Ave
Length: 0.30 miles
Direction: E-W
Address range: 500 to 699
Direction: E-W
Address range: 500 to 699
E Mountain View Ave
Length: 0.30 miles
Direction: E-W
Address range: 500 to 699
Direction: E-W
Address range: 500 to 699
N Pasadena Ave
Length: 0.19 miles
Direction: N-S
Address range: 100 to 499
Direction: N-S
Address range: 100 to 499
E Bougainvillea Ln
Length: 0.18 miles
Directions: E-W, N-S, SE-NW, SW-NE
Address range: 400 to 599
Directions: E-W, N-S, SE-NW, SW-NE
Address range: 400 to 599
Lesterwest Way
Length: 0.11 miles
Direction: E-W
Address range: 500 to 599
Direction: E-W
Address range: 500 to 599
W Bennett Ave
Length: 0.09 miles
Direction: E-W
Address range: 100 to 199
Direction: E-W
Address range: 100 to 199
W Meda Ave
Length: 0.09 miles
Direction: E-W
Address range: 100 to 199
Direction: E-W
Address range: 100 to 199
S Glenwood Ave
Length: 0.09 miles
Direction: N-S
Address range: 100 to 178
Direction: N-S
Address range: 100 to 178
W Whitcomb Ave
Length: 0.09 miles
Direction: E-W
Address range: 100 to 199
Direction: E-W
Address range: 100 to 199
W Foothill Blvd
Length: 0.09 miles
Direction: E-W
Address range: 100 to 199
Direction: E-W
Address range: 100 to 199
N Glenwood Ave
Length: 0.09 miles
Directions: N-S, SE-NW
Address range: 300 to 399
Directions: N-S, SE-NW
Address range: 300 to 399
W Leadora Ave
Length: 0.09 miles
Direction: E-W
Address range: 100 to 199
Direction: E-W
Address range: 100 to 199
S Cullen Ave
Length: 0.07 miles
Direction: N-S
Address range: 100 to 139
Direction: N-S
Address range: 100 to 139
S Minnesota Ave
Length: 0.06 miles
Direction: N-S
Address range: 100 to 135
Direction: N-S
Address range: 100 to 135
S Vermont Ave
Length: 0.04 miles
Direction: N-S
Address range: 100 to 129
Direction: N-S
Address range: 100 to 129
S Vista Bonita Ave
Length: 0.04 miles
Direction: N-S
Address range: 100 to 127
Direction: N-S
Address range: 100 to 127
S Wabash Ave
Length: 0.03 miles
Direction: N-S
Address range: 100 to 127
Direction: N-S
Address range: 100 to 127
Hawk Ln
Length: 0.03 miles
Direction: SE-NW
Address range: 300 to 399
Direction: SE-NW
Address range: 300 to 399
Other features:
Little Dalton Wash
Length: 0.88 miles
Directions: E-W, SW-NE
Directions: E-W, SW-NE