Tiger Tail neighborhood in Orinda, California (CA), 94563 detailed profile
Settings
X


Business Search - 14 Million verified businesses
Area: 0.425 square miles
Population: 677
Population density:
| Tiger Tail: | 1,592 people per square mile |
| Orinda: | 1,547 people per square mile |

- 47569.4%White
- 7611.1%Two or more races
- 7010.2%Asian
- 405.8%Hispanic or Latino
- 182.6%Some other race
- 50.7%Black

Median household income in 2022:
| Tiger Tail: | $235,279 |
| Orinda: | $250,001 |
Distribution of median household income
![Distribution of median household income]()
- 25Less than $10,000
- 79$10,000 to $19,999
- 17$20,000 to $29,999
- 5$30,000 to $39,999
- 7$40,000 to $49,999
- 8$50,000 to $59,999
- 10$60,000 to $74,999
- 8$75,000 to $99,999
- 7$100,000 to $124,999
- 21$125,000 to $149,999
- 35$150,000 to $199,999
- 165$200,000 or more

Distribution of owner-occupied house/condo value
![Distribution of owner-occupied house/condo value]()
- 10Less than $50,000
- 6$100,000 to $149,999
- 2$150,000 to $199,999
- 3$300,000 to $399,999
- 11$400,000 to $499,999
- 10$500,000 to $749,999
- 18$750,000 to $999,999
- 235$1,000,000 or more

Distribution of rent paid by renters
![Distribution of rent paid by renters]()
- 9$200 to $299
- 65$300 to $399
- 20$400 to $499
- 15$800 to $899
- 6$1,500 to $1,999
- 17$2,000 or more

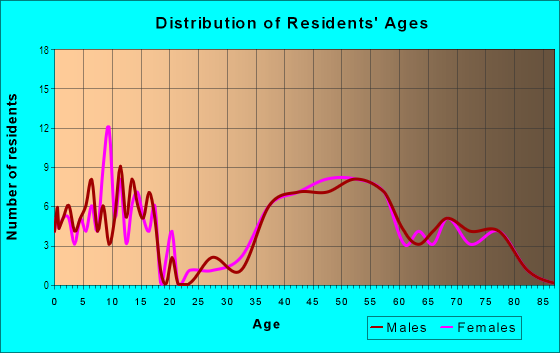
| Males: | 334 |
| Females: | 342 |
Males:
| This neighborhood: | 53.3 years |
| Whole city: | 50.3 years |
| This neighborhood: | 50.3 years |
| Whole city: | 48.0 years |
Average household size:
| Tiger Tail: | 2.5 people |
| Orinda: | 2.6 people |
Percentage of family households:
| Tiger Tail: | 37.6% |
| Orinda: | 48.6% |
| Here: | 59.6% |
| Orinda: | 67.8% |
Percentage of married-couple families with children (among all households):
| Tiger Tail: | 42.2% |
| Orinda: | 36.7% |
Percentage of single-mother households (among all households):
| Tiger Tail: | 7.1% |
| Orinda: | 0.7% |
Percentage of never married males 15 years old and over:
Percentage of never married females 15 years old and over:
| Tiger Tail: | 17.2% |
| Orinda: | 11.4% |
Percentage of never married females 15 years old and over:
| Tiger Tail: | 12.6% |
| city: | 10.3% |
Percentage of people that speak English not well or not at all:
| Tiger Tail: | 1.8% |
| Orinda: | 0.9% |
Percentage of people born in this state:
Percentage of people born in another U.S. state:
Percentage of native residents but born outside the U.S.:
Percentage of foreign born residents:
| Here: | 46.0% |
| Orinda: | 51.1% |
Percentage of people born in another U.S. state:
| Tiger Tail: | 36.6% |
| Orinda: | 29.1% |
Percentage of native residents but born outside the U.S.:
| Here: | 0.5% |
| city: | 1.5% |
Percentage of foreign born residents:
| Here: | 16.9% |
| Orinda: | 18.3% |

Owner-occupied
Renter-occupied


- Rooms in owner-occupied houses and condos in Tiger Tail
- 01 room
- 02 rooms
- 83 rooms
- 144 rooms
- 165 rooms
- 136 rooms
- 307 rooms
- 308 rooms
- 1439+ rooms

- Rooms in renter-occupied apartments in Tiger Tail
- 51 room
- 302 rooms
- 763 rooms
- 354 rooms
- 25 rooms
- 86 rooms
- 107 rooms
- 18 rooms
- 19+ rooms
Owner-occupied
Renter-occupied

- Bedrooms in owner-occupied houses and condos in Tiger Tail
- 0no bedroom
- 01 bedroom
- 142 bedrooms
- 583 bedrooms
- 954 bedrooms
- 755+ bedrooms

- Bedrooms in renter-occupied apartments in Tiger Tail
- 5no bedroom
- 1061 bedroom
- 352 bedrooms
- 83 bedrooms
- 14 bedrooms
- 15+ bedrooms
Average number of cars or other vehicles available in houses/condos:
Average number of cars or other vehicles available in apartments:
| This neighborhood: | 1.5 |
| Orinda: | 2.3 |
Average number of cars or other vehicles available in apartments:
| Here: | |
| city: |
Percentage of units with a mortgage:
| Tiger Tail: | 57.4% |
| Orinda: | 70.5% |
Average estimated value of detached houses in 2022 (90.0% of all units):
| Tiger Tail: | $2,434,888 |
| California: | $988,808 |

- Year house built in Tiger Tail
- 02020 or later
- 242010 to 2019
- 402000 to 2009
- 31990 to 1999
- 231980 to 1989
- 591970 to 1979
- 621960 to 1969
- 441950 to 1959
- 351940 to 1949
- 281939 or earlier

City-data.com crime index for city in 2020 (higher means more crime):
| City: | 42.7 |
| U.S. average: | 219.5 |
Travel time to work (commute)
![Travel time to work (commute)]()
- 135 to 9 minutes
- 1710 to 14 minutes
- 1915 to 19 minutes
- 2820 to 24 minutes
- 1025 to 29 minutes
- 1330 to 34 minutes
- 135 to 39 minutes
- 640 to 44 minutes
- 2945 to 59 minutes
- 4260 to 89 minutes
- 490 or more minutes

Means of transportation to work
![Means of transportation to work]()
- 48.8%142Drove a car alone
- 2.4%7Carpooled
- 2.4%7Bus
- 6.2%18Subway or elevated rail
- 1.7%5Long-distance train or commuter rail
- 3.8%11Light rail, streetcar or trolley
- 3.1%9Walked
- 2.4%7Other means
- 36.5%106Worked at home

Time leaving home to go to work
![Time leaving home to go to work]()
- 612:00 a.m. to 4:59 a.m.
- 125:00 a.m. to 5:29 a.m.
- 45:30 a.m. to 5:59 a.m.
- 216:00 a.m. to 6:29 a.m.
- 136:30 a.m. to 6:59 a.m.
- 237:00 a.m. to 7:29 a.m.
- 227:30 a.m. to 7:59 a.m.
- 288:00 a.m. to 8:29 a.m.
- 228:30 a.m. to 8:59 a.m.
- 289:00 a.m. to 9:59 a.m.
- 1410:00 a.m. to 10:59 a.m.
- 912:00 p.m. to 3:59 p.m.
- 44:00 p.m. to 11:59 p.m.

Occupations of males:
- Percentage of males in management occupations (except farmers):
Here: 25.2% city: 34.1%
- Percentage of males in business and financial operations occupations:
Here: 4.5% city: 10.7%
- Percentage of males in computer and mathematical occupations:
Here: 6.1% city: 4.2%
- Percentage of males in architecture and engineering occupations:
Here: 2.5% city: 4.1%
- Percentage of males in life, physical, and social science occupations:
Here: 5.1% city: 4.8%
- Percentage of males in legal occupations:
Here: 13.6% city: 6.7%
- Percentage of males in education, training, and library occupations:
Here: 1.2% city: 2.6%
- Percentage of males in arts, design, entertainment, sports, and media occupations:
Here: 3.7% city: 4.0%
- Percentage of males in service occupations:
Here: 7.4% city: 6.0%
- Percentage of males in sales and office occupations:
Here: 13.4% city: 11.4%
- Percentage of males in production occupations:
Here: 2.8% city: 0.4%
- Percentage of males in transportation occupations:
Here: 7.2% city: 3.4%
Occupations of females:
- Percentage of females in management occupations (except farmers):
Here: 21.4% city: 15.1%
- Percentage of females in business and financial operations occupations:
Here: 6.3% city: 10.2%
- Percentage of females in computer and mathematical occupations:
Here: 4.1% city: 5.9%
- Percentage of females in life, physical, and social science occupations:
Here: 3.4% city: 5.4%
- Percentage of females in community and social services occupations:
Here: 8.7% city: 4.3%
- Percentage of females in legal occupations:
Here: 4.4% city: 7.8%
- Percentage of females in education, training, and library occupations:
Here: 17.5% city: 13.6%
- Percentage of females in arts, design, entertainment, sports, and media occupations:
Here: 13.4% city: 8.8%
- Percentage of females in healthcare practitioners and technical occupations:
Here: 1.9% city: 11.5%
- Percentage of females in service occupations:
Here: 4.6% city: 7.1%
- Percentage of females in sales and office occupations:
Here: 14.3% city: 8.1%
Education in this neighborhood (subdivision or community):
- Percentage of people 3 years and older in K-12 schools:
Tiger Tail: 24.2% Orinda: 20.8%
- Percentage of people 3 years and older in undergraduate colleges:
Tiger Tail: 8.8% Orinda: 3.5%
- Percentage of people 3 years and older in grad. or professional schools:
Tiger Tail: 5.3% Orinda: 1.3%
- Percentage of students K-12 enrolled in private schools:
Tiger Tail: 19.6% Orinda: 7.3%
Percentage of population below poverty level:
| Tiger Tail: | 3.4% |
| Orinda: | 2.1% |
Median year owner moved in (as recorded in 2022):
| Tiger Tail: | 2007 |
| Orinda: | 2005 |
Percentage of married-couple families with both working:
| Tiger Tail: | 76.2% |
| Orinda: | 71.9% |

- 76.6%Utility gas
- 14.5%Electricity
- 5.1%No fuel used
- 1.9%Solar energy
- 1.9%Other fuel
Roads and streets:
la Espiral Rd
Length: 0.83 miles
Directions: E-W, N-S, SE-NW, SW-NE
Address range: 100 to 299
Directions: E-W, N-S, SE-NW, SW-NE
Address range: 100 to 299
Las Vegas Rd
Length: 0.77 miles
Directions: E-W, N-S, SE-NW, SW-NE
Address range: 1 to 199
Directions: E-W, N-S, SE-NW, SW-NE
Address range: 1 to 199
St Stephens Dr
Length: 0.61 miles
Directions: E-W, N-S, SE-NW, SW-NE
Address range: 1 to 99
Directions: E-W, N-S, SE-NW, SW-NE
Address range: 1 to 99
el Gavilan Ct
Length: 0.60 miles
Directions: E-W, SW-NE
Address range: 1 to 99
Directions: E-W, SW-NE
Address range: 1 to 99
la Campana Rd
Length: 0.54 miles
Directions: E-W, N-S, SE-NW, SW-NE
Address range: 1 to 99
Directions: E-W, N-S, SE-NW, SW-NE
Address range: 1 to 99
Las Palomas
Length: 0.31 miles
Directions: E-W, N-S, SW-NE
Address range: 1 to 99
Directions: E-W, N-S, SW-NE
Address range: 1 to 99
Cam Sobrante
Length: 0.22 miles
Directions: N-S, SE-NW, SW-NE
Address range: 414 to 449
Directions: N-S, SE-NW, SW-NE
Address range: 414 to 449
Dias Dorados
Length: 0.22 miles
Directions: E-W, N-S, SE-NW, SW-NE
Address range: 1 to 99
Directions: E-W, N-S, SE-NW, SW-NE
Address range: 1 to 99
Los Dedos Rd
Length: 0.20 miles
Directions: E-W, N-S, SE-NW, SW-NE
Address range: 1 to 99
Directions: E-W, N-S, SE-NW, SW-NE
Address range: 1 to 99
la Cintilla
Length: 0.18 miles
Directions: E-W, N-S, SE-NW, SW-NE
Address range: 1 to 99
Directions: E-W, N-S, SE-NW, SW-NE
Address range: 1 to 99
el Sereno
Length: 0.17 miles
Directions: N-S, SE-NW, SW-NE
Address range: 1 to 99
Directions: N-S, SE-NW, SW-NE
Address range: 1 to 99
el Verano Rd
Length: 0.14 miles
Directions: E-W, SW-NE
Address range: 1 to 49
Directions: E-W, SW-NE
Address range: 1 to 49
Aqua Vis
Length: 0.12 miles
Directions: E-W, N-S, SE-NW, SW-NE
Address range: 1 to 99
Directions: E-W, N-S, SE-NW, SW-NE
Address range: 1 to 99
el Pulgar
Length: 0.11 miles
Directions: E-W, N-S, SE-NW
Address range: 1 to 99
Directions: E-W, N-S, SE-NW
Address range: 1 to 99
el Companero
Length: 0.09 miles
Directions: E-W, N-S, SE-NW, SW-NE
Address range: 1 to 16
Directions: E-W, N-S, SE-NW, SW-NE
Address range: 1 to 16
el Nido Ranch Rd
Length: 0.08 miles
Direction: E-W
Address range: 4354 to 4399
Direction: E-W
Address range: 4354 to 4399
Las Vegas Ct
Length: 0.06 miles
Directions: N-S, SE-NW, SW-NE
Address range: 1 to 99
Directions: N-S, SE-NW, SW-NE
Address range: 1 to 99
la Vuelta
Length: 0.05 miles
Directions: N-S, SE-NW
Address range: 29 to 99
Directions: N-S, SE-NW
Address range: 29 to 99
Mira Flores
Length: 0.04 miles
Direction: N-S
Address range: 1 to 99
Direction: N-S
Address range: 1 to 99
la Punta
Length: 0.04 miles
Direction: SE-NW
Address range: 1 to 99
Direction: SE-NW
Address range: 1 to 99
St Stephens Cir
Length: 0.04 miles
Direction: N-S
Address range: 1 to 99
Direction: N-S
Address range: 1 to 99
Desoto Ct
Length: 0.03 miles
Direction: SW-NE
Address range: 1 to 29
Direction: SW-NE
Address range: 1 to 29