Sterling Terrace neighborhood in South San Francisco, California (CA), 94080 detailed profile
Settings
X


Business Search - 14 Million verified businesses
Area: 0.060 square miles
Population: 855
Population density:
| Sterling Terrace: | 14,159 people per square mile |
| South San Francisco: | 7,272 people per square mile |

- 41045.6%Hispanic or Latino
- 25828.7%Asian
- 10812.0%Black
- 778.6%White
- 262.9%Native Hawaiian and Other
Pacific Islander - 121.3%Some other race
- 80.9%Two or more races

Distribution of median household income
![Distribution of median household income]()
- 22Less than $10,000
- 19$10,000 to $19,999
- 43$20,000 to $29,999
- 11$30,000 to $39,999
- 42$40,000 to $49,999
- 5$50,000 to $59,999
- 36$60,000 to $74,999
- 58$75,000 to $99,999
- 20$100,000 to $124,999
- 23$125,000 to $149,999
- 46$150,000 to $199,999
- 19$200,000 or more

Distribution of owner-occupied house/condo value
![Distribution of owner-occupied house/condo value]()
- 7$400,000 to $499,999
- 11$500,000 to $749,999
- 25$750,000 to $999,999
- 81$1,000,000 or more

Distribution of rent paid by renters
![Distribution of rent paid by renters]()
- 20$300 to $399
- 15$600 to $699
- 29$700 to $799
- 7$800 to $899
- 6$900 to $999
- 12$1,000 to $1,249
- 10$1,250 to $1,499
- 24$1,500 to $1,999
- 92$2,000 or more

Median rent in 2022:
| Sterling Terrace: | $2,154 |
| South San Francisco: | $2,001 |
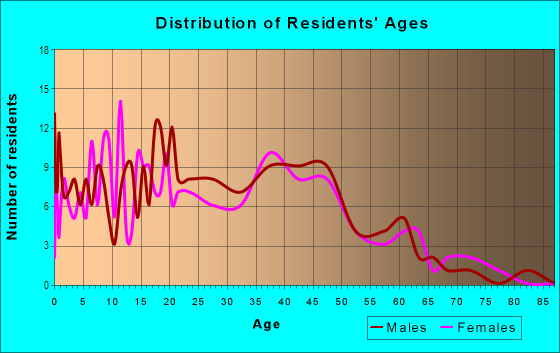
| Males: | 400 |
| Females: | 455 |
Males:
| This neighborhood: | 43.8 years |
| Whole city: | 41.5 years |
| This neighborhood: | 39.4 years |
| Whole city: | 43.2 years |
Average household size:
| Sterling Terrace: | 3.4 people |
| South San Francisco: | 2.9 people |
Percentage of family households:
| Sterling Terrace: | 35.4% |
| South San Francisco: | 47.2% |
| Here: | 31.2% |
| South San Francisco: | 53.8% |
Percentage of married-couple families with children (among all households):
| Sterling Terrace: | 15.9% |
| South San Francisco: | 27.1% |
Percentage of single-mother households (among all households):
| Sterling Terrace: | 15.2% |
| South San Francisco: | 4.2% |
Percentage of never married males 15 years old and over:
Percentage of never married females 15 years old and over:
| Sterling Terrace: | 17.5% |
| South San Francisco: | 19.8% |
Percentage of never married females 15 years old and over:
| Sterling Terrace: | 17.1% |
| city: | 16.1% |
Percentage of people that speak English not well or not at all:
| Sterling Terrace: | 6.6% |
| South San Francisco: | 7.5% |
Percentage of people born in this state:
Percentage of people born in another U.S. state:
Percentage of native residents but born outside the U.S.:
Percentage of foreign born residents:
| Here: | 51.4% |
| South San Francisco: | 50.4% |
Percentage of people born in another U.S. state:
| Sterling Terrace: | 5.0% |
| South San Francisco: | 8.6% |
Percentage of native residents but born outside the U.S.:
| Here: | 1.2% |
| city: | 2.1% |
Percentage of foreign born residents:
| Here: | 42.5% |
| South San Francisco: | 38.9% |

Owner-occupied
Renter-occupied


- Rooms in owner-occupied houses and condos in Sterling Terrace
- 01 room
- 02 rooms
- 103 rooms
- 264 rooms
- 395 rooms
- 126 rooms
- 137 rooms
- 108 rooms
- 99+ rooms

- Rooms in renter-occupied apartments in Sterling Terrace
- 241 room
- 142 rooms
- 163 rooms
- 784 rooms
- 95 rooms
- 186 rooms
- 57 rooms
- 18 rooms
- 09+ rooms
Owner-occupied
Renter-occupied

- Bedrooms in owner-occupied houses and condos in Sterling Terrace
- 0no bedroom
- 101 bedroom
- 62 bedrooms
- 773 bedrooms
- 194 bedrooms
- 95+ bedrooms

- Bedrooms in renter-occupied apartments in Sterling Terrace
- 24no bedroom
- 301 bedroom
- 832 bedrooms
- 163 bedrooms
- 134 bedrooms
- 05+ bedrooms
Average number of cars or other vehicles available in houses/condos:
Average number of cars or other vehicles available in apartments:
| This neighborhood: | 2.3 |
| South San Francisco: | 2.3 |
Average number of cars or other vehicles available in apartments:
| Here: | 1.6 |
| city: | 1.6 |
Percentage of units with a mortgage:
| Sterling Terrace: | 54.0% |
| South San Francisco: | 66.6% |
Average estimated value of detached houses in 2022 (42.2% of all units):
| Sterling Terrace: | $1,191,894 |
| California: | $988,808 |

- Year house built in Sterling Terrace
- 02020 or later
- 52010 to 2019
- 82000 to 2009
- 51990 to 1999
- 291980 to 1989
- 1241970 to 1979
- 111960 to 1969
- 591950 to 1959
- 321940 to 1949
- 241939 or earlier

City-data.com crime index for city in 2020 (higher means more crime):
| City: | 182.6 |
| U.S. average: | 219.5 |
Travel time to work (commute)
![Travel time to work (commute)]()
- 115 to 9 minutes
- 8610 to 14 minutes
- 6515 to 19 minutes
- 6020 to 24 minutes
- 3025 to 29 minutes
- 6930 to 34 minutes
- 1035 to 39 minutes
- 1940 to 44 minutes
- 1745 to 59 minutes
- 3960 to 89 minutes
- 290 or more minutes

Means of transportation to work
![Means of transportation to work]()
- 62.9%253Drove a car alone
- 15.2%61Carpooled
- 12.2%49Bus
- 0.7%3Subway or elevated rail
- 0.7%3Long-distance train or commuter rail
- 1.2%5Bicycle
- 1.5%6Walked
- 0.5%2Other means
- 5.5%22Worked at home

Time leaving home to go to work
![Time leaving home to go to work]()
- 1112:00 a.m. to 4:59 a.m.
- 325:00 a.m. to 5:29 a.m.
- 225:30 a.m. to 5:59 a.m.
- 276:00 a.m. to 6:29 a.m.
- 336:30 a.m. to 6:59 a.m.
- 507:00 a.m. to 7:29 a.m.
- 467:30 a.m. to 7:59 a.m.
- 748:00 a.m. to 8:29 a.m.
- 148:30 a.m. to 8:59 a.m.
- 329:00 a.m. to 9:59 a.m.
- 1510:00 a.m. to 10:59 a.m.
- 611:00 a.m. to 11:59 a.m.
- 4412:00 p.m. to 3:59 p.m.
- 254:00 p.m. to 11:59 p.m.

Occupations of males:
- Percentage of males in management occupations (except farmers):
Here: 1.4% city: 10.8%
- Percentage of males in business and financial operations occupations:
Here: 8.0% city: 7.1%
- Percentage of males in computer and mathematical occupations:
Here: 2.4% city: 6.1%
- Percentage of males in education, training, and library occupations:
Here: 10.9% city: 1.6%
- Percentage of males in healthcare practitioners and technical occupations:
Here: 2.6% city: 4.2%
- Percentage of males in service occupations:
Here: 40.8% city: 16.0%
- Percentage of males in sales and office occupations:
Here: 16.7% city: 15.7%
- Percentage of males in construction, extraction, and maintenance occupations:
Here: 14.7% city: 6.7%
- Percentage of males in transportation occupations:
Here: 2.1% city: 6.1%
- Percentage of males in material moving occupations:
Here: 2.9% city: 5.5%
Occupations of females:
- Percentage of females in management occupations (except farmers):
Here: 6.3% city: 10.6%
- Percentage of females in business and financial operations occupations:
Here: 5.0% city: 7.8%
- Percentage of females in computer and mathematical occupations:
Here: 2.4% city: 2.2%
- Percentage of females in education, training, and library occupations:
Here: 7.6% city: 4.7%
- Percentage of females in healthcare practitioners and technical occupations:
Here: 30.6% city: 10.7%
- Percentage of females in service occupations:
Here: 12.2% city: 20.3%
- Percentage of females in sales and office occupations:
Here: 38.2% city: 32.1%
- Percentage of females in production occupations:
Here: 1.1% city: 2.5%
Education in this neighborhood (subdivision or community):
- Percentage of people 3 years and older in K-12 schools:
Sterling Terrace: 12.6% South San Francisco: 13.0%
- Percentage of people 3 years and older in undergraduate colleges:
Sterling Terrace: 11.1% South San Francisco: 6.2%
- Percentage of people 3 years and older in grad. or professional schools:
Sterling Terrace: 1.0% South San Francisco: 1.3%
- Percentage of students K-12 enrolled in private schools:
Sterling Terrace: 21.4% South San Francisco: 21.0%
Percentage of population below poverty level:
| Sterling Terrace: | 12.7% |
| South San Francisco: | 6.8% |
Median year owner moved in (as recorded in 2022):
Median year renter moved in (as recorded in 2022):
| Sterling Terrace: | 1996 |
| South San Francisco: | 2003 |
Median year renter moved in (as recorded in 2022):
| Sterling Terrace: | 2012 |
| South San Francisco: | 2015 |
Percentage of married-couple families with both working:
| Sterling Terrace: | 528.4% |
| South San Francisco: | 76.4% |

- 56.7%Utility gas
- 32.3%Electricity
- 6.8%No fuel used
- 2.1%Bottled, tank, or LP gas
- 2.1%Solar energy
Roads and streets:
Leo Cir
Length: 0.12 miles
Directions: E-W, SE-NW
Address range: 1 to 99
Directions: E-W, SE-NW
Address range: 1 to 99
N Spruce Ave
Length: 0.07 miles
Directions: N-S, SW-NE
Address range: 138 to 161
Directions: N-S, SW-NE
Address range: 138 to 161
Damonte Ct
Length: 0.06 miles
Directions: E-W, N-S, SE-NW
Address range: 1 to 99
Directions: E-W, N-S, SE-NW
Address range: 1 to 99
Randolph Ave
Length: 0.06 miles
Direction: E-W
Address range: 400 to 499
Direction: E-W
Address range: 400 to 499