St Marys Square neighborhood in San Francisco, California (CA), 94110 detailed profile
Settings
X


Business Search - 14 Million verified businesses
Area: 0.022 square miles
Population: 429
Population density:
| St Marys Square: | 19,248 people per square mile |
| San Francisco: | 17,313 people per square mile |

- 15436.1%Hispanic or Latino
- 9823.0%Asian
- 8620.1%Black
- 5412.6%White
- 317.3%Two or more races
- 20.5%American Indian
- 20.5%Some other race

Median household income in 2022:
| St Marys Square: | $124,698 |
| San Francisco: | $136,692 |
Distribution of median household income
![Distribution of median household income]()
- 1Less than $10,000
- 16$10,000 to $19,999
- 14$20,000 to $29,999
- 1$40,000 to $49,999
- 6$50,000 to $59,999
- 11$60,000 to $74,999
- 2$75,000 to $99,999
- 11$100,000 to $124,999
- 10$125,000 to $149,999
- 14$150,000 to $199,999
- 35$200,000 or more

Distribution of owner-occupied house/condo value
![Distribution of owner-occupied house/condo value]()
- 2Less than $50,000
- 1$100,000 to $149,999
- 1$300,000 to $399,999
- 3$500,000 to $749,999
- 8$750,000 to $999,999
- 67$1,000,000 or more

Distribution of rent paid by renters
![Distribution of rent paid by renters]()
- 7$300 to $399
- 5$700 to $799
- 6$1,000 to $1,249
- 2$1,250 to $1,499
- 5$1,500 to $1,999
- 17$2,000 or more

Median rent in 2022:
| St Marys Square: | $1,727 |
| San Francisco: | $2,001 |
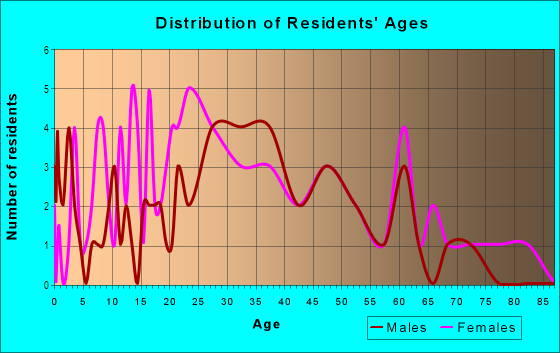
| Males: | 258 |
| Females: | 170 |
Males:
| This neighborhood: | 37.6 years |
| Whole city: | 40.3 years |
| This neighborhood: | 47.0 years |
| Whole city: | 40.5 years |
Average household size:
| St Marys Square: | 3.6 people |
| San Francisco: | 2.2 people |
Percentage of family households:
| St Marys Square: | 48.5% |
| San Francisco: | 30.3% |
| Here: | 46.4% |
| San Francisco: | 35.3% |
Percentage of married-couple families with children (among all households):
| St Marys Square: | 16.6% |
| San Francisco: | 35.9% |
Percentage of single-mother households (among all households):
| St Marys Square: | 10.6% |
| San Francisco: | 6.0% |
Percentage of never married males 15 years old and over:
Percentage of never married females 15 years old and over:
| St Marys Square: | 28.2% |
| San Francisco: | 24.6% |
Percentage of never married females 15 years old and over:
| St Marys Square: | 18.5% |
| city: | 19.9% |
Percentage of people that speak English not well or not at all:
| St Marys Square: | 17.2% |
| San Francisco: | 10.9% |
Percentage of people born in this state:
Percentage of people born in another U.S. state:
Percentage of native residents but born outside the U.S.:
Percentage of foreign born residents:
| Here: | 49.1% |
| San Francisco: | 40.8% |
Percentage of people born in another U.S. state:
| St Marys Square: | 16.7% |
| San Francisco: | 23.4% |
Percentage of native residents but born outside the U.S.:
| Here: | 0.9% |
| city: | 2.6% |
Percentage of foreign born residents:
| Here: | 33.3% |
| San Francisco: | 33.2% |

Owner-occupied
Renter-occupied


- Rooms in owner-occupied houses and condos in St Marys Square
- 01 room
- 02 rooms
- 73 rooms
- 104 rooms
- 95 rooms
- 216 rooms
- 47 rooms
- 208 rooms
- 39+ rooms

- Rooms in renter-occupied apartments in St Marys Square
- 41 room
- 02 rooms
- 123 rooms
- 44 rooms
- 125 rooms
- 36 rooms
- 27 rooms
- 18 rooms
- 09+ rooms
Owner-occupied
Renter-occupied

- Bedrooms in owner-occupied houses and condos in St Marys Square
- 0no bedroom
- 11 bedroom
- 242 bedrooms
- 353 bedrooms
- 164 bedrooms
- 15+ bedrooms

- Bedrooms in renter-occupied apartments in St Marys Square
- 4no bedroom
- 131 bedroom
- 152 bedrooms
- 33 bedrooms
- 14 bedrooms
- 05+ bedrooms
Average number of cars or other vehicles available in houses/condos:
Average number of cars or other vehicles available in apartments:
| This neighborhood: | 2.1 |
| San Francisco: | 1.5 |
Average number of cars or other vehicles available in apartments:
| Here: | 1.0 |
| city: | 0.8 |
Percentage of units with a mortgage:
| St Marys Square: | 62.5% |
| San Francisco: | 62.3% |
Housing prices:
- Average estimated value of detached houses in 2022 (42.9% of all units):
St Marys Square: $2,506,222 San Francisco: $1,942,973
- Average estimated value of townhouses or other attached units in 2022 (20.6% of all units):
This neighborhood: $1,104,833 city: $1,528,422
- Average estimated value of housing units in 2-unit structures in 2022 (8.7% of all units):
This neighborhood: $1,084,927 San Francisco: $1,536,932
- Average estimated '22 value of housing units in 3-to-4-unit structures (4.8% of all units):
St Marys Square: $1,192,169 city: $1,622,965

- Year house built in St Marys Square
- 22020 or later
- 12010 to 2019
- 62000 to 2009
- 31990 to 1999
- 171980 to 1989
- 191970 to 1979
- 271960 to 1969
- 61950 to 1959
- 191940 to 1949
- 391939 or earlier

City-data.com crime index for city in 2020 (higher means more crime):
| City: | 387.4 |
| U.S. average: | 219.5 |
Travel time to work (commute)
![Travel time to work (commute)]()
- 95 to 9 minutes
- 1110 to 14 minutes
- 1715 to 19 minutes
- 2620 to 24 minutes
- 1025 to 29 minutes
- 4730 to 34 minutes
- 1935 to 39 minutes
- 440 to 44 minutes
- 2245 to 59 minutes
- 1360 to 89 minutes
- 890 or more minutes

Means of transportation to work
![Means of transportation to work]()
- 47.9%96Drove a car alone
- 9.0%18Carpooled
- 11.5%23Bus
- 4.5%9Subway or elevated rail
- 0.5%1Motorcycle
- 6.0%12Bicycle
- 3.5%7Walked
- 2.0%4Other means
- 17.4%35Worked at home

Time leaving home to go to work
![Time leaving home to go to work]()
- 712:00 a.m. to 4:59 a.m.
- 35:30 a.m. to 5:59 a.m.
- 176:00 a.m. to 6:29 a.m.
- 96:30 a.m. to 6:59 a.m.
- 317:00 a.m. to 7:29 a.m.
- 167:30 a.m. to 7:59 a.m.
- 418:00 a.m. to 8:29 a.m.
- 198:30 a.m. to 8:59 a.m.
- 159:00 a.m. to 9:59 a.m.
- 1010:00 a.m. to 10:59 a.m.
- 511:00 a.m. to 11:59 a.m.
- 612:00 p.m. to 3:59 p.m.
- 104:00 p.m. to 11:59 p.m.

Occupations of males:
- Percentage of males in management occupations (except farmers):
Here: 11.3% city: 17.2%
- Percentage of males in business and financial operations occupations:
Here: 6.6% city: 8.9%
- Percentage of males in computer and mathematical occupations:
Here: 8.0% city: 14.6%
- Percentage of males in architecture and engineering occupations:
Here: 5.2% city: 4.0%
- Percentage of males in life, physical, and social science occupations:
Here: 1.7% city: 2.4%
- Percentage of males in community and social services occupations:
Here: 2.0% city: 1.0%
- Percentage of males in legal occupations:
Here: 3.7% city: 2.5%
- Percentage of males in education, training, and library occupations:
Here: 1.2% city: 3.4%
- Percentage of males in healthcare practitioners and technical occupations:
Here: 2.0% city: 3.2%
- Percentage of males in service occupations:
Here: 19.0% city: 11.8%
- Percentage of males in sales and office occupations:
Here: 39.1% city: 13.5%
- Percentage of males in construction, extraction, and maintenance occupations:
Here: 1.7% city: 3.1%
- Percentage of males in production occupations:
Here: 1.4% city: 2.5%
- Percentage of males in transportation occupations:
Here: 3.6% city: 3.4%
- Percentage of males in material moving occupations:
Here: 1.7% city: 1.8%
Occupations of females:
- Percentage of females in management occupations (except farmers):
Here: 4.9% city: 15.8%
- Percentage of females in business and financial operations occupations:
Here: 5.9% city: 11.5%
- Percentage of females in computer and mathematical occupations:
Here: 4.5% city: 5.1%
- Percentage of females in life, physical, and social science occupations:
Here: 1.4% city: 2.9%
- Percentage of females in community and social services occupations:
Here: 1.8% city: 1.6%
- Percentage of females in legal occupations:
Here: 2.7% city: 3.0%
- Percentage of females in education, training, and library occupations:
Here: 13.8% city: 7.1%
- Percentage of females in arts, design, entertainment, sports, and media occupations:
Here: 8.9% city: 5.1%
- Percentage of females in healthcare practitioners and technical occupations:
Here: 6.4% city: 8.4%
- Percentage of females in service occupations:
Here: 21.9% city: 15.4%
- Percentage of females in sales and office occupations:
Here: 20.2% city: 19.3%
- Percentage of females in production occupations:
Here: 1.7% city: 1.5%
- Percentage of females in transportation occupations:
Here: 5.2% city: 0.8%
- Percentage of females in material moving occupations:
Here: 8.4% city: 0.8%
Education in this neighborhood (subdivision or community):
- Percentage of people 3 years and older in K-12 schools:
St Marys Square: 15.7% San Francisco: 9.7%
- Percentage of people 3 years and older in undergraduate colleges:
St Marys Square: 4.0% San Francisco: 4.8%
- Percentage of people 3 years and older in grad. or professional schools:
St Marys Square: 1.2% San Francisco: 2.6%
- Percentage of students K-12 enrolled in private schools:
St Marys Square: 25.8% San Francisco: 36.5%
Percentage of population below poverty level:
| St Marys Square: | 7.2% |
| San Francisco: | 10.4% |
Median year owner moved in (as recorded in 2022):
Median year renter moved in (as recorded in 2022):
| St Marys Square: | 2001 |
| San Francisco: | 2007 |
Median year renter moved in (as recorded in 2022):
| St Marys Square: | 2012 |
| San Francisco: | 2019 |
Percentage of married-couple families with both working:
| St Marys Square: | 111.3% |
| San Francisco: | 75.9% |

- 68.3%Utility gas
- 18.5%Electricity
- 8.5%No fuel used
- 2.9%Solar energy
- 1.9%Bottled, tank, or LP gas