Spring Garden neighborhood in Pittsburgh, Pennsylvania (PA), 15212 detailed profile
Settings
X


Business Search - 14 Million verified businesses
Area: 0.274 square miles
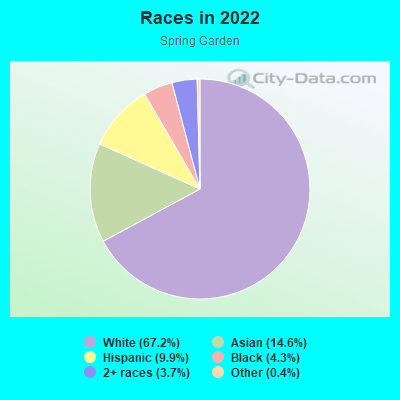
Population: 767
Population density:
| Spring Garden: | 2,797 people per square mile |
| Pittsburgh: | 5,449 people per square mile |

- 65884.0%White
- 698.8%Black
- 293.7%Two or more races
- 101.3%Native Hawaiian and Other
Pacific Islander - 70.9%Some other race
- 50.6%Asian
- 50.6%Hispanic or Latino
Median household income in 2022:
| Spring Garden: | $66,982 |
| Pittsburgh: | $63,380 |
Distribution of median household income
![Distribution of median household income]()
- 13Less than $10,000
- 72$10,000 to $19,999
- 58$20,000 to $29,999
- 35$30,000 to $39,999
- 36$40,000 to $49,999
- 31$50,000 to $59,999
- 31$60,000 to $74,999
- 64$75,000 to $99,999
- 39$100,000 to $124,999
- 23$125,000 to $149,999
- 28$150,000 to $199,999
- 12$200,000 or more

Distribution of owner-occupied house/condo value
![Distribution of owner-occupied house/condo value]()
- 57Less than $50,000
- 98$50,000 to $99,999
- 52$100,000 to $149,999
- 63$150,000 to $199,999
- 54$200,000 to $249,999
- 20$250,000 to $299,999
- 17$300,000 to $399,999
- 3$400,000 to $499,999
- 3$500,000 to $749,999
- 2$1,000,000 or more

Distribution of rent paid by renters
![Distribution of rent paid by renters]()
- 78$200 to $299
- 12$300 to $399
- 13$400 to $499
- 43$500 to $599
- 77$600 to $699
- 28$700 to $799
- 40$800 to $899
- 14$900 to $999
- 9$1,000 to $1,249
- 5$1,500 to $1,999

Median rent in 2022:
| Spring Garden: | $660 |
| Pittsburgh: | $981 |
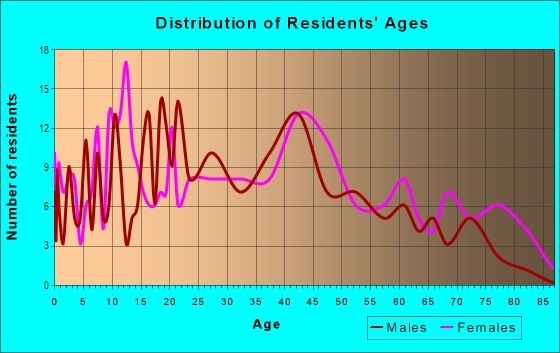
| Males: | 354 |
| Females: | 413 |
Males:
| This neighborhood: | 43.7 years |
| Whole city: | 33.3 years |
| This neighborhood: | 45.9 years |
| Whole city: | 32.9 years |
Average household size:
| Spring Garden: | 2.2 people |
| Pittsburgh: | 24.0 people |
Percentage of family households:
| Spring Garden: | 36.0% |
| Pittsburgh: | 28.6% |
| Here: | 33.5% |
| Pittsburgh: | 27.2% |
Percentage of married-couple families with children (among all households):
| Spring Garden: | 19.8% |
| Pittsburgh: | 24.6% |
Percentage of single-mother households (among all households):
| Spring Garden: | 14.1% |
| Pittsburgh: | 14.6% |
Percentage of never married males 15 years old and over:
Percentage of never married females 15 years old and over:
| Spring Garden: | 20.2% |
| Pittsburgh: | 28.4% |
Percentage of never married females 15 years old and over:
| Spring Garden: | 18.7% |
| city: | 27.6% |
Percentage of people that speak English not well or not at all:
| Spring Garden: | 0.0% |
| Pittsburgh: | 1.2% |
Percentage of people born in this state:
Percentage of people born in another U.S. state:
Percentage of native residents but born outside the U.S.:
Percentage of foreign born residents:
| Here: | 90.3% |
| Pittsburgh: | 65.9% |
Percentage of people born in another U.S. state:
| Spring Garden: | 8.7% |
| Pittsburgh: | 24.4% |
Percentage of native residents but born outside the U.S.:
| Here: | 0.3% |
| city: | 1.5% |
Percentage of foreign born residents:
| Here: | 0.9% |
| Pittsburgh: | 8.2% |
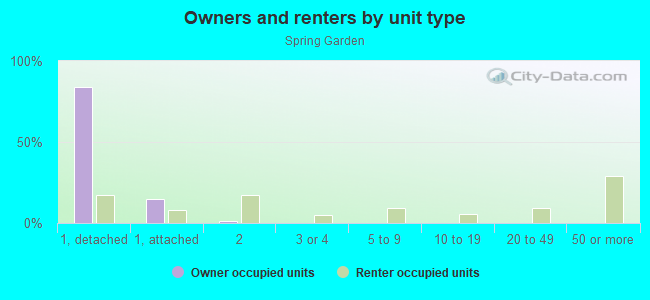
Owner-occupied
Renter-occupied

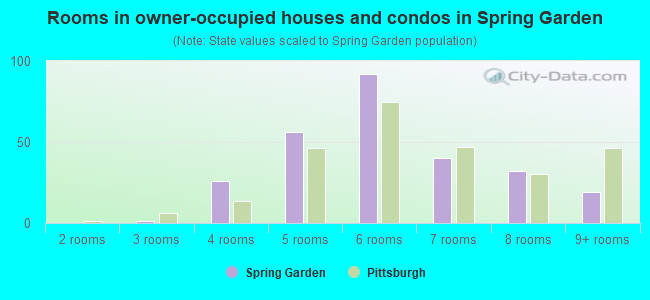
- Rooms in owner-occupied houses and condos in Spring Garden
- 01 room
- 02 rooms
- 13 rooms
- 264 rooms
- 565 rooms
- 926 rooms
- 407 rooms
- 328 rooms
- 199+ rooms
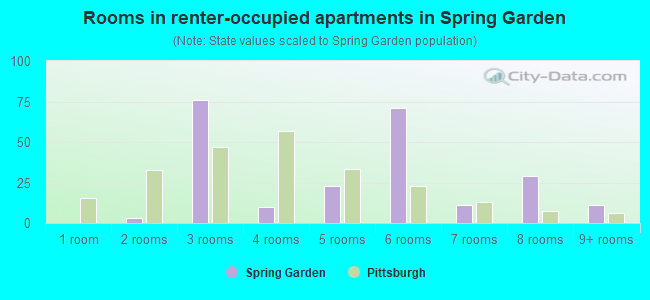
- Rooms in renter-occupied apartments in Spring Garden
- 01 room
- 32 rooms
- 763 rooms
- 104 rooms
- 235 rooms
- 716 rooms
- 117 rooms
- 298 rooms
- 119+ rooms
Owner-occupied
Renter-occupied
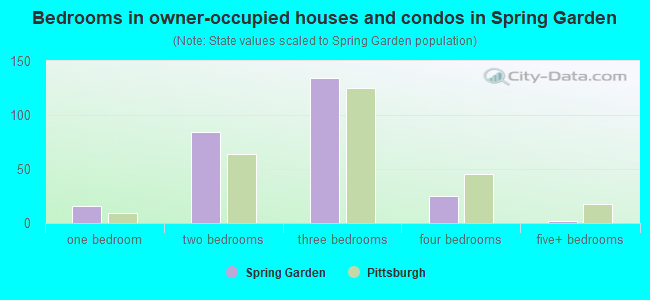
- Bedrooms in owner-occupied houses and condos in Spring Garden
- 0no bedroom
- 161 bedroom
- 842 bedrooms
- 1343 bedrooms
- 254 bedrooms
- 25+ bedrooms
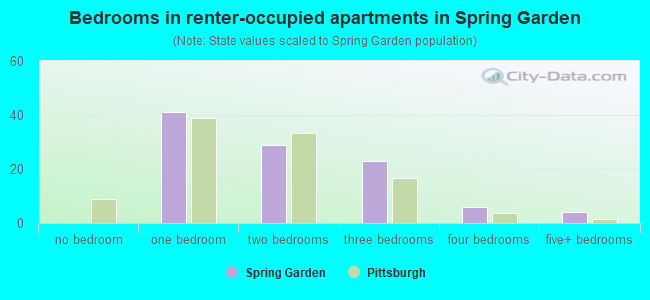
- Bedrooms in renter-occupied apartments in Spring Garden
- 0no bedroom
- 411 bedroom
- 292 bedrooms
- 233 bedrooms
- 64 bedrooms
- 45+ bedrooms
Average number of cars or other vehicles available in houses/condos:
Average number of cars or other vehicles available in apartments:
| This neighborhood: | 1.7 |
| Pittsburgh: | 1.5 |
Average number of cars or other vehicles available in apartments:
| Here: | 1.0 |
| city: | 0.9 |
Percentage of units with a mortgage:
| Spring Garden: | 48.5% |
| Pittsburgh: | 56.7% |
Average estimated value of detached houses in 2022 (72.7% of all units):
| Spring Garden: | $127,749 |
| Pittsburgh: | $225,939 |
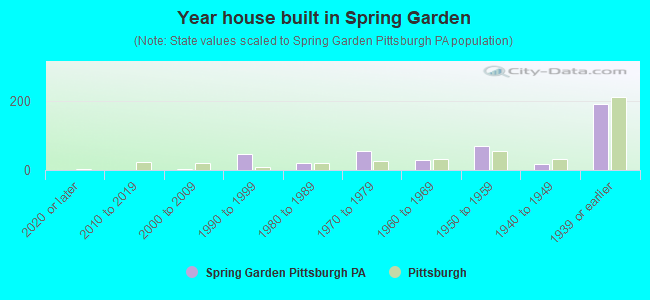
- Year house built in Spring Garden
- 02020 or later
- 02010 to 2019
- 32000 to 2009
- 451990 to 1999
- 191980 to 1989
- 561970 to 1979
- 291960 to 1969
- 701950 to 1959
- 181940 to 1949
- 1901939 or earlier
City-data.com crime index for city in 2019 (higher means more crime):
| City: | 257.1 |
| U.S. average: | 223.9 |
Travel time to work (commute)
![Travel time to work (commute)]()
- 145 to 9 minutes
- 3910 to 14 minutes
- 3015 to 19 minutes
- 5720 to 24 minutes
- 2425 to 29 minutes
- 5830 to 34 minutes
- 1235 to 39 minutes
- 640 to 44 minutes
- 1445 to 59 minutes
- 290 or more minutes

Means of transportation to work
![Means of transportation to work]()
- 67.5%247Drove a car alone
- 7.9%29Carpooled
- 7.4%27Bus
- 2.7%10Subway or elevated rail
- 8.5%31Taxi
- 6.0%22Bicycle
- 3.3%12Walked
- 1.4%5Other means
- 15.0%55Worked at home

Time leaving home to go to work
![Time leaving home to go to work]()
- 1412:00 a.m. to 4:59 a.m.
- 55:00 a.m. to 5:29 a.m.
- 115:30 a.m. to 5:59 a.m.
- 186:00 a.m. to 6:29 a.m.
- 106:30 a.m. to 6:59 a.m.
- 367:00 a.m. to 7:29 a.m.
- 357:30 a.m. to 7:59 a.m.
- 238:00 a.m. to 8:29 a.m.
- 148:30 a.m. to 8:59 a.m.
- 209:00 a.m. to 9:59 a.m.
- 1610:00 a.m. to 10:59 a.m.
- 511:00 a.m. to 11:59 a.m.
- 2512:00 p.m. to 3:59 p.m.
- 184:00 p.m. to 11:59 p.m.

Occupations of males:
- Percentage of males in management occupations (except farmers):
Here: 10.8% city: 11.1%
- Percentage of males in business and financial operations occupations:
Here: 15.3% city: 8.0%
- Percentage of males in computer and mathematical occupations:
Here: 5.5% city: 9.0%
- Percentage of males in architecture and engineering occupations:
Here: 2.2% city: 3.4%
- Percentage of males in life, physical, and social science occupations:
Here: 1.6% city: 2.7%
- Percentage of males in community and social services occupations:
Here: 6.1% city: 1.6%
- Percentage of males in education, training, and library occupations:
Here: 1.1% city: 7.0%
- Percentage of males in arts, design, entertainment, sports, and media occupations:
Here: 3.7% city: 3.0%
- Percentage of males in healthcare practitioners and technical occupations:
Here: 3.2% city: 6.1%
- Percentage of males in service occupations:
Here: 4.9% city: 14.7%
- Percentage of males in sales and office occupations:
Here: 11.6% city: 12.2%
- Percentage of males in construction, extraction, and maintenance occupations:
Here: 6.3% city: 5.0%
- Percentage of males in production occupations:
Here: 5.8% city: 3.3%
- Percentage of males in transportation occupations:
Here: 5.9% city: 4.4%
- Percentage of males in material moving occupations:
Here: 9.2% city: 3.8%
Occupations of females:
- Percentage of females in management occupations (except farmers):
Here: 4.8% city: 8.7%
- Percentage of females in business and financial operations occupations:
Here: 7.6% city: 8.1%
- Percentage of females in community and social services occupations:
Here: 2.8% city: 3.4%
- Percentage of females in education, training, and library occupations:
Here: 2.1% city: 9.9%
- Percentage of females in arts, design, entertainment, sports, and media occupations:
Here: 1.6% city: 3.0%
- Percentage of females in healthcare practitioners and technical occupations:
Here: 17.4% city: 10.9%
- Percentage of females in service occupations:
Here: 17.5% city: 20.1%
- Percentage of females in sales and office occupations:
Here: 39.3% city: 23.5%
- Percentage of females in production occupations:
Here: 1.3% city: 1.3%
- Percentage of females in material moving occupations:
Here: 4.0% city: 1.4%
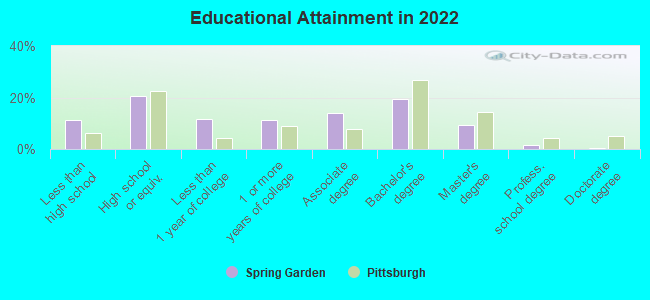
Education in this neighborhood (subdivision or community):
- Percentage of people 3 years and older in K-12 schools:
Spring Garden: 18.5% Pittsburgh: 10.4%
- Percentage of people 3 years and older in undergraduate colleges:
Spring Garden: 2.5% Pittsburgh: 12.9%
- Percentage of people 3 years and older in grad. or professional schools:
Spring Garden: 0.5% Pittsburgh: 4.1%
- Percentage of students K-12 enrolled in private schools:
Spring Garden: 30.2% Pittsburgh: 19.6%
Percentage of population below poverty level:
| Spring Garden: | 21.7% |
| Pittsburgh: | 19.0% |
Median year owner moved in (as recorded in 2022):
Median year renter moved in (as recorded in 2022):
| Spring Garden: | 1999 |
| Pittsburgh: | 2007 |
Median year renter moved in (as recorded in 2022):
| Spring Garden: | 2014 |
| Pittsburgh: | 2020 |
Percentage of married-couple families with both working:
| Spring Garden: | 142.8% |
| Pittsburgh: | 79.2% |
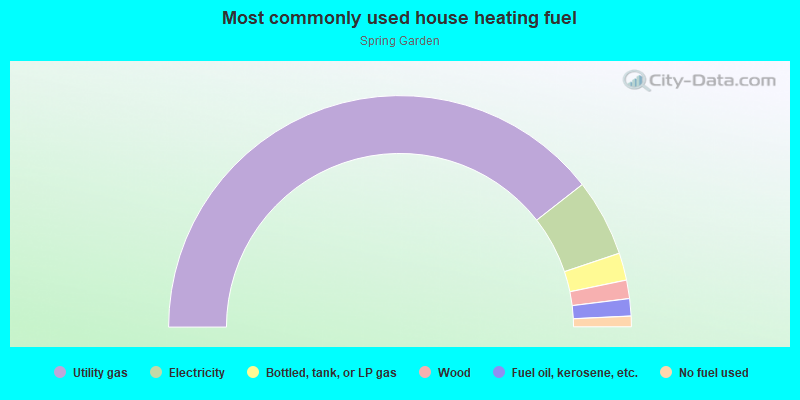
- 78.9%Utility gas
- 10.8%Electricity
- 3.8%Bottled, tank, or LP gas
- 2.6%Wood
- 2.4%Fuel oil, kerosene, etc.
- 1.5%No fuel used
Roads and streets:
Spring Garden Ave
Length: 1.86 miles
Directions: E-W, N-S, SE-NW, SW-NE
Address range: 911 to 3299
Directions: E-W, N-S, SE-NW, SW-NE
Address range: 911 to 3299
High St
Length: 0.58 miles
Directions: E-W, N-S, SW-NE
Address range: 1200 to 1899
Directions: E-W, N-S, SW-NE
Address range: 1200 to 1899
Voskamp St
Length: 0.46 miles
Directions: E-W, SW-NE
Address range: 100 to 1399
Directions: E-W, SW-NE
Address range: 100 to 1399
Welser Way
Length: 0.42 miles
Directions: E-W, SW-NE
Address range: 1000 to 1279
Directions: E-W, SW-NE
Address range: 1000 to 1279
Schubert St
Length: 0.23 miles
Direction: E-W
Address range: 1 to 145
Direction: E-W
Address range: 1 to 145
Lindell St
Length: 0.16 miles
Directions: SE-NW, SW-NE
Address range: 2400 to 2546
Directions: SE-NW, SW-NE
Address range: 2400 to 2546
Borough St
Length: 0.15 miles
Direction: E-W
Address range: 1 to 9
Direction: E-W
Address range: 1 to 9
Bohemian Way
Length: 0.14 miles
Direction: E-W
Address range: 1100 to 1299
Direction: E-W
Address range: 1100 to 1299
Gebhart St
Length: 0.14 miles
Direction: N-S
Address range: 1700 to 1999
Direction: N-S
Address range: 1700 to 1999
Arcola Way
Length: 0.14 miles
Directions: E-W, N-S, SE-NW
Address range: 1 to 64
Directions: E-W, N-S, SE-NW
Address range: 1 to 64
Salter Way
Length: 0.11 miles
Directions: E-W, SW-NE
Address range: 1000 to 1099
Directions: E-W, SW-NE
Address range: 1000 to 1099
Tell St
Length: 0.10 miles
Directions: E-W, N-S, SE-NW, SW-NE
Address range: 1300 to 1399
Directions: E-W, N-S, SE-NW, SW-NE
Address range: 1300 to 1399
Asylum St
Length: 0.08 miles
Direction: E-W
Address range: 1600 to 1699
Direction: E-W
Address range: 1600 to 1699
Farby Way
Length: 0.08 miles
Directions: N-S, SE-NW
Directions: N-S, SE-NW
Firth St
Length: 0.07 miles
Directions: SE-NW, SW-NE
Address range: 1300 to 1399
Directions: SE-NW, SW-NE
Address range: 1300 to 1399
Homer St
Length: 0.07 miles
Direction: SE-NW
Direction: SE-NW
Vinial St
Length: 0.06 miles
Directions: E-W, SE-NW
Address range: 951 to 1025
Directions: E-W, SE-NW
Address range: 951 to 1025
Roethlein Way
Length: 0.06 miles
Directions: N-S, SE-NW
Directions: N-S, SE-NW
Lager St
Length: 0.05 miles
Directions: E-W, SE-NW
Address range: 1668 to 1699
Directions: E-W, SE-NW
Address range: 1668 to 1699
Haug St
Length: 0.05 miles
Direction: E-W
Address range: 2 to 1799
Direction: E-W
Address range: 2 to 1799
Basin St
Length: 0.05 miles
Direction: N-S
Address range: 1300 to 1399
Direction: N-S
Address range: 1300 to 1399
Mauch St
Length: 0.05 miles
Direction: SW-NE
Address range: 1 to 99
Direction: SW-NE
Address range: 1 to 99
Lopella St
Length: 0.04 miles
Direction: SW-NE
Address range: 1 to 99
Direction: SW-NE
Address range: 1 to 99
Emmanuel St
Length: 0.04 miles
Directions: E-W, N-S
Directions: E-W, N-S
Giddy Way
Length: 0.04 miles
Directions: E-W, SW-NE
Directions: E-W, SW-NE
Old Honesty St
Length: 0.03 miles
Direction: SE-NW
Direction: SE-NW
Ginsy Way
Length: 0.03 miles
Directions: E-W, SW-NE
Directions: E-W, SW-NE
High Way
Length: 0.03 miles
Direction: N-S
Direction: N-S
Cabin St
Length: 0.03 miles
Directions: E-W, N-S, SW-NE
Address range: 1 to 99
Directions: E-W, N-S, SW-NE
Address range: 1 to 99
Schurz St
Length: 0.03 miles
Direction: SE-NW
Direction: SE-NW
Reppel Way
Length: 0.03 miles
Direction: E-W
Direction: E-W
Tanner St
Length: 0.02 miles
Direction: N-S
Address range: 1300 to 1399
Direction: N-S
Address range: 1300 to 1399
Arcolla Way
Length: 0.02 miles
Direction: N-S
Address range: 1280 to 1299
Direction: N-S
Address range: 1280 to 1299
Shull Way
Length: 0.02 miles
Direction: SE-NW
Direction: SE-NW
Williams Rd
Length: 0.01 miles
Direction: N-S
Address range: 3000 to 3013
Direction: N-S
Address range: 3000 to 3013