Southeast (Southeast Area) neighborhood in Fillmore, California (CA), 93015 detailed profile
Settings
X


Business Search - 14 Million verified businesses
Area: 0.907 square miles
Population: 366
Population density:
| Southeast (Southeast Area): | 404 people per square mile |
| Fillmore: | 5,923 people per square mile |

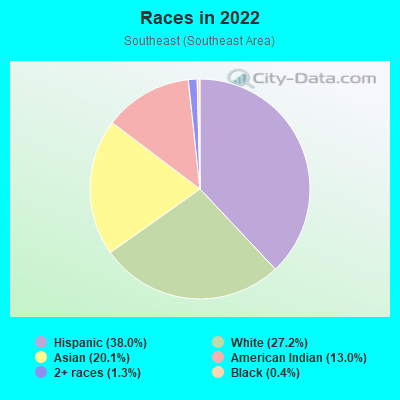
- 19938.0%Hispanic or Latino
- 14227.2%White
- 10520.1%Asian
- 6813.0%American Indian
- 71.3%Two or more races
- 20.4%Black
Median household income in 2022:
| Southeast (Southeast Area): | $85,903 |
| Fillmore: | $85,255 |
Distribution of median household income
![Distribution of median household income]()
- 72Less than $10,000
- 11$10,000 to $19,999
- 32$20,000 to $29,999
- 8$30,000 to $39,999
- 10$40,000 to $49,999
- 21$50,000 to $59,999
- 12$60,000 to $74,999
- 11$75,000 to $99,999
- 17$100,000 to $124,999
- 47$125,000 to $149,999
- 23$150,000 to $199,999
- 125$200,000 or more

Distribution of owner-occupied house/condo value
![Distribution of owner-occupied house/condo value]()
- 7Less than $50,000
- 109$50,000 to $99,999
- 4$100,000 to $149,999
- 6$150,000 to $199,999
- 5$200,000 to $249,999
- 223$300,000 to $399,999
- 7$400,000 to $499,999
- 33$500,000 to $749,999
- 6$750,000 to $999,999
- 138$1,000,000 or more

Distribution of rent paid by renters
![Distribution of rent paid by renters]()
- 1$200 to $299
- 138$500 to $599
- 3$700 to $799
- 3$800 to $899
- 1$900 to $999
- 24$1,000 to $1,249
- 6$1,250 to $1,499
- 24$1,500 to $1,999
- 133$2,000 or more

Median rent in 2022:
| Southeast (Southeast Area): | $1,731 |
| Fillmore: | $1,721 |
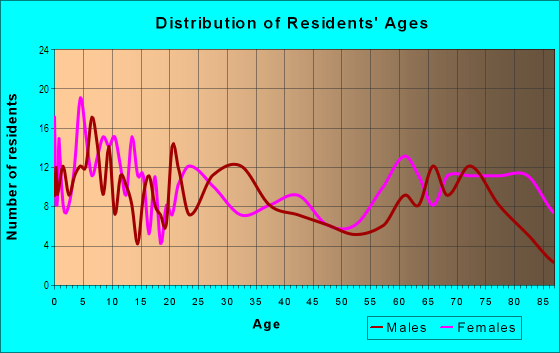
| Males: | 197 |
| Females: | 168 |
Males:
| This neighborhood: | 46.5 years |
| Whole city: | 35.3 years |
| This neighborhood: | 29.6 years |
| Whole city: | 34.6 years |
Average household size:
| Southeast (Southeast Area): | 2.7 people |
| Fillmore: | 3.3 people |
Percentage of family households:
| Southeast (Southeast Area): | 53.9% |
| Fillmore: | 60.4% |
| Here: | 47.3% |
| Fillmore: | 53.1% |
Percentage of married-couple families with children (among all households):
| Southeast (Southeast Area): | 27.3% |
| Fillmore: | 22.7% |
Percentage of single-mother households (among all households):
| Southeast (Southeast Area): | 27.1% |
| Fillmore: | 5.9% |
Percentage of never married males 15 years old and over:
Percentage of never married females 15 years old and over:
| Southeast (Southeast Area): | 15.5% |
| Fillmore: | 20.0% |
Percentage of never married females 15 years old and over:
| Southeast (Southeast Area): | 13.3% |
| city: | 17.2% |
Percentage of people that speak English not well or not at all:
| Southeast (Southeast Area): | 4.0% |
| Fillmore: | 9.6% |
Percentage of people born in this state:
Percentage of people born in another U.S. state:
Percentage of native residents but born outside the U.S.:
Percentage of foreign born residents:
| Here: | 72.6% |
| Fillmore: | 73.9% |
Percentage of people born in another U.S. state:
| Southeast (Southeast Area): | 8.2% |
| Fillmore: | 6.1% |
Percentage of native residents but born outside the U.S.:
| Here: | 0.6% |
| city: | 0.8% |
Percentage of foreign born residents:
| Here: | 18.7% |
| Fillmore: | 19.2% |
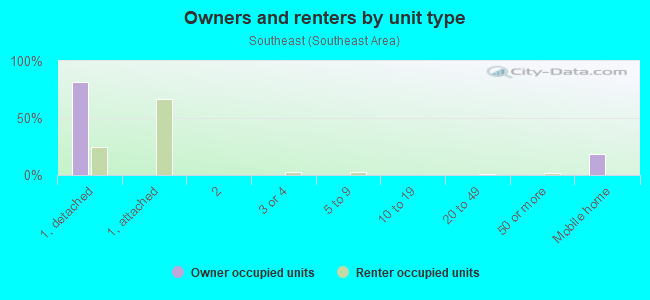
Owner-occupied
Renter-occupied


- Rooms in owner-occupied houses and condos in Southeast <
> - 01 room
- 02 rooms
- 03 rooms
- 634 rooms
- 95 rooms
- 1096 rooms
- 487 rooms
- 78 rooms
- 199+ rooms

- Rooms in renter-occupied apartments in Southeast <
> - 21 room
- 12 rooms
- 33 rooms
- 394 rooms
- 255 rooms
- 3836 rooms
- 57 rooms
- 1378 rooms
- 09+ rooms
Owner-occupied
Renter-occupied
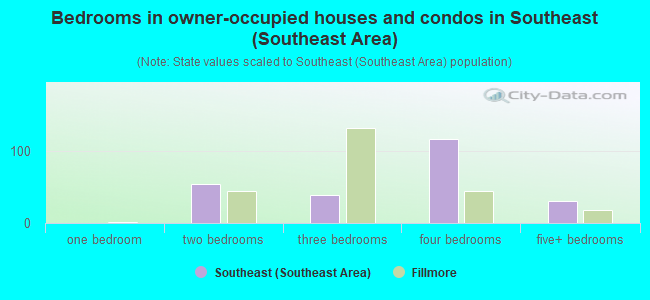
- Bedrooms in owner-occupied houses and condos in Southeast <
> - 0no bedroom
- 01 bedroom
- 542 bedrooms
- 393 bedrooms
- 1174 bedrooms
- 315+ bedrooms
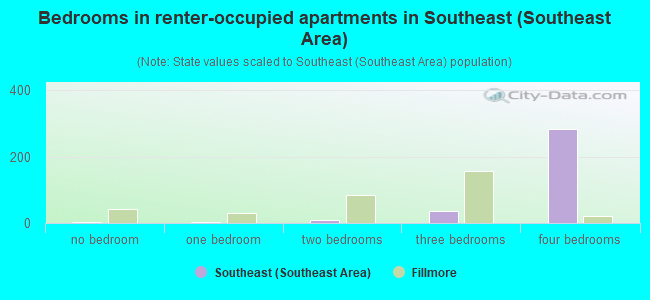
- Bedrooms in renter-occupied apartments in Southeast <
> - 2no bedroom
- 31 bedroom
- 102 bedrooms
- 353 bedrooms
- 2834 bedrooms
- 05+ bedrooms
Average number of cars or other vehicles available in houses/condos:
Average number of cars or other vehicles available in apartments:
| This neighborhood: | 2.5 |
| Fillmore: | 2.5 |
Average number of cars or other vehicles available in apartments:
| Here: | 1.7 |
| city: | 1.7 |
Percentage of units with a mortgage:
| Southeast (Southeast Area): | 44.6% |
| Fillmore: | 64.0% |
Average estimated value of detached houses in 2022 (82.6% of all units):
| Southeast (Southeast Area): | $575,256 |
| California: | $988,808 |
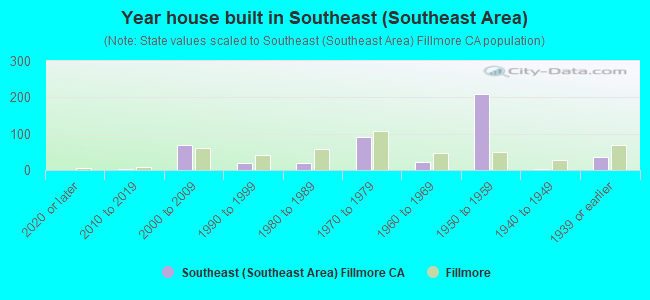
- Year house built in Southeast <
> - 12020 or later
- 32010 to 2019
- 682000 to 2009
- 181990 to 1999
- 201980 to 1989
- 921970 to 1979
- 211960 to 1969
- 2091950 to 1959
- 41940 to 1949
- 361939 or earlier
City-data.com crime index for city in 2020 (higher means more crime):
| City: | 105.8 |
| U.S. average: | 219.5 |
Travel time to work (commute)
![Travel time to work (commute)]()
- 24Less than 5 minutes
- 175 to 9 minutes
- 3610 to 14 minutes
- 1815 to 19 minutes
- 1920 to 24 minutes
- 1925 to 29 minutes
- 4230 to 34 minutes
- 1135 to 39 minutes
- 1640 to 44 minutes
- 30045 to 59 minutes
- 2460 to 89 minutes
- 1790 or more minutes

Means of transportation to work
![Means of transportation to work]()
- 67.2%127Drove a car alone
- 18.5%35Carpooled
- 63.0%119Bus
- 12.2%23Bicycle
- 58.7%111Walked
- 0.5%1Other means
- 7.4%14Worked at home

Time leaving home to go to work
![Time leaving home to go to work]()
- 1912:00 a.m. to 4:59 a.m.
- 55:00 a.m. to 5:29 a.m.
- 425:30 a.m. to 5:59 a.m.
- 86:00 a.m. to 6:29 a.m.
- 236:30 a.m. to 6:59 a.m.
- 367:00 a.m. to 7:29 a.m.
- 307:30 a.m. to 7:59 a.m.
- 268:00 a.m. to 8:29 a.m.
- 88:30 a.m. to 8:59 a.m.
- 239:00 a.m. to 9:59 a.m.
- 1411:00 a.m. to 11:59 a.m.
- 2212:00 p.m. to 3:59 p.m.
- 254:00 p.m. to 11:59 p.m.

Occupations of males:
- Percentage of males in management occupations (except farmers):
Here: 20.4% city: 10.4%
- Percentage of males in architecture and engineering occupations:
Here: 3.9% city: 3.2%
- Percentage of males in service occupations:
Here: 15.8% city: 18.9%
- Percentage of males in sales and office occupations:
Here: 9.9% city: 14.8%
- Percentage of males in farming, fishing, and forestry occupations:
Here: 9.7% city: 9.6%
- Percentage of males in construction, extraction, and maintenance occupations:
Here: 4.9% city: 8.0%
- Percentage of males in production occupations:
Here: 12.7% city: 8.9%
- Percentage of males in transportation occupations:
Here: 2.6% city: 3.2%
- Percentage of males in material moving occupations:
Here: 3.9% city: 6.1%
Occupations of females:
- Percentage of females in management occupations (except farmers):
Here: 6.9% city: 6.8%
- Percentage of females in architecture and engineering occupations:
Here: 8.2% city: 2.5%
- Percentage of females in community and social services occupations:
Here: 7.7% city: 5.0%
- Percentage of females in education, training, and library occupations:
Here: 6.0% city: 3.9%
- Percentage of females in healthcare practitioners and technical occupations:
Here: 35.1% city: 11.6%
- Percentage of females in service occupations:
Here: 8.5% city: 21.3%
- Percentage of females in sales and office occupations:
Here: 17.9% city: 29.7%
- Percentage of females in farming, fishing, and forestry occupations:
Here: 7.5% city: 4.5%
- Percentage of females in production occupations:
Here: 7.4% city: 3.4%
- Percentage of females in transportation occupations:
Here: 1.6% city: 1.2%
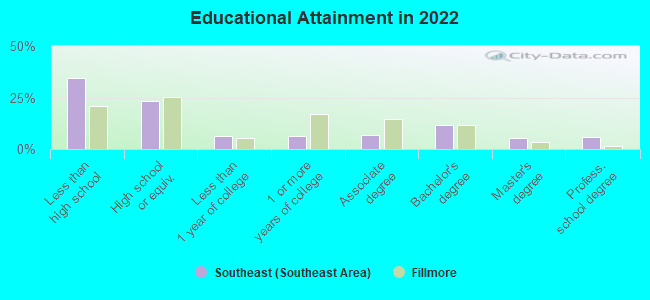
Education in this neighborhood (subdivision or community):
- Percentage of people 3 years and older in K-12 schools:
Southeast (Southeast Area): 47.5% Fillmore: 20.8%
- Percentage of people 3 years and older in undergraduate colleges:
Southeast (Southeast Area): 6.1% Fillmore: 8.0%
- Percentage of people 3 years and older in grad. or professional schools:
Southeast (Southeast Area): 0.0% Fillmore: 0.0%
- Percentage of students K-12 enrolled in private schools:
Southeast (Southeast Area): 14.6% Fillmore: 10.8%
Percentage of population below poverty level:
| Southeast (Southeast Area): | 8.1% |
| Fillmore: | 6.8% |
Median year owner moved in (as recorded in 2022):
Median year renter moved in (as recorded in 2022):
| Southeast (Southeast Area): | 1998 |
| Fillmore: | 2006 |
Median year renter moved in (as recorded in 2022):
| Southeast (Southeast Area): | 2010 |
| Fillmore: | 2013 |
Percentage of married-couple families with both working:
| Southeast (Southeast Area): | 567.8% |
| Fillmore: | 59.6% |
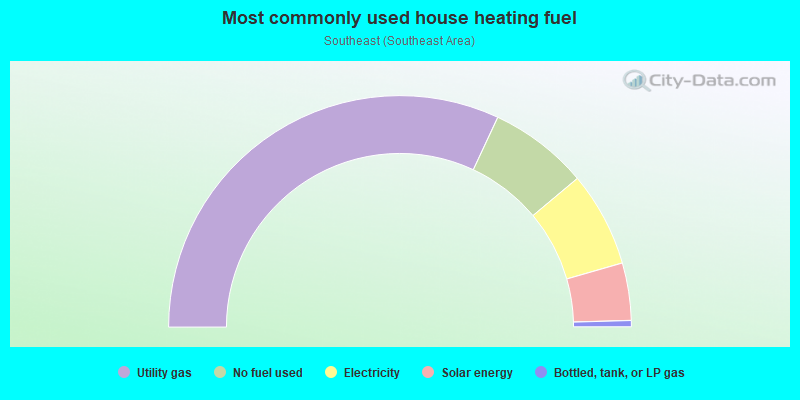
- 63.9%Utility gas
- 13.9%No fuel used
- 13.3%Electricity
- 8.0%Solar energy
- 0.9%Bottled, tank, or LP gas
Highways in this neighborhood:
State Rte 126 (E Telegraph Rd)
Length: 2.69 miles
Direction: E-W
Address range: 1 to 849
Direction: E-W
Address range: 1 to 849
State Rte 126 (W Telegraph Rd)
Length: 1.49 miles
Direction: E-W
Address range: 100 to 547
Direction: E-W
Address range: 100 to 547
W Ventura St (State Rte 126, W Telegraph Rd)
Length: 0.50 miles
Direction: E-W
Address range: 548 to 799
Direction: E-W
Address range: 548 to 799
Roads and streets:
Santa Clara Ave (Santa Clara St)
Length: 1.12 miles
Directions: E-W, N-S, SE-NW, SW-NE
Address range: 100 to 723
Directions: E-W, N-S, SE-NW, SW-NE
Address range: 100 to 723
River St
Length: 1.02 miles
Directions: E-W, N-S
Address range: 400 to 699
Directions: E-W, N-S
Address range: 400 to 699
Central Ave
Length: 0.39 miles
Directions: N-S, SE-NW, SW-NE
Address range: 100 to 267
Directions: N-S, SE-NW, SW-NE
Address range: 100 to 267
Mountain View St
Length: 0.36 miles
Direction: N-S
Address range: 200 to 235
Direction: N-S
Address range: 200 to 235
Kellogg St
Length: 0.33 miles
Directions: N-S, SE-NW
Address range: 1 to 199
Directions: N-S, SE-NW
Address range: 1 to 199
A St
Length: 0.29 miles
Direction: N-S
Address range: 1 to 246
Direction: N-S
Address range: 1 to 246
Bridlewood Ln
Length: 0.20 miles
Directions: E-W, N-S, SW-NE
Address range: 100 to 499
Directions: E-W, N-S, SW-NE
Address range: 100 to 499
Sespe Land and Water
Length: 0.16 miles
Direction: N-S
Direction: N-S
Gasway Dr
Length: 0.16 miles
Direction: E-W
Direction: E-W
Fish Hatchery Rd
Length: 0.14 miles
Direction: N-S
Direction: N-S
Wildwood
Length: 0.14 miles
Directions: E-W, N-S
Directions: E-W, N-S
Orange Grove Ave (Pine Grove Ave)
Length: 0.10 miles
Direction: N-S
Address range: 200 to 397
Direction: N-S
Address range: 200 to 397
Olive St
Length: 0.10 miles
Direction: N-S
Address range: 200 to 299
Direction: N-S
Address range: 200 to 299
Palm St
Length: 0.10 miles
Direction: N-S
Address range: 200 to 299
Direction: N-S
Address range: 200 to 299
Fillmore St
Length: 0.10 miles
Direction: N-S
Address range: 200 to 299
Direction: N-S
Address range: 200 to 299
Saratoga St
Length: 0.10 miles
Direction: N-S
Address range: 200 to 299
Direction: N-S
Address range: 200 to 299
Clay St
Length: 0.10 miles
Direction: N-S
Address range: 200 to 299
Direction: N-S
Address range: 200 to 299
Palm
Length: 0.06 miles
Directions: E-W, N-S, SE-NW, SW-NE
Directions: E-W, N-S, SE-NW, SW-NE
Sandalwood Pl
Length: 0.05 miles
Direction: N-S
Address range: 100 to 199
Direction: N-S
Address range: 100 to 199
Burlington
Length: 0.04 miles
Direction: N-S
Direction: N-S
el Dorado Dr
Length: 0.04 miles
Direction: N-S
Direction: N-S
Santa Fe St
Length: 0.03 miles
Direction: E-W
Address range: 700 to 709
Direction: E-W
Address range: 700 to 709
Railroad features:
Union Pacific RR
Length: 0.70 miles
Directions: E-W, SE-NW
Directions: E-W, SE-NW
Other features:
Pole Crk
Length: 0.35 miles
Directions: N-S, SE-NW
Directions: N-S, SE-NW