South Garden neighborhood in Savannah, Georgia (GA), 31404 detailed profile
Settings
X


Business Search - 14 Million verified businesses
Area: 0.135 square miles
Population: 376
Population density:
| South Garden: | 2,775 people per square mile |
| Savannah: | 1,980 people per square mile |

- 22343.6%Black
- 11322.1%Hispanic or Latino
- 8015.6%White
- 6111.9%Two or more races
- 183.5%Some other race
- 91.8%Asian
- 81.6%Native Hawaiian and Other
Pacific Islander

Distribution of median household income
![Distribution of median household income]()
- 27Less than $10,000
- 91$10,000 to $19,999
- 22$20,000 to $29,999
- 15$30,000 to $39,999
- 22$40,000 to $49,999
- 9$50,000 to $59,999
- 32$60,000 to $74,999
- 25$75,000 to $99,999
- 8$100,000 to $124,999
- 7$125,000 to $149,999
- 9$150,000 to $199,999
- 6$200,000 or more

Distribution of owner-occupied house/condo value
![Distribution of owner-occupied house/condo value]()
- 18Less than $50,000
- 35$50,000 to $99,999
- 34$100,000 to $149,999
- 21$150,000 to $199,999
- 23$200,000 to $249,999
- 15$250,000 to $299,999
- 6$300,000 to $399,999
- 3$400,000 to $499,999
- 1$500,000 to $749,999
- 6$750,000 to $999,999

Distribution of rent paid by renters
![Distribution of rent paid by renters]()
- 8Less than $100
- 57$100 to $199
- 23$200 to $299
- 24$300 to $399
- 6$400 to $499
- 4$500 to $599
- 15$600 to $699
- 16$700 to $799
- 8$800 to $899
- 9$900 to $999
- 52$1,000 to $1,249
- 19$1,250 to $1,499
- 10$1,500 to $1,999
- 2$2,000 or more

Median rent in 2022:
| South Garden: | $313 |
| Savannah: | $1,005 |
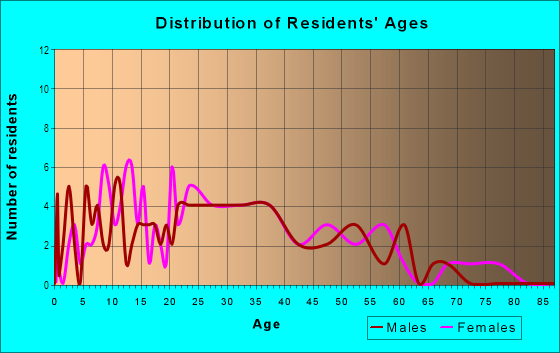
| Males: | 211 |
| Females: | 165 |
Males:
| This neighborhood: | 33.2 years |
| Whole city: | 33.3 years |
| This neighborhood: | 47.2 years |
| Whole city: | 35.7 years |
Average household size:
| South Garden: | 2.1 people |
| Savannah: | 2.2 people |
Percentage of family households:
| South Garden: | 19.4% |
| Savannah: | 34.5% |
| Here: | 6.5% |
| Savannah: | 27.9% |
Percentage of married-couple families with children (among all households):
| South Garden: | 51.6% |
| Savannah: | 15.8% |
Percentage of single-mother households (among all households):
| South Garden: | 28.2% |
| Savannah: | 24.1% |
Percentage of never married males 15 years old and over:
Percentage of never married females 15 years old and over:
| South Garden: | 41.0% |
| Savannah: | 22.2% |
Percentage of never married females 15 years old and over:
| South Garden: | 11.3% |
| city: | 26.6% |
Percentage of people that speak English not well or not at all:
| South Garden: | 0.0% |
| Savannah: | 1.1% |
Percentage of people born in this state:
Percentage of people born in another U.S. state:
Percentage of native residents but born outside the U.S.:
Percentage of foreign born residents:
| Here: | 57.6% |
| Savannah: | 52.9% |
Percentage of people born in another U.S. state:
| South Garden: | 39.9% |
| Savannah: | 39.2% |
Percentage of native residents but born outside the U.S.:
| Here: | 2.4% |
| city: | 2.0% |
Percentage of foreign born residents:
| Here: | 7.1% |
| Savannah: | 5.9% |

Owner-occupied
Renter-occupied


- Rooms in owner-occupied houses and condos in South Garden
- 01 room
- 02 rooms
- 13 rooms
- 54 rooms
- 65 rooms
- 126 rooms
- 97 rooms
- 88 rooms
- 239+ rooms

- Rooms in renter-occupied apartments in South Garden
- 41 room
- 172 rooms
- 793 rooms
- 204 rooms
- 115 rooms
- 116 rooms
- 87 rooms
- 98 rooms
- 69+ rooms
Owner-occupied
Renter-occupied

- Bedrooms in owner-occupied houses and condos in South Garden
- 0no bedroom
- 61 bedroom
- 192 bedrooms
- 573 bedrooms
- 234 bedrooms
- 25+ bedrooms

- Bedrooms in renter-occupied apartments in South Garden
- 4no bedroom
- 991 bedroom
- 282 bedrooms
- 103 bedrooms
- 84 bedrooms
- 05+ bedrooms
Average number of cars or other vehicles available in houses/condos:
Average number of cars or other vehicles available in apartments:
| This neighborhood: | 1.1 |
| Savannah: | 1.9 |
Average number of cars or other vehicles available in apartments:
| Here: | 0.9 |
| city: | 1.4 |
Percentage of units with a mortgage:
| South Garden: | 45.9% |
| Savannah: | 64.4% |
Average estimated value of detached houses in 2022 (38.7% of all units):
| South Garden: | $243,024 |
| Savannah: | $283,633 |

- Year house built in South Garden
- 22020 or later
- 62010 to 2019
- 92000 to 2009
- 51990 to 1999
- 51980 to 1989
- 951970 to 1979
- 221960 to 1969
- 421950 to 1959
- 231940 to 1949
- 61939 or earlier

Travel time to work (commute)
![Travel time to work (commute)]()
- 2Less than 5 minutes
- 185 to 9 minutes
- 2710 to 14 minutes
- 2615 to 19 minutes
- 1820 to 24 minutes
- 725 to 29 minutes
- 2230 to 34 minutes
- 135 to 39 minutes
- 240 to 44 minutes
- 245 to 59 minutes
- 760 to 89 minutes

Means of transportation to work
![Means of transportation to work]()
- 82.8%63Drove a car alone
- 56.5%43Carpooled
- 7.9%6Bus
- 6.6%5Bicycle
- 6.6%5Walked
- 2.6%2Other means
- 34.2%26Worked at home

Time leaving home to go to work
![Time leaving home to go to work]()
- 212:00 a.m. to 4:59 a.m.
- 35:00 a.m. to 5:29 a.m.
- 145:30 a.m. to 5:59 a.m.
- 16:00 a.m. to 6:29 a.m.
- 96:30 a.m. to 6:59 a.m.
- 117:00 a.m. to 7:29 a.m.
- 147:30 a.m. to 7:59 a.m.
- 238:00 a.m. to 8:29 a.m.
- 188:30 a.m. to 8:59 a.m.
- 99:00 a.m. to 9:59 a.m.
- 410:00 a.m. to 10:59 a.m.
- 211:00 a.m. to 11:59 a.m.
- 1212:00 p.m. to 3:59 p.m.
- 114:00 p.m. to 11:59 p.m.

Occupations of males:
- Percentage of males in management occupations (except farmers):
Here: 39.9% city: 8.6%
- Percentage of males in business and financial operations occupations:
Here: 1.5% city: 5.4%
- Percentage of males in architecture and engineering occupations:
Here: 1.8% city: 2.4%
- Percentage of males in community and social services occupations:
Here: 145.6% city: 0.7%
- Percentage of males in legal occupations:
Here: 10.8% city: 1.0%
- Percentage of males in education, training, and library occupations:
Here: 3.6% city: 3.3%
- Percentage of males in arts, design, entertainment, sports, and media occupations:
Here: 2.2% city: 3.2%
- Percentage of males in healthcare practitioners and technical occupations:
Here: 1.1% city: 2.4%
- Percentage of males in service occupations:
Here: 73.1% city: 22.7%
- Percentage of males in construction, extraction, and maintenance occupations:
Here: 1.4% city: 6.4%
- Percentage of males in production occupations:
Here: 1.3% city: 6.0%
Occupations of females:
- Percentage of females in management occupations (except farmers):
Here: 2.3% city: 7.5%
- Percentage of females in computer and mathematical occupations:
Here: 6.1% city: 0.8%
- Percentage of females in architecture and engineering occupations:
Here: 29.1% city: 0.6%
- Percentage of females in community and social services occupations:
Here: 1.3% city: 2.4%
- Percentage of females in legal occupations:
Here: 15.4% city: 1.3%
- Percentage of females in education, training, and library occupations:
Here: 2.8% city: 8.5%
- Percentage of females in arts, design, entertainment, sports, and media occupations:
Here: 16.9% city: 2.4%
- Percentage of females in healthcare practitioners and technical occupations:
Here: 3.2% city: 8.6%
- Percentage of females in service occupations:
Here: 7.1% city: 24.1%
- Percentage of females in sales and office occupations:
Here: 22.7% city: 28.2%
- Percentage of females in construction, extraction, and maintenance occupations:
Here: 3.2% city: 0.7%
- Percentage of females in production occupations:
Here: 1.1% city: 2.4%
- Percentage of females in transportation occupations:
Here: 19.4% city: 2.7%
Percentage of people 16-64 in Armed Forces:
| South Garden: | 2.0% |
| Savannah: | 1.8% |
Education in this neighborhood (subdivision or community):
- Percentage of people 3 years and older in K-12 schools:
South Garden: 24.5% Savannah: 12.9%
- Percentage of people 3 years and older in undergraduate colleges:
South Garden: 4.5% Savannah: 11.4%
- Percentage of people 3 years and older in grad. or professional schools:
South Garden: 2.7% Savannah: 1.1%
- Percentage of students K-12 enrolled in private schools:
South Garden: 39.1% Savannah: 14.5%
Percentage of population below poverty level:
| South Garden: | 28.3% |
| Savannah: | 20.5% |
Median year owner moved in (as recorded in 2022):
Median year renter moved in (as recorded in 2022):
| South Garden: | 2008 |
| Savannah: | 2012 |
Median year renter moved in (as recorded in 2022):
| South Garden: | 2016 |
| Savannah: | 2020 |
Percentage of married-couple families with both working:
| South Garden: | 39.3% |
| Savannah: | 79.0% |

- 54.3%Electricity
- 28.3%Utility gas
- 7.0%Bottled, tank, or LP gas
- 6.7%No fuel used
- 3.8%Fuel oil, kerosene, etc.
Roads and streets:
E 68th St
Length: 0.40 miles
Direction: E-W
Address range: 1100 to 1399
Direction: E-W
Address range: 1100 to 1399
E 69th St
Length: 0.25 miles
Direction: E-W
Address range: 1200 to 1399
Direction: E-W
Address range: 1200 to 1399
E 72nd St
Length: 0.25 miles
Direction: E-W
Address range: 1100 to 1299
Direction: E-W
Address range: 1100 to 1299
E 70th St
Length: 0.24 miles
Direction: E-W
Address range: 1200 to 1399
Direction: E-W
Address range: 1200 to 1399
Ranger St
Length: 0.24 miles
Directions: N-S, SW-NE
Address range: 5052 to 5116
Directions: N-S, SW-NE
Address range: 5052 to 5116
Sanders St
Length: 0.24 miles
Direction: N-S
Address range: 5100 to 5398
Direction: N-S
Address range: 5100 to 5398
E 71st St
Length: 0.24 miles
Direction: E-W
Address range: 1200 to 1399
Direction: E-W
Address range: 1200 to 1399
Woodland Cir
Length: 0.23 miles
Directions: E-W, N-S, SE-NW
Directions: E-W, N-S, SE-NW
E 67th St
Length: 0.22 miles
Direction: E-W
Address range: 1200 to 1399
Direction: E-W
Address range: 1200 to 1399
Truman Pkwy (Harry S Truman Pkwy)
Length: 0.17 miles
Direction: SW-NE
Direction: SW-NE
E 66th St
Length: 0.07 miles
Direction: E-W
Address range: 1300 to 1349
Direction: E-W
Address range: 1300 to 1349
Waters Ave
Length: 0.05 miles
Direction: N-S
Address range: 5800 to 5817
Direction: N-S
Address range: 5800 to 5817
Other features:
Casey Cnl
Length: 0.13 miles
Direction: E-W
Direction: E-W