South Broadway District neighborhood in Chula Vista, California (CA), 91911 detailed profile
Settings
X


Business Search - 14 Million verified businesses
Area: 0.758 square miles
Population: 2,720
Population density:
| South Broadway District: | 3,591 people per square mile |
| Chula Vista: | 5,711 people per square mile |

- 2,28167.2%Hispanic or Latino
- 57516.9%Native Hawaiian and Other
Pacific Islander - 1414.2%White
- 1002.9%Asian
- 922.7%Black
- 772.3%Two or more races
- 722.1%Some other race
- 581.7%American Indian

Median household income in 2022:
| South Broadway District: | $53,442 |
| Chula Vista: | $101,190 |
Distribution of median household income
![Distribution of median household income]()
- 77Less than $10,000
- 105$10,000 to $19,999
- 104$20,000 to $29,999
- 97$30,000 to $39,999
- 34$40,000 to $49,999
- 88$50,000 to $59,999
- 103$60,000 to $74,999
- 132$75,000 to $99,999
- 74$100,000 to $124,999
- 61$125,000 to $149,999
- 24$150,000 to $199,999
- 45$200,000 or more

Distribution of owner-occupied house/condo value
![Distribution of owner-occupied house/condo value]()
- 102Less than $50,000
- 454$50,000 to $99,999
- 52$100,000 to $149,999
- 55$150,000 to $199,999
- 170$200,000 to $249,999
- 92$250,000 to $299,999
- 37$300,000 to $399,999
- 41$400,000 to $499,999
- 94$500,000 to $749,999
- 19$750,000 to $999,999
- 7$1,000,000 or more

Distribution of rent paid by renters
![Distribution of rent paid by renters]()
- 177$200 to $299
- 65$300 to $399
- 37$400 to $499
- 57$500 to $599
- 26$600 to $699
- 38$700 to $799
- 46$800 to $899
- 5$900 to $999
- 29$1,000 to $1,249
- 50$1,250 to $1,499
- 285$1,500 to $1,999
- 233$2,000 or more

Median rent in 2022:
| South Broadway District: | $1,699 |
| Chula Vista: | $1,879 |
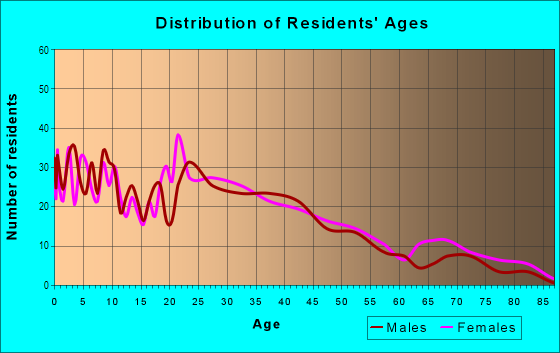
| Males: | 1,419 |
| Females: | 1,301 |
Males:
| This neighborhood: | 34.2 years |
| Whole city: | 34.8 years |
| This neighborhood: | 43.0 years |
| Whole city: | 37.4 years |
Average household size:
| South Broadway District: | 5.6 people |
| Chula Vista: | 3.2 people |
Percentage of family households:
| South Broadway District: | 56.1% |
| Chula Vista: | 57.2% |
| Here: | 47.8% |
| Chula Vista: | 54.5% |
Percentage of married-couple families with children (among all households):
| South Broadway District: | 21.9% |
| Chula Vista: | 22.9% |
Percentage of single-mother households (among all households):
| South Broadway District: | 9.0% |
| Chula Vista: | 5.5% |
Percentage of never married males 15 years old and over:
Percentage of never married females 15 years old and over:
| South Broadway District: | 22.5% |
| Chula Vista: | 19.8% |
Percentage of never married females 15 years old and over:
| South Broadway District: | 16.1% |
| city: | 16.5% |
Percentage of people that speak English not well or not at all:
| South Broadway District: | 20.4% |
| Chula Vista: | 8.7% |
Percentage of people born in this state:
Percentage of people born in another U.S. state:
Percentage of native residents but born outside the U.S.:
Percentage of foreign born residents:
| Here: | 50.8% |
| Chula Vista: | 56.5% |
Percentage of people born in another U.S. state:
| South Broadway District: | 9.1% |
| Chula Vista: | 13.1% |
Percentage of native residents but born outside the U.S.:
| Here: | 2.0% |
| city: | 2.8% |
Percentage of foreign born residents:
| Here: | 38.1% |
| Chula Vista: | 27.6% |

Owner-occupied
Renter-occupied


- Rooms in owner-occupied houses and condos in South Broadway District
- 01 room
- 502 rooms
- 853 rooms
- 864 rooms
- 775 rooms
- 496 rooms
- 247 rooms
- 198 rooms
- 129+ rooms

- Rooms in renter-occupied apartments in South Broadway District
- 311 room
- 672 rooms
- 2183 rooms
- 1284 rooms
- 665 rooms
- 536 rooms
- 147 rooms
- 1418 rooms
- 729+ rooms
Owner-occupied
Renter-occupied

- Bedrooms in owner-occupied houses and condos in South Broadway District
- 50no bedroom
- 471 bedroom
- 1512 bedrooms
- 1193 bedrooms
- 464 bedrooms
- 115+ bedrooms

- Bedrooms in renter-occupied apartments in South Broadway District
- 35no bedroom
- 1001 bedroom
- 3212 bedrooms
- 943 bedrooms
- 204 bedrooms
- 295+ bedrooms
Average number of cars or other vehicles available in houses/condos:
Average number of cars or other vehicles available in apartments:
| This neighborhood: | 2.2 |
| Chula Vista: | 2.4 |
Average number of cars or other vehicles available in apartments:
| Here: | 1.7 |
| city: | 1.7 |
Percentage of units with a mortgage:
| South Broadway District: | 44.4% |
| Chula Vista: | 76.0% |
Average estimated value of detached houses in 2022 (24.9% of all units):
| South Broadway District: | $518,861 |
| California: | $988,808 |

- Year house built in South Broadway District
- 72020 or later
- 1142010 to 2019
- 372000 to 2009
- 591990 to 1999
- 1491980 to 1989
- 2211970 to 1979
- 1601960 to 1969
- 2001950 to 1959
- 961940 to 1949
- 161939 or earlier

City-data.com crime index for city in 2020 (higher means more crime):
| City: | 159.8 |
| U.S. average: | 219.5 |
Travel time to work (commute)
![Travel time to work (commute)]()
- 24Less than 5 minutes
- 605 to 9 minutes
- 14210 to 14 minutes
- 19615 to 19 minutes
- 17020 to 24 minutes
- 7225 to 29 minutes
- 20030 to 34 minutes
- 4135 to 39 minutes
- 5140 to 44 minutes
- 5945 to 59 minutes
- 12760 to 89 minutes
- 3390 or more minutes

Means of transportation to work
![Means of transportation to work]()
- 71.1%866Drove a car alone
- 11.2%136Carpooled
- 5.8%71Bus
- 4.9%60Subway or elevated rail
- 0.9%11Long-distance train or commuter rail
- 2.0%24Light rail, streetcar or trolley
- 19.9%243Taxi
- 0.7%9Motorcycle
- 3.1%38Walked
- 4.3%53Other means
- 4.7%57Worked at home

Time leaving home to go to work
![Time leaving home to go to work]()
- 7212:00 a.m. to 4:59 a.m.
- 465:00 a.m. to 5:29 a.m.
- 895:30 a.m. to 5:59 a.m.
- 1766:00 a.m. to 6:29 a.m.
- 376:30 a.m. to 6:59 a.m.
- 2117:00 a.m. to 7:29 a.m.
- 1197:30 a.m. to 7:59 a.m.
- 1408:00 a.m. to 8:29 a.m.
- 378:30 a.m. to 8:59 a.m.
- 649:00 a.m. to 9:59 a.m.
- 3510:00 a.m. to 10:59 a.m.
- 2111:00 a.m. to 11:59 a.m.
- 5712:00 p.m. to 3:59 p.m.
- 924:00 p.m. to 11:59 p.m.

Occupations of males:
- Percentage of males in management occupations (except farmers):
Here: 12.5% city: 9.9%
- Percentage of males in business and financial operations occupations:
Here: 4.7% city: 6.5%
- Percentage of males in architecture and engineering occupations:
Here: 3.3% city: 4.8%
- Percentage of males in life, physical, and social science occupations:
Here: 1.0% city: 1.2%
- Percentage of males in education, training, and library occupations:
Here: 1.5% city: 2.3%
- Percentage of males in arts, design, entertainment, sports, and media occupations:
Here: 3.5% city: 1.8%
- Percentage of males in service occupations:
Here: 14.4% city: 18.4%
- Percentage of males in sales and office occupations:
Here: 15.0% city: 16.0%
- Percentage of males in construction, extraction, and maintenance occupations:
Here: 15.7% city: 9.2%
- Percentage of males in production occupations:
Here: 6.3% city: 5.7%
- Percentage of males in transportation occupations:
Here: 2.9% city: 5.1%
- Percentage of males in material moving occupations:
Here: 10.6% city: 3.7%
Occupations of females:
- Percentage of females in management occupations (except farmers):
Here: 2.9% city: 8.6%
- Percentage of females in business and financial operations occupations:
Here: 3.7% city: 5.6%
- Percentage of females in computer and mathematical occupations:
Here: 3.7% city: 1.2%
- Percentage of females in life, physical, and social science occupations:
Here: 2.8% city: 1.4%
- Percentage of females in community and social services occupations:
Here: 2.2% city: 3.1%
- Percentage of females in education, training, and library occupations:
Here: 2.7% city: 7.6%
- Percentage of females in healthcare practitioners and technical occupations:
Here: 2.0% city: 10.6%
- Percentage of females in service occupations:
Here: 41.0% city: 22.6%
- Percentage of females in sales and office occupations:
Here: 26.8% city: 29.5%
- Percentage of females in production occupations:
Here: 5.9% city: 3.0%
- Percentage of females in transportation occupations:
Here: 1.6% city: 1.1%
- Percentage of females in material moving occupations:
Here: 3.9% city: 1.7%
Percentage of people 16-64 in Armed Forces:
| South Broadway District: | 1.6% |
| Chula Vista: | 4.1% |
Education in this neighborhood (subdivision or community):
- Percentage of people 3 years and older in K-12 schools:
South Broadway District: 19.4% Chula Vista: 22.0%
- Percentage of people 3 years and older in undergraduate colleges:
South Broadway District: 8.3% Chula Vista: 7.6%
- Percentage of people 3 years and older in grad. or professional schools:
South Broadway District: 0.6% Chula Vista: 1.2%
- Percentage of students K-12 enrolled in private schools:
South Broadway District: 14.3% Chula Vista: 7.0%
Percentage of population below poverty level:
| South Broadway District: | 17.0% |
| Chula Vista: | 10.1% |
Median year owner moved in (as recorded in 2022):
Median year renter moved in (as recorded in 2022):
| South Broadway District: | 2007 |
| Chula Vista: | 2011 |
Median year renter moved in (as recorded in 2022):
| South Broadway District: | 2015 |
| Chula Vista: | 2018 |
Percentage of married-couple families with both working:
| South Broadway District: | 47.8% |
| Chula Vista: | 69.2% |

- 66.4%Utility gas
- 25.2%Electricity
- 3.8%No fuel used
- 1.9%Bottled, tank, or LP gas
- 1.9%Solar energy
- 0.9%Fuel oil, kerosene, etc.
Roads and streets:
Broadway
Length: 1.77 miles
Directions: N-S, SE-NW
Address range: 950 to 1811
Directions: N-S, SE-NW
Address range: 950 to 1811
Main (Sb) St (Main St)
Length: 0.64 miles
Direction: E-W
Address range: 2340 to 2722
Direction: E-W
Address range: 2340 to 2722
Faivre St
Length: 0.55 miles
Direction: E-W
Address range: 2320 to 2799
Direction: E-W
Address range: 2320 to 2799
Anita St
Length: 0.49 miles
Direction: E-W
Address range: 547 to 690
Direction: E-W
Address range: 547 to 690
Palomar St
Length: 0.47 miles
Direction: E-W
Address range: 600 to 767
Direction: E-W
Address range: 600 to 767
Oxford St
Length: 0.42 miles
Direction: E-W
Address range: 600 to 690
Direction: E-W
Address range: 600 to 690
Naples St
Length: 0.42 miles
Direction: E-W
Address range: 600 to 693
Direction: E-W
Address range: 600 to 693
Crested Butte St
Length: 0.38 miles
Directions: E-W, N-S, SE-NW
Address range: 600 to 699
Directions: E-W, N-S, SE-NW
Address range: 600 to 699
Moss St
Length: 0.37 miles
Direction: E-W
Address range: 600 to 699
Direction: E-W
Address range: 600 to 699
Silvas St
Length: 0.32 miles
Direction: N-S
Address range: 1590 to 1699
Direction: N-S
Address range: 1590 to 1699
Arizona St
Length: 0.32 miles
Directions: E-W, N-S
Address range: 600 to 699
Directions: E-W, N-S
Address range: 600 to 699
Oaklawn Ave
Length: 0.25 miles
Direction: N-S
Address range: 1000 to 1216
Direction: N-S
Address range: 1000 to 1216
Jefferson Ave
Length: 0.25 miles
Direction: N-S
Address range: 1000 to 1099
Direction: N-S
Address range: 1000 to 1099
Colorado Ave
Length: 0.25 miles
Direction: N-S
Address range: 1000 to 1099
Direction: N-S
Address range: 1000 to 1099
Woodlawn Ave
Length: 0.25 miles
Direction: N-S
Address range: 1000 to 1099
Direction: N-S
Address range: 1000 to 1099
Marsat Ct
Length: 0.20 miles
Direction: E-W
Address range: 600 to 699
Direction: E-W
Address range: 600 to 699
Jayken Way
Length: 0.20 miles
Direction: N-S
Address range: 1400 to 1599
Direction: N-S
Address range: 1400 to 1599
Madison Ave
Length: 0.18 miles
Direction: N-S
Address range: 900 to 1099
Direction: N-S
Address range: 900 to 1099
27th St
Length: 0.13 miles
Direction: N-S
Address range: 100 to 199
Direction: N-S
Address range: 100 to 199
Jacqua St
Length: 0.13 miles
Direction: N-S
Address range: 100 to 199
Direction: N-S
Address range: 100 to 199
27th (Sb) St
Length: 0.09 miles
Direction: N-S
Direction: N-S
Railroad features:
San Diego and Arizona Eastern Rlwy
Length: 1.38 miles
Directions: N-S, SE-NW
Directions: N-S, SE-NW
Other features:
Otay Riv
Length: 0.03 miles
Directions: E-W, SW-NE
Directions: E-W, SW-NE