Sholun neighborhood in Daly City, California (CA), 94015 detailed profile
Settings
X


Business Search - 14 Million verified businesses
Area: 0.108 square miles
Population: 1,146
Population density:
| Sholun: | 10,578 people per square mile |
| Daly City: | 13,224 people per square mile |

- 52644.3%Asian
- 41134.6%Hispanic or Latino
- 18815.8%White
- 181.5%Black
- 171.4%Native Hawaiian and Other
Pacific Islander - 161.3%Two or more races
- 80.7%Some other race
- 30.3%American Indian

Median household income in 2022:
| Sholun: | $109,438 |
| Daly City: | $109,227 |
Distribution of median household income
![Distribution of median household income]()
- 15Less than $10,000
- 14$10,000 to $19,999
- 27$20,000 to $29,999
- 54$30,000 to $39,999
- 32$40,000 to $49,999
- 27$50,000 to $59,999
- 28$60,000 to $74,999
- 67$75,000 to $99,999
- 47$100,000 to $124,999
- 39$125,000 to $149,999
- 29$150,000 to $199,999
- 59$200,000 or more

Distribution of owner-occupied house/condo value
![Distribution of owner-occupied house/condo value]()
- 7Less than $50,000
- 6$100,000 to $149,999
- 11$300,000 to $399,999
- 26$400,000 to $499,999
- 45$500,000 to $749,999
- 30$750,000 to $999,999
- 98$1,000,000 or more

Distribution of rent paid by renters
![Distribution of rent paid by renters]()
- 24$300 to $399
- 1$800 to $899
- 10$900 to $999
- 3$1,000 to $1,249
- 21$1,250 to $1,499
- 30$1,500 to $1,999
- 258$2,000 or more

Median rent in 2022:
| Sholun: | $2,290 |
| Daly City: | $2,001 |
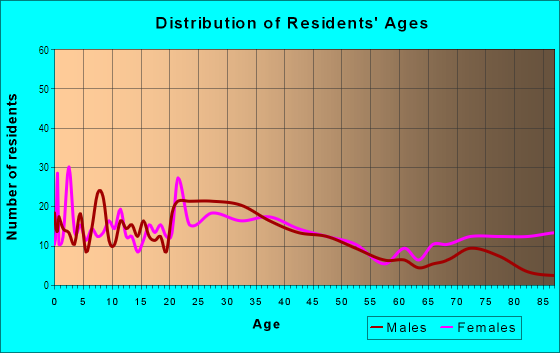
| Males: | 595 |
| Females: | 550 |
Males:
| This neighborhood: | 44.2 years |
| Whole city: | 40.9 years |
| This neighborhood: | 45.0 years |
| Whole city: | 44.8 years |
Average household size:
| Sholun: | 3.1 people |
| Daly City: | 3.1 people |
Percentage of family households:
| Sholun: | 65.3% |
| Daly City: | 40.3% |
| Here: | 53.2% |
| Daly City: | 50.3% |
Percentage of married-couple families with children (among all households):
| Sholun: | 25.0% |
| Daly City: | 23.9% |
Percentage of single-mother households (among all households):
| Sholun: | 1.5% |
| Daly City: | 5.7% |
Percentage of never married males 15 years old and over:
Percentage of never married females 15 years old and over:
| Sholun: | 16.8% |
| Daly City: | 22.6% |
Percentage of never married females 15 years old and over:
| Sholun: | 18.7% |
| city: | 17.9% |
Percentage of people that speak English not well or not at all:
| Sholun: | 21.8% |
| Daly City: | 11.2% |
Percentage of people born in this state:
Percentage of people born in another U.S. state:
Percentage of native residents but born outside the U.S.:
Percentage of foreign born residents:
| Here: | 39.0% |
| Daly City: | 41.1% |
Percentage of people born in another U.S. state:
| Sholun: | 5.2% |
| Daly City: | 5.1% |
Percentage of native residents but born outside the U.S.:
| Here: | 1.4% |
| city: | 1.8% |
Percentage of foreign born residents:
| Here: | 54.5% |
| Daly City: | 52.0% |

Owner-occupied
Renter-occupied


- Rooms in owner-occupied houses and condos in Sholun
- 151 room
- 532 rooms
- 653 rooms
- 234 rooms
- 655 rooms
- 126 rooms
- 177 rooms
- 138 rooms
- 419+ rooms

- Rooms in renter-occupied apartments in Sholun
- 951 room
- 252 rooms
- 1103 rooms
- 514 rooms
- 105 rooms
- 116 rooms
- 387 rooms
- 08 rooms
- 49+ rooms
Owner-occupied
Renter-occupied

- Bedrooms in owner-occupied houses and condos in Sholun
- 15no bedroom
- 871 bedroom
- 332 bedrooms
- 423 bedrooms
- 174 bedrooms
- 655+ bedrooms

- Bedrooms in renter-occupied apartments in Sholun
- 109no bedroom
- 1141 bedroom
- 682 bedrooms
- 153 bedrooms
- 74 bedrooms
- 225+ bedrooms
Average number of cars or other vehicles available in houses/condos:
Average number of cars or other vehicles available in apartments:
| This neighborhood: | |
| Daly City: |
Average number of cars or other vehicles available in apartments:
| Here: | 1.4 |
| city: | 1.6 |
Percentage of units with a mortgage:
| Sholun: | 72.0% |
| Daly City: | 61.0% |

- Year house built in Sholun
- 92020 or later
- 52010 to 2019
- 442000 to 2009
- 1111990 to 1999
- 341980 to 1989
- 1141970 to 1979
- 741960 to 1969
- 471950 to 1959
- 111940 to 1949
- 111939 or earlier

City-data.com crime index for city in 2020 (higher means more crime):
| City: | 129.4 |
| U.S. average: | 219.5 |
Travel time to work (commute)
![Travel time to work (commute)]()
- 24Less than 5 minutes
- 575 to 9 minutes
- 7710 to 14 minutes
- 25715 to 19 minutes
- 6920 to 24 minutes
- 2325 to 29 minutes
- 18230 to 34 minutes
- 2935 to 39 minutes
- 9440 to 44 minutes
- 5745 to 59 minutes
- 9960 to 89 minutes
- 4890 or more minutes

Means of transportation to work
![Means of transportation to work]()
- 47.6%314Drove a car alone
- 29.4%194Carpooled
- 5.0%33Bus
- 5.9%39Subway or elevated rail
- 1.4%9Long-distance train or commuter rail
- 0.5%3Light rail, streetcar or trolley
- 0.6%4Taxi
- 1.4%9Motorcycle
- 5.2%34Walked
- 0.8%5Other means
- 4.7%31Worked at home

Time leaving home to go to work
![Time leaving home to go to work]()
- 7412:00 a.m. to 4:59 a.m.
- 285:00 a.m. to 5:29 a.m.
- 175:30 a.m. to 5:59 a.m.
- 436:00 a.m. to 6:29 a.m.
- 1266:30 a.m. to 6:59 a.m.
- 1597:00 a.m. to 7:29 a.m.
- 427:30 a.m. to 7:59 a.m.
- 1408:00 a.m. to 8:29 a.m.
- 568:30 a.m. to 8:59 a.m.
- 1009:00 a.m. to 9:59 a.m.
- 3310:00 a.m. to 10:59 a.m.
- 1811:00 a.m. to 11:59 a.m.
- 9812:00 p.m. to 3:59 p.m.
- 1054:00 p.m. to 11:59 p.m.

Occupations of males:
- Percentage of males in management occupations (except farmers):
Here: 1.3% city: 7.8%
- Percentage of males in business and financial operations occupations:
Here: 2.5% city: 4.6%
- Percentage of males in computer and mathematical occupations:
Here: 1.3% city: 5.8%
- Percentage of males in community and social services occupations:
Here: 1.7% city: 0.9%
- Percentage of males in education, training, and library occupations:
Here: 3.0% city: 2.2%
- Percentage of males in service occupations:
Here: 47.9% city: 17.3%
- Percentage of males in sales and office occupations:
Here: 6.1% city: 17.7%
- Percentage of males in construction, extraction, and maintenance occupations:
Here: 5.0% city: 8.6%
- Percentage of males in production occupations:
Here: 4.8% city: 4.3%
- Percentage of males in transportation occupations:
Here: 1.4% city: 9.3%
- Percentage of males in material moving occupations:
Here: 17.3% city: 4.8%
Occupations of females:
- Percentage of females in management occupations (except farmers):
Here: 1.5% city: 8.1%
- Percentage of females in business and financial operations occupations:
Here: 1.4% city: 8.4%
- Percentage of females in education, training, and library occupations:
Here: 3.5% city: 5.1%
- Percentage of females in healthcare practitioners and technical occupations:
Here: 12.5% city: 10.8%
- Percentage of females in service occupations:
Here: 38.4% city: 25.2%
- Percentage of females in sales and office occupations:
Here: 40.2% city: 27.7%
Percentage of people 16-64 in Armed Forces:
| Sholun: | 0.0% |
| Daly City: | 0.3% |
Education in this neighborhood (subdivision or community):
- Percentage of people 3 years and older in K-12 schools:
Sholun: 22.8% Daly City: 11.4%
- Percentage of people 3 years and older in undergraduate colleges:
Sholun: 4.7% Daly City: 6.1%
- Percentage of people 3 years and older in grad. or professional schools:
Sholun: 1.6% Daly City: 2.0%
- Percentage of students K-12 enrolled in private schools:
Sholun: 91.1% Daly City: 20.0%
Percentage of population below poverty level:
| Sholun: | 8.8% |
| Daly City: | 11.3% |
Median year renter moved in (as recorded in 2022):
| Sholun: | 2015 |
| Daly City: | 2019 |
Percentage of married-couple families with both working:
| Sholun: | 65.9% |
| Daly City: | 65.5% |

- 54.6%Electricity
- 33.3%Utility gas
- 5.4%No fuel used
- 3.1%Other fuel
- 2.8%Solar energy
- 0.8%Bottled, tank, or LP gas
Highways in this neighborhood:
Cabrillo Hwy (State Hwy 1, Coast Hwy)
Length: 0.60 miles
Directions: E-W, SW-NE
Directions: E-W, SW-NE
Roads and streets:
State Hwy 1
Length: 0.59 miles
Directions: E-W, SW-NE
Directions: E-W, SW-NE
Southgate Ave
Length: 0.41 miles
Direction: E-W
Address range: 1423 to 1584
Direction: E-W
Address range: 1423 to 1584
Cerro Dr
Length: 0.34 miles
Directions: E-W, N-S, SW-NE
Address range: 200 to 399
Directions: E-W, N-S, SW-NE
Address range: 200 to 399
Escuela Dr
Length: 0.24 miles
Directions: E-W, N-S, SE-NW
Address range: 1 to 99
Directions: E-W, N-S, SE-NW
Address range: 1 to 99
Clarinada Ave
Length: 0.18 miles
Directions: E-W, SE-NW, SW-NE
Address range: 512 to 561
Directions: E-W, SE-NW, SW-NE
Address range: 512 to 561
Belhaven Ct
Length: 0.11 miles
Direction: E-W
Address range: 1 to 99
Direction: E-W
Address range: 1 to 99
Savage Way
Length: 0.05 miles
Direction: N-S
Direction: N-S
Cerro Ct
Length: 0.04 miles
Direction: E-W
Address range: 300 to 399
Direction: E-W
Address range: 300 to 399