San Ramon neighborhood in Novato, California (CA), 94945 detailed profile
Settings
X


Business Search - 14 Million verified businesses
Area: 0.336 square miles
Population: 812
Population density:
| San Ramon: | 2,419 people per square mile |
| Novato: | 1,915 people per square mile |

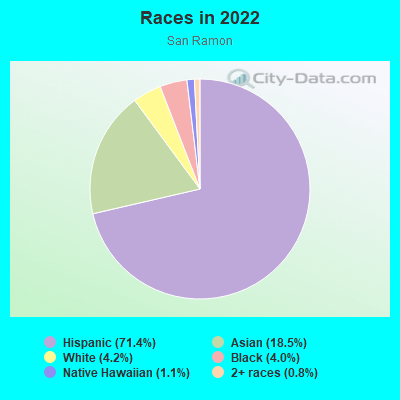
- 57070.3%White
- 11514.2%Hispanic or Latino
- 708.6%Asian
- 516.3%Two or more races
- 50.6%Black
Median household income in 2022:
| San Ramon: | $122,818 |
| Novato: | $110,948 |
Distribution of median household income
![Distribution of median household income]()
- 5Less than $10,000
- 4$10,000 to $19,999
- 8$20,000 to $29,999
- 16$30,000 to $39,999
- 58$40,000 to $49,999
- 21$50,000 to $59,999
- 11$60,000 to $74,999
- 44$75,000 to $99,999
- 50$100,000 to $124,999
- 23$125,000 to $149,999
- 61$150,000 to $199,999
- 89$200,000 or more

Distribution of owner-occupied house/condo value
![Distribution of owner-occupied house/condo value]()
- 2Less than $50,000
- 1$50,000 to $99,999
- 5$100,000 to $149,999
- 3$200,000 to $249,999
- 4$300,000 to $399,999
- 6$400,000 to $499,999
- 65$500,000 to $749,999
- 41$750,000 to $999,999
- 192$1,000,000 or more

Distribution of rent paid by renters
![Distribution of rent paid by renters]()
- 1Less than $100
- 3$600 to $699
- 19$1,250 to $1,499
- 49$2,000 or more

Median rent in 2022:
| San Ramon: | $2,516 |
| Novato: | $2,001 |
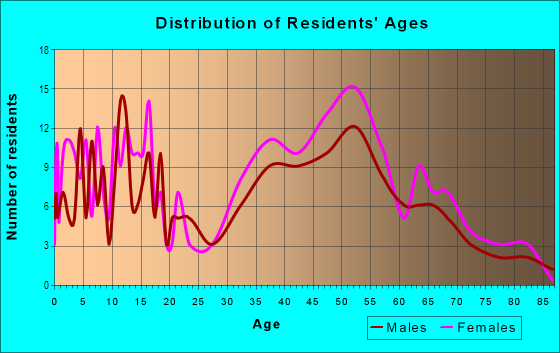
| Males: | 432 |
| Females: | 380 |
Males:
| This neighborhood: | 53.8 years |
| Whole city: | 48.1 years |
| This neighborhood: | 53.2 years |
| Whole city: | 49.5 years |
Average household size:
| San Ramon: | 2.3 people |
| Novato: | 2.5 people |
Percentage of family households:
| San Ramon: | 35.6% |
| Novato: | 40.9% |
| Here: | 55.0% |
| Novato: | 55.8% |
Percentage of married-couple families with children (among all households):
| San Ramon: | 43.0% |
| Novato: | 31.9% |
Percentage of single-mother households (among all households):
| San Ramon: | 3.2% |
| Novato: | 5.8% |
Percentage of never married males 15 years old and over:
Percentage of never married females 15 years old and over:
| San Ramon: | 13.1% |
| Novato: | 15.7% |
Percentage of never married females 15 years old and over:
| San Ramon: | 6.8% |
| city: | 12.8% |
Percentage of people that speak English not well or not at all:
| San Ramon: | 0.5% |
| Novato: | 5.4% |
Percentage of people born in this state:
Percentage of people born in another U.S. state:
Percentage of native residents but born outside the U.S.:
Percentage of foreign born residents:
| Here: | 54.5% |
| Novato: | 53.8% |
Percentage of people born in another U.S. state:
| San Ramon: | 31.7% |
| Novato: | 24.0% |
Percentage of native residents but born outside the U.S.:
| Here: | 1.6% |
| city: | 1.1% |
Percentage of foreign born residents:
| Here: | 12.2% |
| Novato: | 21.2% |
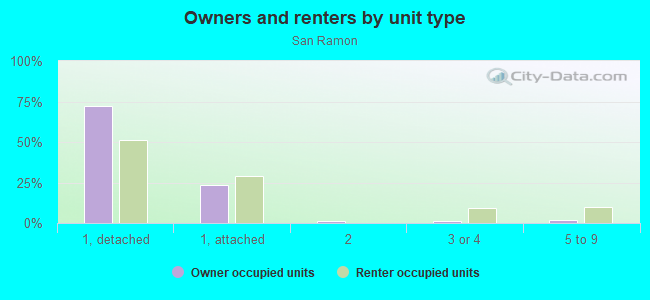
Owner-occupied
Renter-occupied

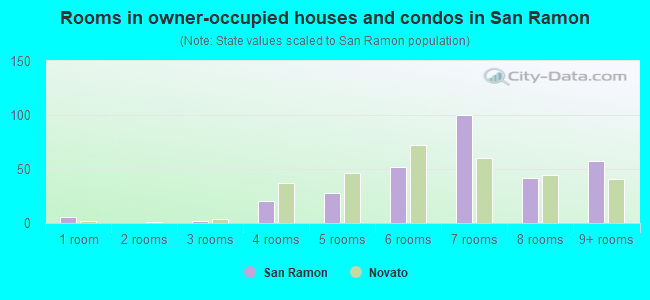
- Rooms in owner-occupied houses and condos in San Ramon
- 61 room
- 02 rooms
- 23 rooms
- 204 rooms
- 285 rooms
- 526 rooms
- 1007 rooms
- 428 rooms
- 579+ rooms
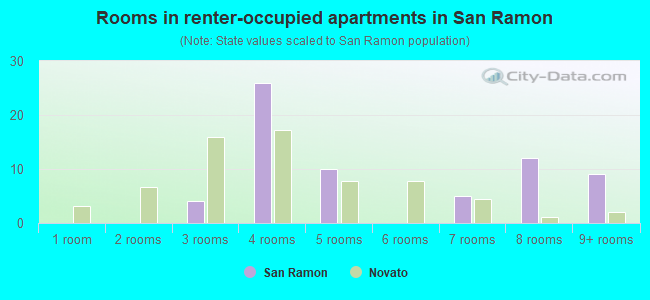
- Rooms in renter-occupied apartments in San Ramon
- 01 room
- 02 rooms
- 43 rooms
- 264 rooms
- 105 rooms
- 06 rooms
- 57 rooms
- 128 rooms
- 99+ rooms
Owner-occupied
Renter-occupied
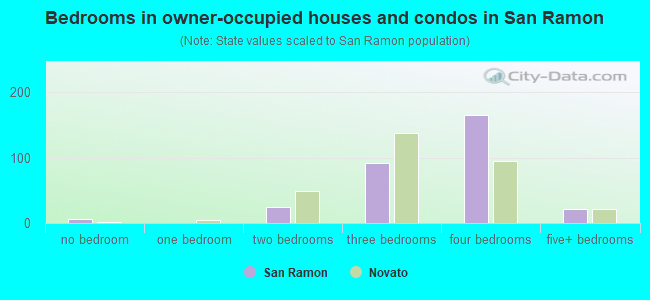
- Bedrooms in owner-occupied houses and condos in San Ramon
- 6no bedroom
- 01 bedroom
- 242 bedrooms
- 923 bedrooms
- 1654 bedrooms
- 215+ bedrooms
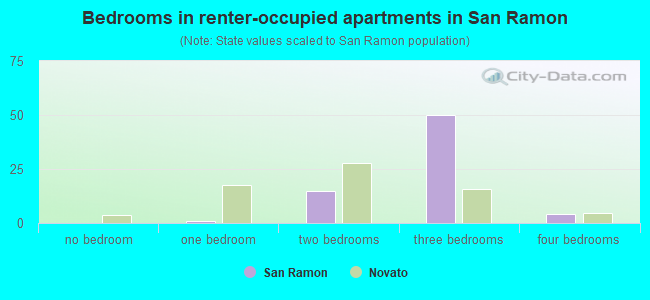
- Bedrooms in renter-occupied apartments in San Ramon
- 0no bedroom
- 11 bedroom
- 152 bedrooms
- 503 bedrooms
- 44 bedrooms
- 05+ bedrooms
Average number of cars or other vehicles available in houses/condos:
Average number of cars or other vehicles available in apartments:
| This neighborhood: | 1.9 |
| Novato: | 2.2 |
Average number of cars or other vehicles available in apartments:
| Here: | 2.3 |
| city: | 1.6 |
Percentage of units with a mortgage:
| San Ramon: | 60.3% |
| Novato: | 66.9% |
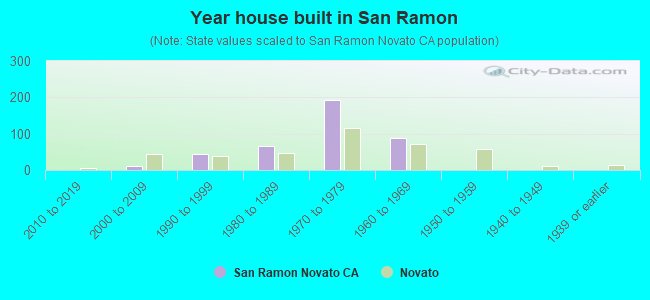
- Year house built in San Ramon
- 02020 or later
- 12010 to 2019
- 112000 to 2009
- 431990 to 1999
- 671980 to 1989
- 1931970 to 1979
- 881960 to 1969
- 11950 to 1959
- 01940 to 1949
- 11939 or earlier
City-data.com crime index for city in 2020 (higher means more crime):
| City: | 173.9 |
| U.S. average: | 219.5 |
Travel time to work (commute)
![Travel time to work (commute)]()
- 1Less than 5 minutes
- 95 to 9 minutes
- 510 to 14 minutes
- 515 to 19 minutes
- 820 to 24 minutes
- 525 to 29 minutes
- 1130 to 34 minutes
- 135 to 39 minutes
- 340 to 44 minutes
- 2745 to 59 minutes
- 1460 to 89 minutes
- 190 or more minutes

Means of transportation to work
![Means of transportation to work]()
- 61.3%225Drove a car alone
- 6.0%22Carpooled
- 5.5%20Bus
- 0.8%3Ferryboat
- 0.3%1Walked
- 1.6%6Other means
- 24.0%88Worked at home

Time leaving home to go to work
![Time leaving home to go to work]()
- 112:00 a.m. to 4:59 a.m.
- 25:00 a.m. to 5:29 a.m.
- 46:00 a.m. to 6:29 a.m.
- 46:30 a.m. to 6:59 a.m.
- 177:00 a.m. to 7:29 a.m.
- 87:30 a.m. to 7:59 a.m.
- 138:00 a.m. to 8:29 a.m.
- 38:30 a.m. to 8:59 a.m.
- 69:00 a.m. to 9:59 a.m.
- 510:00 a.m. to 10:59 a.m.
- 111:00 a.m. to 11:59 a.m.
- 312:00 p.m. to 3:59 p.m.
- 14:00 p.m. to 11:59 p.m.

Occupations of males:
- Percentage of males in management occupations (except farmers):
Here: 21.6% city: 17.8%
- Percentage of males in business and financial operations occupations:
Here: 10.7% city: 5.6%
- Percentage of males in computer and mathematical occupations:
Here: 7.4% city: 5.1%
- Percentage of males in life, physical, and social science occupations:
Here: 2.1% city: 1.2%
- Percentage of males in education, training, and library occupations:
Here: 4.8% city: 4.2%
- Percentage of males in arts, design, entertainment, sports, and media occupations:
Here: 6.7% city: 2.4%
- Percentage of males in healthcare practitioners and technical occupations:
Here: 5.3% city: 4.4%
- Percentage of males in service occupations:
Here: 12.0% city: 16.2%
- Percentage of males in sales and office occupations:
Here: 13.2% city: 15.7%
- Percentage of males in construction, extraction, and maintenance occupations:
Here: 7.4% city: 7.9%
- Percentage of males in production occupations:
Here: 4.4% city: 2.9%
- Percentage of males in material moving occupations:
Here: 2.1% city: 2.6%
Occupations of females:
- Percentage of females in management occupations (except farmers):
Here: 6.9% city: 12.5%
- Percentage of females in business and financial operations occupations:
Here: 4.3% city: 6.0%
- Percentage of females in computer and mathematical occupations:
Here: 2.4% city: 1.3%
- Percentage of females in architecture and engineering occupations:
Here: 1.5% city: 0.6%
- Percentage of females in life, physical, and social science occupations:
Here: 3.2% city: 1.7%
- Percentage of females in community and social services occupations:
Here: 1.5% city: 2.6%
- Percentage of females in legal occupations:
Here: 3.9% city: 1.4%
- Percentage of females in education, training, and library occupations:
Here: 13.0% city: 9.4%
- Percentage of females in arts, design, entertainment, sports, and media occupations:
Here: 3.7% city: 4.6%
- Percentage of females in healthcare practitioners and technical occupations:
Here: 7.1% city: 5.9%
- Percentage of females in service occupations:
Here: 14.0% city: 18.4%
- Percentage of females in sales and office occupations:
Here: 33.0% city: 31.8%
- Percentage of females in farming, fishing, and forestry occupations:
Here: 3.2% city: 0.1%
- Percentage of females in material moving occupations:
Here: 2.2% city: 1.6%
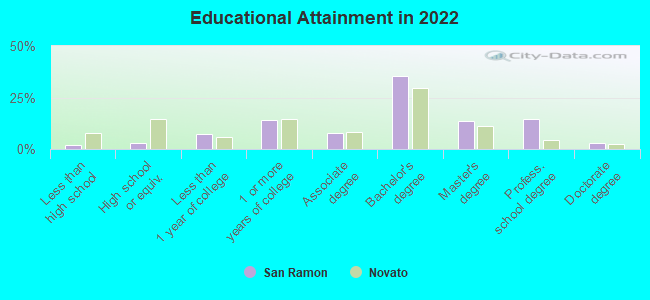
Education in this neighborhood (subdivision or community):
- Percentage of people 3 years and older in K-12 schools:
San Ramon: 11.1% Novato: 15.3%
- Percentage of people 3 years and older in undergraduate colleges:
San Ramon: 5.9% Novato: 4.0%
- Percentage of people 3 years and older in grad. or professional schools:
San Ramon: 1.3% Novato: 1.0%
- Percentage of students K-12 enrolled in private schools:
San Ramon: 6.8% Novato: 14.4%
Percentage of population below poverty level:
| San Ramon: | 2.5% |
| Novato: | 8.8% |
Median year owner moved in (as recorded in 2022):
Median year renter moved in (as recorded in 2022):
| San Ramon: | 1997 |
| Novato: | 2004 |
Median year renter moved in (as recorded in 2022):
| San Ramon: | 2015 |
| Novato: | 2015 |
Percentage of married-couple families with both working:
| San Ramon: | 82.7% |
| Novato: | 70.3% |
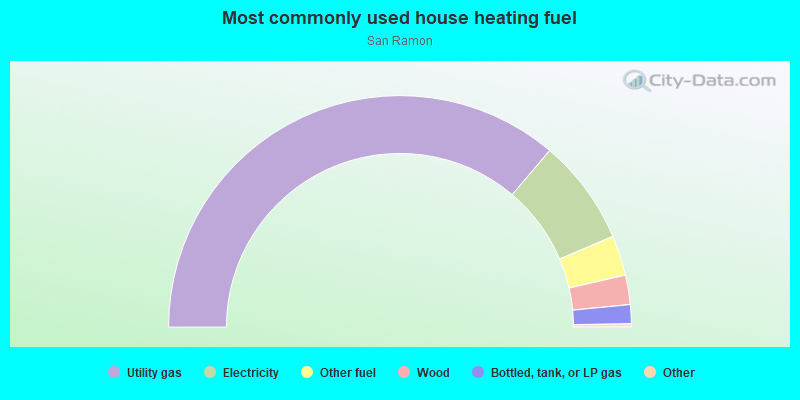
- 72.4%Utility gas
- 14.8%Electricity
- 5.6%Other fuel
- 4.1%Wood
- 2.7%Bottled, tank, or LP gas
Roads and streets:
San Felipe Way
Length: 1.07 miles
Directions: E-W, N-S, SE-NW, SW-NE
Address range: 1 to 299
Directions: E-W, N-S, SE-NW, SW-NE
Address range: 1 to 299
San Ramon Way
Length: 0.87 miles
Directions: E-W, N-S, SE-NW, SW-NE
Address range: 1 to 299
Directions: E-W, N-S, SE-NW, SW-NE
Address range: 1 to 299
San Carlos Way
Length: 0.81 miles
Directions: E-W, SE-NW
Address range: 1 to 199
Directions: E-W, SE-NW
Address range: 1 to 199
San Marin Dr
Length: 0.69 miles
Directions: E-W, N-S, SW-NE
Address range: 1 to 199
Directions: E-W, N-S, SW-NE
Address range: 1 to 199
San Miguel Way
Length: 0.49 miles
Directions: E-W, SW-NE
Address range: 20 to 99
Directions: E-W, SW-NE
Address range: 20 to 99
Aspen Dr
Length: 0.41 miles
Directions: E-W, N-S, SE-NW, SW-NE
Address range: 100 to 199
Directions: E-W, N-S, SE-NW, SW-NE
Address range: 100 to 199
San Benito Way
Length: 0.31 miles
Directions: E-W, N-S, SE-NW, SW-NE
Address range: 8 to 99
Directions: E-W, N-S, SE-NW, SW-NE
Address range: 8 to 99
Poplar Dr
Length: 0.15 miles
Directions: E-W, N-S, SE-NW, SW-NE
Address range: 1000 to 1099
Directions: E-W, N-S, SE-NW, SW-NE
Address range: 1000 to 1099
Hawthorne Ter
Length: 0.13 miles
Directions: E-W, SW-NE
Address range: 2000 to 2099
Directions: E-W, SW-NE
Address range: 2000 to 2099
Cedar Pl
Length: 0.10 miles
Directions: N-S, SW-NE
Address range: 600 to 699
Directions: N-S, SW-NE
Address range: 600 to 699
Santa Victoria Ct
Length: 0.06 miles
Direction: N-S
Address range: 1 to 99
Direction: N-S
Address range: 1 to 99
Myrtle Pl
Length: 0.06 miles
Directions: N-S, SW-NE
Directions: N-S, SW-NE
San Aleso Ct
Length: 0.06 miles
Direction: E-W
Address range: 1 to 99
Direction: E-W
Address range: 1 to 99
Magnolia Pl
Length: 0.06 miles
Direction: N-S
Address range: 500 to 599
Direction: N-S
Address range: 500 to 599
San Andreas Dr
Length: 0.06 miles
Direction: SE-NW
Direction: SE-NW
Sycamore Dr
Length: 0.05 miles
Direction: SW-NE
Address range: 900 to 999
Direction: SW-NE
Address range: 900 to 999
San Juan Ct
Length: 0.04 miles
Direction: E-W
Address range: 1 to 99
Direction: E-W
Address range: 1 to 99
Alder Pl
Length: 0.04 miles
Direction: N-S
Address range: 200 to 299
Direction: N-S
Address range: 200 to 299
Conifer Pl
Length: 0.04 miles
Direction: E-W
Address range: 300 to 399
Direction: E-W
Address range: 300 to 399
Spruce Pl
Length: 0.04 miles
Direction: SW-NE
Address range: 100 to 199
Direction: SW-NE
Address range: 100 to 199
San Miguel Ct
Length: 0.04 miles
Directions: N-S, SE-NW
Address range: 1 to 99
Directions: N-S, SE-NW
Address range: 1 to 99
Cottonwood Pl
Length: 0.04 miles
Direction: N-S
Address range: 1 to 99
Direction: N-S
Address range: 1 to 99
Pinon Pl (Pinyon Pl)
Length: 0.03 miles
Direction: N-S
Address range: 1 to 99
Direction: N-S
Address range: 1 to 99
Santa Yorma Ct
Length: 0.03 miles
Direction: N-S
Address range: 1 to 99
Direction: N-S
Address range: 1 to 99
Tamarack Pl (Tamaruck Pl)
Length: 0.03 miles
Direction: E-W
Address range: 400 to 416
Direction: E-W
Address range: 400 to 416
Citrus Pl
Length: 0.03 miles
Direction: N-S
Address range: 701 to 799
Direction: N-S
Address range: 701 to 799
San Marcos Ct
Length: 0.03 miles
Directions: N-S, SW-NE
Address range: 1 to 99
Directions: N-S, SW-NE
Address range: 1 to 99
Acacia Ct
Length: 0.03 miles
Direction: E-W
Address range: 500 to 599
Direction: E-W
Address range: 500 to 599
Santa Gabriella Ct
Length: 0.03 miles
Directions: N-S, SW-NE
Address range: 1 to 99
Directions: N-S, SW-NE
Address range: 1 to 99
(Juniper Pl)
Length: 0.03 miles
Directions: N-S, SE-NW
Address range: 800 to 899
Directions: N-S, SE-NW
Address range: 800 to 899
Walnut Pl (Walnut Ct)
Length: 0.02 miles
Direction: SW-NE
Address range: 700 to 799
Direction: SW-NE
Address range: 700 to 799