Sacramento City College (SCC) neighborhood in Sacramento, California (CA), 95818, 95822 detailed profile
Settings
X


Business Search - 14 Million verified businesses
Area: 0.110 square miles
Population: 1,129
Population density:
| Sacramento City College (SCC): | 10,237 people per square mile |
| Sacramento: | 5,435 people per square mile |

- 56748.5%White
- 48641.6%Hispanic or Latino
- 433.7%Asian
- 262.2%Some other race
- 161.4%Two or more races
- 141.2%Black
- 141.2%Native Hawaiian and Other
Pacific Islander - 30.3%American Indian

Distribution of median household income
![Distribution of median household income]()
- 14Less than $10,000
- 141$10,000 to $19,999
- 21$20,000 to $29,999
- 106$30,000 to $39,999
- 63$40,000 to $49,999
- 36$50,000 to $59,999
- 8$60,000 to $74,999
- 17$75,000 to $99,999
- 21$100,000 to $124,999
- 58$125,000 to $149,999
- 45$150,000 to $199,999
- 171$200,000 or more

Distribution of owner-occupied house/condo value
![Distribution of owner-occupied house/condo value]()
- 7Less than $50,000
- 11$50,000 to $99,999
- 11$150,000 to $199,999
- 12$250,000 to $299,999
- 9$300,000 to $399,999
- 24$400,000 to $499,999
- 32$500,000 to $749,999
- 71$750,000 to $999,999
- 187$1,000,000 or more

Distribution of rent paid by renters
![Distribution of rent paid by renters]()
- 86$200 to $299
- 3$500 to $599
- 16$700 to $799
- 60$800 to $899
- 19$900 to $999
- 28$1,000 to $1,249
- 30$1,250 to $1,499
- 46$1,500 to $1,999
- 18$2,000 or more

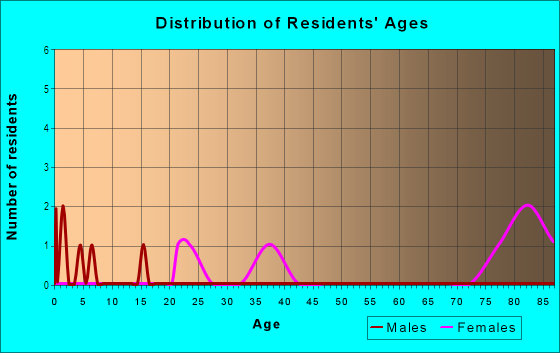
| Males: | 609 |
| Females: | 520 |
Males:
| This neighborhood: | 44.6 years |
| Whole city: | 35.5 years |
| This neighborhood: | 50.6 years |
| Whole city: | 36.6 years |
Average household size:
| Sacramento City College (SCC): | 2.2 people |
| Sacramento: | 2.6 people |
Percentage of family households:
| Sacramento City College (SCC): | 72.9% |
| Sacramento: | 42.4% |
| Here: | 74.1% |
| Sacramento: | 38.9% |
Percentage of married-couple families with children (among all households):
| Sacramento City College (SCC): | 26.3% |
| Sacramento: | 24.1% |
Percentage of single-mother households (among all households):
| Sacramento City College (SCC): | 6.4% |
| Sacramento: | 8.1% |
Percentage of never married males 15 years old and over:
Percentage of never married females 15 years old and over:
| Sacramento City College (SCC): | 5.5% |
| Sacramento: | 21.6% |
Percentage of never married females 15 years old and over:
| Sacramento City College (SCC): | 8.9% |
| city: | 20.9% |
Percentage of people that speak English not well or not at all:
| Sacramento City College (SCC): | 4.2% |
| Sacramento: | 8.0% |
Percentage of people born in this state:
Percentage of people born in another U.S. state:
Percentage of native residents but born outside the U.S.:
Percentage of foreign born residents:
| Here: | 72.0% |
| Sacramento: | 61.7% |
Percentage of people born in another U.S. state:
| Sacramento City College (SCC): | 22.4% |
| Sacramento: | 14.3% |
Percentage of native residents but born outside the U.S.:
| Here: | 0.6% |
| city: | 1.7% |
Percentage of foreign born residents:
| Here: | 5.0% |
| Sacramento: | 22.3% |

Owner-occupied
Renter-occupied


- Rooms in owner-occupied houses and condos in Sacramento City College <
> - 01 room
- 132 rooms
- 203 rooms
- 134 rooms
- 125 rooms
- 626 rooms
- 887 rooms
- 568 rooms
- 659+ rooms

- Rooms in renter-occupied apartments in Sacramento City College <
> - 871 room
- 42 rooms
- 403 rooms
- 344 rooms
- 85 rooms
- 286 rooms
- 57 rooms
- 78 rooms
- 99+ rooms
Owner-occupied
Renter-occupied

- Bedrooms in owner-occupied houses and condos in Sacramento City College <
> - 10no bedroom
- 131 bedroom
- 512 bedrooms
- 1193 bedrooms
- 1304 bedrooms
- 155+ bedrooms

- Bedrooms in renter-occupied apartments in Sacramento City College <
> - 87no bedroom
- 401 bedroom
- 342 bedrooms
- 163 bedrooms
- 104 bedrooms
- 55+ bedrooms
Average number of cars or other vehicles available in houses/condos:
Average number of cars or other vehicles available in apartments:
| This neighborhood: | 2.1 |
| Sacramento: | 2.1 |
Average number of cars or other vehicles available in apartments:
| Here: | 1.0 |
| city: | 1.5 |
Percentage of units with a mortgage:
| Sacramento City College (SCC): | 61.6% |
| Sacramento: | 69.5% |

- Year house built in Sacramento City College <
> - 02020 or later
- 472010 to 2019
- 72000 to 2009
- 21990 to 1999
- 171980 to 1989
- 61970 to 1979
- 491960 to 1969
- 2251950 to 1959
- 1141940 to 1949
- 1451939 or earlier

City-data.com crime index for city in 2020 (higher means more crime):
| City: | 328.2 |
| U.S. average: | 219.5 |
Travel time to work (commute)
![Travel time to work (commute)]()
- 6Less than 5 minutes
- 185 to 9 minutes
- 8010 to 14 minutes
- 7015 to 19 minutes
- 5720 to 24 minutes
- 1025 to 29 minutes
- 1430 to 34 minutes
- 335 to 39 minutes
- 540 to 44 minutes
- 945 to 59 minutes
- 360 to 89 minutes
- 390 or more minutes

Means of transportation to work
![Means of transportation to work]()
- 48.6%260Drove a car alone
- 5.2%28Carpooled
- 6.7%36Bus
- 1.1%6Long-distance train or commuter rail
- 3.2%17Light rail, streetcar or trolley
- 2.6%14Motorcycle
- 4.9%26Bicycle
- 0.7%4Walked
- 0.9%5Other means
- 42.1%225Worked at home

Time leaving home to go to work
![Time leaving home to go to work]()
- 712:00 a.m. to 4:59 a.m.
- 395:00 a.m. to 5:29 a.m.
- 55:30 a.m. to 5:59 a.m.
- 216:00 a.m. to 6:29 a.m.
- 216:30 a.m. to 6:59 a.m.
- 277:00 a.m. to 7:29 a.m.
- 707:30 a.m. to 7:59 a.m.
- 418:00 a.m. to 8:29 a.m.
- 478:30 a.m. to 8:59 a.m.
- 179:00 a.m. to 9:59 a.m.
- 210:00 a.m. to 10:59 a.m.
- 212:00 p.m. to 3:59 p.m.
- 154:00 p.m. to 11:59 p.m.

Occupations of males:
- Percentage of males in management occupations (except farmers):
Here: 13.1% city: 9.5%
- Percentage of males in business and financial operations occupations:
Here: 11.5% city: 5.8%
- Percentage of males in legal occupations:
Here: 3.0% city: 2.0%
- Percentage of males in arts, design, entertainment, sports, and media occupations:
Here: 22.5% city: 2.1%
- Percentage of males in healthcare practitioners and technical occupations:
Here: 10.5% city: 3.7%
- Percentage of males in service occupations:
Here: 3.6% city: 15.5%
- Percentage of males in sales and office occupations:
Here: 19.1% city: 16.4%
- Percentage of males in construction, extraction, and maintenance occupations:
Here: 7.4% city: 8.0%
- Percentage of males in production occupations:
Here: 3.8% city: 4.8%
- Percentage of males in transportation occupations:
Here: 2.1% city: 6.3%
Occupations of females:
- Percentage of females in management occupations (except farmers):
Here: 22.8% city: 9.7%
- Percentage of females in business and financial operations occupations:
Here: 4.3% city: 8.0%
- Percentage of females in architecture and engineering occupations:
Here: 5.5% city: 1.0%
- Percentage of females in community and social services occupations:
Here: 1.5% city: 2.9%
- Percentage of females in legal occupations:
Here: 10.2% city: 2.5%
- Percentage of females in education, training, and library occupations:
Here: 3.0% city: 7.1%
- Percentage of females in arts, design, entertainment, sports, and media occupations:
Here: 23.6% city: 2.5%
- Percentage of females in healthcare practitioners and technical occupations:
Here: 14.7% city: 7.4%
- Percentage of females in service occupations:
Here: 11.0% city: 20.0%
- Percentage of females in production occupations:
Here: 4.8% city: 2.5%
Education in this neighborhood (subdivision or community):
- Percentage of people 3 years and older in K-12 schools:
Sacramento City College (SCC): 20.6% Sacramento: 15.8%
- Percentage of people 3 years and older in undergraduate colleges:
Sacramento City College (SCC): 1.7% Sacramento: 6.8%
- Percentage of people 3 years and older in grad. or professional schools:
Sacramento City College (SCC): 2.9% Sacramento: 2.2%
- Percentage of students K-12 enrolled in private schools:
Sacramento City College (SCC): 14.5% Sacramento: 9.8%
Percentage of population below poverty level:
| Sacramento City College (SCC): | 5.6% |
| Sacramento: | 13.7% |
Median year owner moved in (as recorded in 2022):
| Sacramento City College (SCC): | 2010 |
| Sacramento: | 2012 |
Percentage of married-couple families with both working:
| Sacramento City College (SCC): | 89.9% |
| Sacramento: | 67.3% |

- 75.6%Utility gas
- 20.9%Electricity
- 2.3%Other fuel
- 1.1%Bottled, tank, or LP gas
Roads and streets:
Sutterville Rd
Length: 0.43 miles
Direction: E-W
Address range: 2038 to 2369
Direction: E-W
Address range: 2038 to 2369
Sutterville Byp
Length: 0.22 miles
Directions: E-W, N-S, SE-NW, SW-NE
Directions: E-W, N-S, SE-NW, SW-NE
E East Rd
Length: 0.18 miles
Directions: N-S, SE-NW
Directions: N-S, SE-NW
E Salt Rd
Length: 0.05 miles
Direction: E-W
Direction: E-W