Richland Park neighborhood in Richardson, Texas (TX), 75081, 75243 detailed profile
Settings
X


Business Search - 14 Million verified businesses
Area: 0.405 square miles
Population: 1,771
Population density:
| Richland Park: | 4,376 people per square mile |
| Richardson: | 4,160 people per square mile |

- 63635.4%White
- 58432.5%Asian
- 48727.1%Black
- 442.4%Two or more races
- 271.5%American Indian
- 191.1%Hispanic or Latino

Distribution of median household income
![Distribution of median household income]()
- 18Less than $10,000
- 86$10,000 to $19,999
- 66$20,000 to $29,999
- 171$30,000 to $39,999
- 227$40,000 to $49,999
- 143$50,000 to $59,999
- 77$60,000 to $74,999
- 105$75,000 to $99,999
- 6$100,000 to $124,999
- 32$125,000 to $149,999
- 59$150,000 to $199,999
- 245$200,000 or more

Distribution of owner-occupied house/condo value
![Distribution of owner-occupied house/condo value]()
- 101$50,000 to $99,999
- 30$100,000 to $149,999
- 13$150,000 to $199,999
- 29$200,000 to $249,999
- 31$250,000 to $299,999
- 80$300,000 to $399,999
- 18$400,000 to $499,999
- 6$500,000 to $749,999

Distribution of rent paid by renters
![Distribution of rent paid by renters]()
- 33$100 to $199
- 52$400 to $499
- 23$600 to $699
- 100$700 to $799
- 211$800 to $899
- 87$900 to $999
- 68$1,000 to $1,249
- 252$1,250 to $1,499
- 78$1,500 to $1,999

Median rent in 2022:
| Richland Park: | $912 |
| Richardson: | $1,560 |
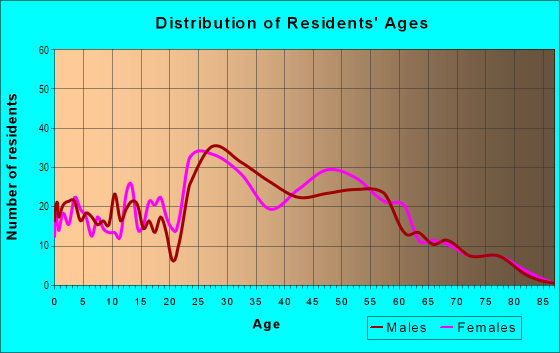
| Males: | 1,167 |
| Females: | 604 |
Males:
| This neighborhood: | 38.8 years |
| Whole city: | 34.6 years |
| This neighborhood: | 37.3 years |
| Whole city: | 36.0 years |
Average household size:
| Richland Park: | 2.9 people |
| Richardson: | 2.3 people |
Percentage of family households:
| Richland Park: | 36.8% |
| Richardson: | 41.4% |
| Here: | 33.6% |
| Richardson: | 44.1% |
Percentage of married-couple families with children (among all households):
| Richland Park: | 19.0% |
| Richardson: | 30.4% |
Percentage of single-mother households (among all households):
| Richland Park: | 15.8% |
| Richardson: | 8.7% |
Percentage of never married males 15 years old and over:
Percentage of never married females 15 years old and over:
| Richland Park: | 29.1% |
| Richardson: | 21.2% |
Percentage of never married females 15 years old and over:
| Richland Park: | 12.5% |
| city: | 18.3% |
Percentage of people that speak English not well or not at all:
| Richland Park: | 23.3% |
| Richardson: | 3.6% |
Percentage of people born in this state:
Percentage of people born in another U.S. state:
Percentage of native residents but born outside the U.S.:
Percentage of foreign born residents:
| Here: | 40.8% |
| Richardson: | 45.6% |
Percentage of people born in another U.S. state:
| Richland Park: | 18.8% |
| Richardson: | 30.8% |
Percentage of native residents but born outside the U.S.:
| Here: | 0.4% |
| city: | 1.5% |
Percentage of foreign born residents:
| Here: | 40.0% |
| Richardson: | 22.1% |

Owner-occupied
Renter-occupied


- Rooms in owner-occupied houses and condos in Richland Park
- 01 room
- 02 rooms
- 123 rooms
- 84 rooms
- 305 rooms
- 126 rooms
- 377 rooms
- 248 rooms
- 569+ rooms

- Rooms in renter-occupied apartments in Richland Park
- 731 room
- 2322 rooms
- 653 rooms
- 3784 rooms
- 865 rooms
- 586 rooms
- 07 rooms
- 08 rooms
- 339+ rooms
Owner-occupied
Renter-occupied

- Bedrooms in owner-occupied houses and condos in Richland Park
- 0no bedroom
- 871 bedroom
- 242 bedrooms
- 1013 bedrooms
- 474 bedrooms
- 365+ bedrooms

- Bedrooms in renter-occupied apartments in Richland Park
- 73no bedroom
- 2971 bedroom
- 672 bedrooms
- 773 bedrooms
- 64 bedrooms
- 05+ bedrooms
Average number of cars or other vehicles available in houses/condos:
Average number of cars or other vehicles available in apartments:
| This neighborhood: | 2.3 |
| Richardson: | 2.0 |
Average number of cars or other vehicles available in apartments:
| Here: | 1.3 |
| city: | 1.3 |
Percentage of units with a mortgage:
| Richland Park: | 36.7% |
| Richardson: | 57.8% |
Average estimated value of detached houses in 2022 (26.2% of all units):
| Richland Park: | $314,000 |
| Richardson: | $422,742 |

- Year house built in Richland Park
- 02020 or later
- 2102010 to 2019
- 192000 to 2009
- 01990 to 1999
- 3501980 to 1989
- 771970 to 1979
- 211960 to 1969
- 441950 to 1959
- 1041940 to 1949
- 171939 or earlier

City-data.com crime index for city in 2020 (higher means more crime):
| City: | 145.3 |
| U.S. average: | 219.5 |
Travel time to work (commute)
![Travel time to work (commute)]()
- 11Less than 5 minutes
- 985 to 9 minutes
- 9310 to 14 minutes
- 39015 to 19 minutes
- 65420 to 24 minutes
- 8825 to 29 minutes
- 72830 to 34 minutes
- 19635 to 39 minutes
- 16040 to 44 minutes
- 1945 to 59 minutes
- 2860 to 89 minutes
- 3890 or more minutes

Means of transportation to work
![Means of transportation to work]()
- 38.7%336Drove a car alone
- 7.1%62Carpooled
- 2.6%23Bus
- 1.5%13Light rail, streetcar or trolley
- 24.2%210Other means
- 29.7%258Worked at home

Time leaving home to go to work
![Time leaving home to go to work]()
- 21512:00 a.m. to 4:59 a.m.
- 1135:30 a.m. to 5:59 a.m.
- 1026:00 a.m. to 6:29 a.m.
- 1026:30 a.m. to 6:59 a.m.
- 7947:00 a.m. to 7:29 a.m.
- 2247:30 a.m. to 7:59 a.m.
- 4578:00 a.m. to 8:29 a.m.
- 1138:30 a.m. to 8:59 a.m.
- 1499:00 a.m. to 9:59 a.m.
- 21010:00 a.m. to 10:59 a.m.
- 1111:00 a.m. to 11:59 a.m.
- 16812:00 p.m. to 3:59 p.m.
- 1184:00 p.m. to 11:59 p.m.

Occupations of males:
- Percentage of males in management occupations (except farmers):
Here: 3.1% city: 16.1%
- Percentage of males in business and financial operations occupations:
Here: 35.7% city: 9.6%
- Percentage of males in computer and mathematical occupations:
Here: 32.6% city: 10.4%
- Percentage of males in architecture and engineering occupations:
Here: 2.0% city: 5.6%
- Percentage of males in life, physical, and social science occupations:
Here: 1.6% city: 0.7%
- Percentage of males in legal occupations:
Here: 3.2% city: 1.6%
- Percentage of males in education, training, and library occupations:
Here: 19.2% city: 5.6%
- Percentage of males in arts, design, entertainment, sports, and media occupations:
Here: 5.6% city: 2.9%
- Percentage of males in healthcare practitioners and technical occupations:
Here: 16.5% city: 3.0%
- Percentage of males in service occupations:
Here: 4.2% city: 9.7%
- Percentage of males in sales and office occupations:
Here: 12.9% city: 15.4%
- Percentage of males in construction, extraction, and maintenance occupations:
Here: 26.8% city: 4.5%
- Percentage of males in production occupations:
Here: 7.0% city: 3.6%
- Percentage of males in transportation occupations:
Here: 2.5% city: 3.6%
- Percentage of males in material moving occupations:
Here: 5.4% city: 2.8%
Occupations of females:
- Percentage of females in management occupations (except farmers):
Here: 13.4% city: 10.7%
- Percentage of females in business and financial operations occupations:
Here: 8.2% city: 12.7%
- Percentage of females in computer and mathematical occupations:
Here: 5.8% city: 3.9%
- Percentage of females in community and social services occupations:
Here: 51.7% city: 2.2%
- Percentage of females in education, training, and library occupations:
Here: 11.2% city: 11.4%
- Percentage of females in arts, design, entertainment, sports, and media occupations:
Here: 3.7% city: 2.1%
- Percentage of females in healthcare practitioners and technical occupations:
Here: 27.4% city: 11.0%
- Percentage of females in service occupations:
Here: 19.4% city: 13.6%
- Percentage of females in sales and office occupations:
Here: 47.8% city: 24.3%
- Percentage of females in material moving occupations:
Here: 4.2% city: 2.0%
Education in this neighborhood (subdivision or community):
- Percentage of people 3 years and older in K-12 schools:
Richland Park: 23.5% Richardson: 15.3%
- Percentage of people 3 years and older in undergraduate colleges:
Richland Park: 11.5% Richardson: 9.6%
- Percentage of people 3 years and older in grad. or professional schools:
Richland Park: 1.8% Richardson: 2.4%
- Percentage of students K-12 enrolled in private schools:
Richland Park: 0.0% Richardson: 18.8%
Percentage of population below poverty level:
| Richland Park: | 14.0% |
| Richardson: | 12.1% |
Median year owner moved in (as recorded in 2022):
Median year renter moved in (as recorded in 2022):
| Richland Park: | 1998 |
| Richardson: | 2010 |
Median year renter moved in (as recorded in 2022):
| Richland Park: | 2019 |
| Richardson: | 2021 |
Percentage of married-couple families with both working:
| Richland Park: | 36.3% |
| Richardson: | 68.7% |

- 74.1%Electricity
- 25.9%Utility gas
Roads and streets:
Wentworth Dr
Length: 0.77 miles
Direction: E-W
Address range: 500 to 699
Direction: E-W
Address range: 500 to 699
Harvest Glen Dr
Length: 0.76 miles
Directions: E-W, N-S, SE-NW
Address range: 400 to 699
Directions: E-W, N-S, SE-NW
Address range: 400 to 699
Goodwin Dr
Length: 0.76 miles
Directions: E-W, N-S, SE-NW
Address range: 400 to 699
Directions: E-W, N-S, SE-NW
Address range: 400 to 699
Stillmeadow Dr
Length: 0.76 miles
Direction: E-W
Address range: 400 to 699
Direction: E-W
Address range: 400 to 699
Sheffield Dr
Length: 0.69 miles
Directions: E-W, N-S, SE-NW
Address range: 500 to 699
Directions: E-W, N-S, SE-NW
Address range: 500 to 699
Tiffany Trl
Length: 0.67 miles
Direction: E-W
Address range: 500 to 699
Direction: E-W
Address range: 500 to 699
Richland Park Dr
Length: 0.52 miles
Directions: N-S, SW-NE
Address range: 1000 to 1267
Directions: N-S, SW-NE
Address range: 1000 to 1267
Birch Ln
Length: 0.49 miles
Directions: E-W, SW-NE
Address range: 500 to 699
Directions: E-W, SW-NE
Address range: 500 to 699
Audelia Rd
Length: 0.48 miles
Direction: N-S
Address range: 1172 to 13098
Direction: N-S
Address range: 1172 to 13098
Lois Ln (S Lois Ln)
Length: 0.36 miles
Directions: E-W, N-S, SW-NE
Address range: 976 to 1151
Directions: E-W, N-S, SW-NE
Address range: 976 to 1151
Park Bend Dr
Length: 0.35 miles
Directions: E-W, SE-NW
Address range: 428 to 699
Directions: E-W, SE-NW
Address range: 428 to 699
Whispering Oaks Ln
Length: 0.22 miles
Directions: N-S, SE-NW
Address range: 1100 to 1299
Directions: N-S, SE-NW
Address range: 1100 to 1299
Hilton Dr
Length: 0.12 miles
Directions: N-S, SW-NE
Address range: 1100 to 1199
Directions: N-S, SW-NE
Address range: 1100 to 1199
Halwin Cir
Length: 0.12 miles
Direction: N-S
Address range: 13100 to 13199
Direction: N-S
Address range: 13100 to 13199
River Oaks Ln
Length: 0.10 miles
Directions: E-W, SW-NE
Address range: 400 to 499
Directions: E-W, SW-NE
Address range: 400 to 499
Victorian Ct
Length: 0.08 miles
Directions: E-W, N-S, SE-NW
Address range: 9800 to 9899
Directions: E-W, N-S, SE-NW
Address range: 9800 to 9899
Post Oak Dr
Length: 0.06 miles
Direction: N-S
Address range: 600 to 1299
Direction: N-S
Address range: 600 to 1299
Claymore Dr
Length: 0.05 miles
Direction: E-W
Address range: 9800 to 9849
Direction: E-W
Address range: 9800 to 9849