Raynor Park neighborhood in Sunnyvale, California (CA), 94087 detailed profile
Settings
X

Business Search - 14 Million verified businesses
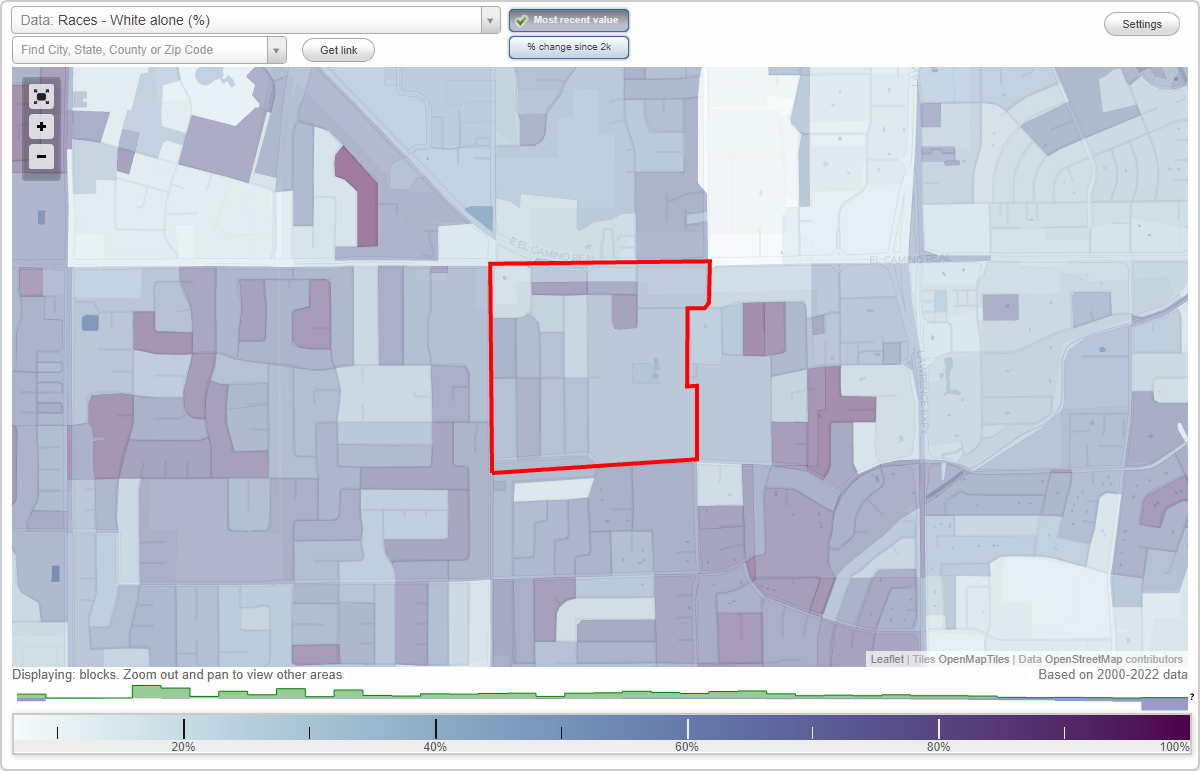
Area: 0.232 square miles
Population: 2,348
Population density:
| Raynor Park: | 10,128 people per square mile |
| Sunnyvale: | 6,978 people per square mile |

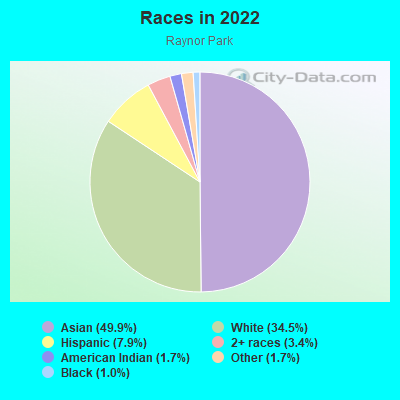
- 1,20749.9%Asian
- 83434.5%White
- 1917.9%Hispanic or Latino
- 823.4%Two or more races
- 411.7%American Indian
- 401.7%Some other race
- 241.0%Black
Median household income in 2022:
| Raynor Park: | $191,519 |
| Sunnyvale: | $169,781 |
Distribution of median household income
![Distribution of median household income]()
- 54Less than $10,000
- 197$10,000 to $19,999
- 46$20,000 to $29,999
- 54$30,000 to $39,999
- 37$40,000 to $49,999
- 34$50,000 to $59,999
- 68$60,000 to $74,999
- 48$75,000 to $99,999
- 61$100,000 to $124,999
- 42$125,000 to $149,999
- 76$150,000 to $199,999
- 467$200,000 or more

Distribution of owner-occupied house/condo value
![Distribution of owner-occupied house/condo value]()
- 25Less than $50,000
- 19$50,000 to $99,999
- 60$200,000 to $249,999
- 4$250,000 to $299,999
- 20$400,000 to $499,999
- 46$500,000 to $749,999
- 68$750,000 to $999,999
- 361$1,000,000 or more

Distribution of rent paid by renters
![Distribution of rent paid by renters]()
- 6$200 to $299
- 5$500 to $599
- 2$700 to $799
- 17$800 to $899
- 42$1,250 to $1,499
- 46$1,500 to $1,999
- 476$2,000 or more

Median rent in 2022:
| Raynor Park: | $3,251 |
| Sunnyvale: | $2,001 |
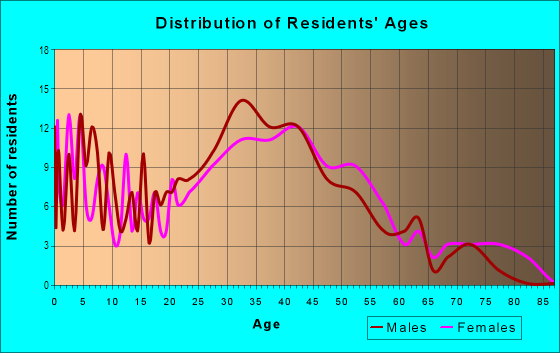
| Males: | 1,126 |
| Females: | 1,221 |
Males:
| This neighborhood: | 36.1 years |
| Whole city: | 34.2 years |
| This neighborhood: | 38.0 years |
| Whole city: | 37.1 years |
Average household size:
| Raynor Park: | 2.4 people |
| Sunnyvale: | 2.6 people |
Percentage of family households:
| Raynor Park: | 57.9% |
| Sunnyvale: | 47.1% |
| Here: | 54.7% |
| Sunnyvale: | 50.8% |
Percentage of married-couple families with children (among all households):
| Raynor Park: | 36.1% |
| Sunnyvale: | 33.2% |
Percentage of single-mother households (among all households):
| Raynor Park: | 10.3% |
| Sunnyvale: | 4.2% |
Percentage of never married males 15 years old and over:
Percentage of never married females 15 years old and over:
| Raynor Park: | 15.9% |
| Sunnyvale: | 23.3% |
Percentage of never married females 15 years old and over:
| Raynor Park: | 13.8% |
| city: | 13.4% |
Percentage of people that speak English not well or not at all:
| Raynor Park: | 2.2% |
| Sunnyvale: | 8.1% |
Percentage of people born in this state:
Percentage of people born in another U.S. state:
Percentage of native residents but born outside the U.S.:
Percentage of foreign born residents:
| Here: | 38.7% |
| Sunnyvale: | 37.8% |
Percentage of people born in another U.S. state:
| Raynor Park: | 15.2% |
| Sunnyvale: | 12.0% |
Percentage of native residents but born outside the U.S.:
| Here: | 1.1% |
| city: | 1.7% |
Percentage of foreign born residents:
| Here: | 45.0% |
| Sunnyvale: | 48.5% |
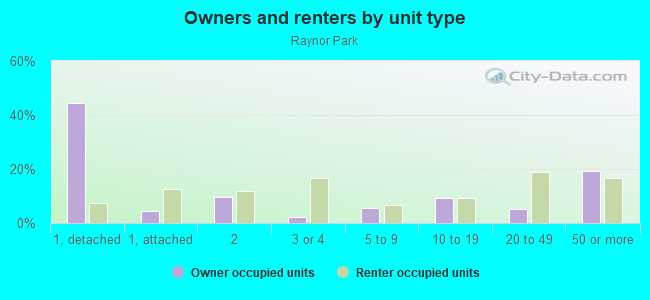
Owner-occupied
Renter-occupied

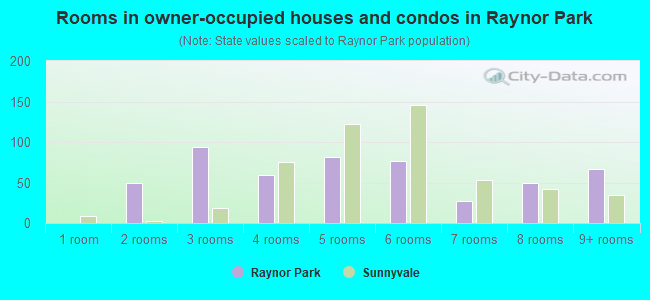
- Rooms in owner-occupied houses and condos in Raynor Park
- 01 room
- 492 rooms
- 943 rooms
- 594 rooms
- 815 rooms
- 766 rooms
- 277 rooms
- 508 rooms
- 679+ rooms
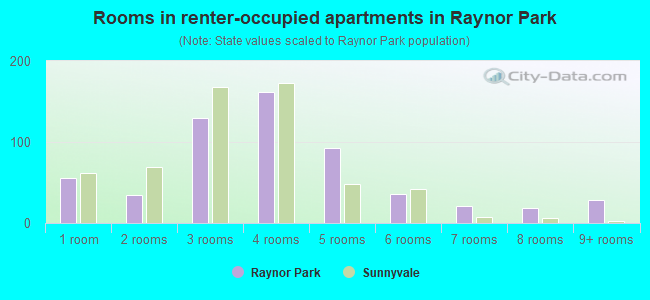
- Rooms in renter-occupied apartments in Raynor Park
- 561 room
- 352 rooms
- 1303 rooms
- 1624 rooms
- 925 rooms
- 366 rooms
- 217 rooms
- 188 rooms
- 289+ rooms
Owner-occupied
Renter-occupied
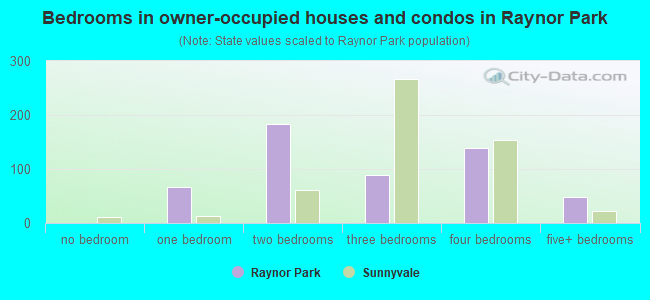
- Bedrooms in owner-occupied houses and condos in Raynor Park
- 0no bedroom
- 671 bedroom
- 1842 bedrooms
- 893 bedrooms
- 1394 bedrooms
- 495+ bedrooms
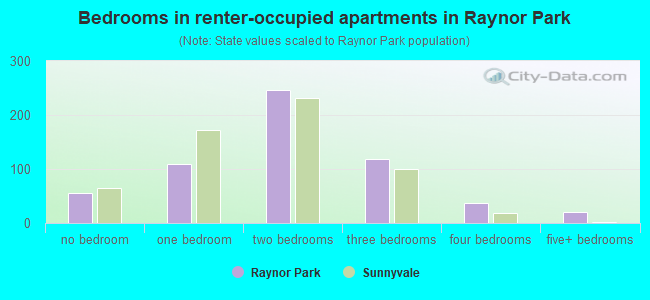
- Bedrooms in renter-occupied apartments in Raynor Park
- 56no bedroom
- 1101 bedroom
- 2472 bedrooms
- 1183 bedrooms
- 374 bedrooms
- 205+ bedrooms
Average number of cars or other vehicles available in houses/condos:
Average number of cars or other vehicles available in apartments:
| This neighborhood: | 1.9 |
| Sunnyvale: | 2.0 |
Average number of cars or other vehicles available in apartments:
| Here: | 1.4 |
| city: | 1.5 |
Percentage of units with a mortgage:
| Raynor Park: | 66.3% |
| Sunnyvale: | 57.7% |
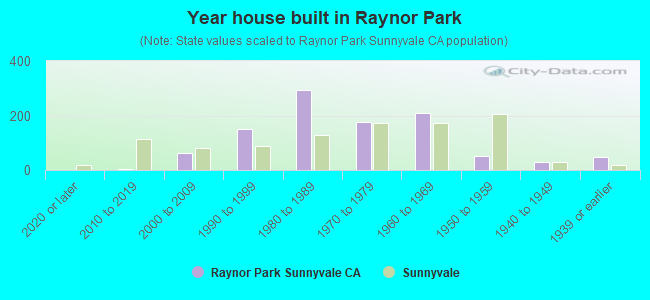
- Year house built in Raynor Park
- 02020 or later
- 22010 to 2019
- 622000 to 2009
- 1521990 to 1999
- 2951980 to 1989
- 1771970 to 1979
- 2101960 to 1969
- 521950 to 1959
- 301940 to 1949
- 481939 or earlier
City-data.com crime index for city in 2020 (higher means more crime):
| City: | 151.0 |
| U.S. average: | 219.5 |
Travel time to work (commute)
![Travel time to work (commute)]()
- 13Less than 5 minutes
- 135 to 9 minutes
- 10010 to 14 minutes
- 11615 to 19 minutes
- 12620 to 24 minutes
- 4725 to 29 minutes
- 7230 to 34 minutes
- 1835 to 39 minutes
- 2240 to 44 minutes
- 4545 to 59 minutes
- 660 to 89 minutes
- 990 or more minutes

Means of transportation to work
![Means of transportation to work]()
- 59.9%652Drove a car alone
- 3.4%37Carpooled
- 5.4%59Bus
- 3.0%33Long-distance train or commuter rail
- 9.0%98Taxi
- 2.8%31Bicycle
- 0.2%2Walked
- 0.4%4Other means
- 30.2%328Worked at home

Time leaving home to go to work
![Time leaving home to go to work]()
- 412:00 a.m. to 4:59 a.m.
- 25:00 a.m. to 5:29 a.m.
- 215:30 a.m. to 5:59 a.m.
- 76:00 a.m. to 6:29 a.m.
- 116:30 a.m. to 6:59 a.m.
- 537:00 a.m. to 7:29 a.m.
- 627:30 a.m. to 7:59 a.m.
- 958:00 a.m. to 8:29 a.m.
- 838:30 a.m. to 8:59 a.m.
- 1499:00 a.m. to 9:59 a.m.
- 4410:00 a.m. to 10:59 a.m.
- 1211:00 a.m. to 11:59 a.m.
- 1512:00 p.m. to 3:59 p.m.
- 104:00 p.m. to 11:59 p.m.

Occupations of males:
- Percentage of males in management occupations (except farmers):
Here: 27.5% city: 12.9%
- Percentage of males in business and financial operations occupations:
Here: 5.1% city: 3.9%
- Percentage of males in computer and mathematical occupations:
Here: 27.7% city: 36.0%
- Percentage of males in architecture and engineering occupations:
Here: 18.9% city: 11.7%
- Percentage of males in community and social services occupations:
Here: 1.4% city: 0.5%
- Percentage of males in legal occupations:
Here: 3.5% city: 0.5%
- Percentage of males in arts, design, entertainment, sports, and media occupations:
Here: 3.4% city: 1.0%
- Percentage of males in service occupations:
Here: 1.8% city: 6.8%
- Percentage of males in sales and office occupations:
Here: 6.4% city: 9.4%
- Percentage of males in transportation occupations:
Here: 1.1% city: 2.9%
Occupations of females:
- Percentage of females in management occupations (except farmers):
Here: 14.1% city: 12.6%
- Percentage of females in business and financial operations occupations:
Here: 8.3% city: 9.5%
- Percentage of females in computer and mathematical occupations:
Here: 16.2% city: 17.6%
- Percentage of females in architecture and engineering occupations:
Here: 6.1% city: 5.6%
- Percentage of females in life, physical, and social science occupations:
Here: 3.1% city: 3.1%
- Percentage of females in legal occupations:
Here: 2.6% city: 1.2%
- Percentage of females in education, training, and library occupations:
Here: 13.5% city: 7.5%
- Percentage of females in arts, design, entertainment, sports, and media occupations:
Here: 3.5% city: 3.5%
- Percentage of females in healthcare practitioners and technical occupations:
Here: 5.8% city: 5.1%
- Percentage of females in service occupations:
Here: 2.7% city: 12.0%
- Percentage of females in sales and office occupations:
Here: 22.9% city: 16.1%
- Percentage of females in production occupations:
Here: 1.7% city: 2.9%
- Percentage of females in material moving occupations:
Here: 1.2% city: 1.0%
Percentage of people 16-64 in Armed Forces:
| Raynor Park: | 0.0% |
| Sunnyvale: | 0.1% |
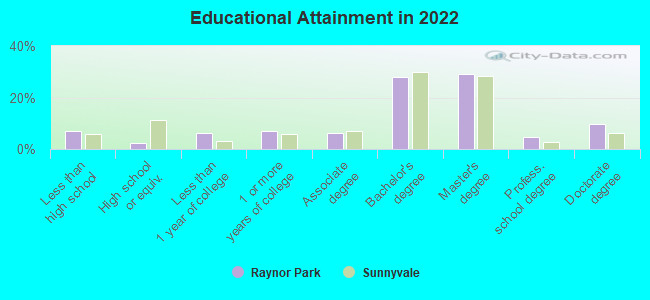
Education in this neighborhood (subdivision or community):
- Percentage of people 3 years and older in K-12 schools:
Raynor Park: 25.3% Sunnyvale: 12.5%
- Percentage of people 3 years and older in undergraduate colleges:
Raynor Park: 2.2% Sunnyvale: 5.1%
- Percentage of people 3 years and older in grad. or professional schools:
Raynor Park: 5.4% Sunnyvale: 2.3%
- Percentage of students K-12 enrolled in private schools:
Raynor Park: 25.7% Sunnyvale: 14.9%
Percentage of population below poverty level:
| Raynor Park: | 6.2% |
| Sunnyvale: | 6.2% |
Median year owner moved in (as recorded in 2022):
| Raynor Park: | 2005 |
| Sunnyvale: | 2008 |
Percentage of married-couple families with both working:
| Raynor Park: | 53.8% |
| Sunnyvale: | 69.8% |

- 53.6%Electricity
- 39.2%Utility gas
- 3.1%No fuel used
- 2.6%Other fuel
- 1.5%Bottled, tank, or LP gas
Highways in this neighborhood:
E el Camino Real (el Camino Real, State Hwy 82)
Length: 0.36 miles
Directions: E-W, SW-NE
Address range: 967 to 1049
Directions: E-W, SW-NE
Address range: 967 to 1049
Roads and streets:
Bryant Way
Length: 0.47 miles
Direction: E-W
Address range: 900 to 1005
Direction: E-W
Address range: 900 to 1005
Norman Dr
Length: 0.45 miles
Direction: N-S
Address range: 1200 to 1499
Direction: N-S
Address range: 1200 to 1499
Navarro Dr
Length: 0.38 miles
Direction: N-S
Address range: 1300 to 1499
Direction: N-S
Address range: 1300 to 1499
Ramon Dr
Length: 0.36 miles
Directions: N-S, SE-NW
Address range: 1300 to 1499
Directions: N-S, SE-NW
Address range: 1300 to 1499
Hampton Dr
Length: 0.33 miles
Direction: N-S
Address range: 1300 to 1499
Direction: N-S
Address range: 1300 to 1499
Marion Way
Length: 0.25 miles
Directions: E-W, SE-NW
Address range: 941 to 4699
Directions: E-W, SE-NW
Address range: 941 to 4699
Elizabeth Way
Length: 0.24 miles
Direction: E-W
Address range: 942 to 999
Direction: E-W
Address range: 942 to 999
Eleanor Way
Length: 0.16 miles
Directions: E-W, N-S, SW-NE
Address range: 917 to 1399
Directions: E-W, N-S, SW-NE
Address range: 917 to 1399
Poplar Ave
Length: 0.14 miles
Direction: N-S
Address range: 1300 to 1399
Direction: N-S
Address range: 1300 to 1399
Dunford Way
Length: 0.10 miles
Directions: E-W, SE-NW
Address range: 900 to 999
Directions: E-W, SE-NW
Address range: 900 to 999
Rosalia Ave
Length: 0.08 miles
Directions: N-S, SE-NW
Address range: 1300 to 1399
Directions: N-S, SE-NW
Address range: 1300 to 1399
Alice Way
Length: 0.07 miles
Direction: E-W
Address range: 900 to 999
Direction: E-W
Address range: 900 to 999