Peninsula Gateway (Peninsula) neighborhood in Daly City, California (CA), 94112, 94014, 94015 detailed profile
Settings
X


Business Search - 14 Million verified businesses
Area: 0.288 square miles
Population: 2,958
Population density:
| Peninsula Gateway (Peninsula): | 10,286 people per square mile |
| Daly City: | 13,224 people per square mile |

- 1,56450.7%Asian
- 68522.2%Hispanic or Latino
- 56518.3%White
- 963.1%Some other race
- 882.9%Two or more races
- 491.6%Black
- 401.3%American Indian

Median household income in 2022:
| Peninsula Gateway (Peninsula): | $101,709 |
| Daly City: | $109,227 |
Distribution of median household income
![Distribution of median household income]()
- 45Less than $10,000
- 53$10,000 to $19,999
- 52$20,000 to $29,999
- 213$30,000 to $39,999
- 67$40,000 to $49,999
- 51$50,000 to $59,999
- 56$60,000 to $74,999
- 175$75,000 to $99,999
- 232$100,000 to $124,999
- 108$125,000 to $149,999
- 37$150,000 to $199,999
- 107$200,000 or more

Distribution of owner-occupied house/condo value
![Distribution of owner-occupied house/condo value]()
- 33Less than $50,000
- 9$50,000 to $99,999
- 12$100,000 to $149,999
- 41$500,000 to $749,999
- 34$750,000 to $999,999
- 191$1,000,000 or more

Distribution of rent paid by renters
![Distribution of rent paid by renters]()
- 14$100 to $199
- 22$600 to $699
- 38$700 to $799
- 122$800 to $899
- 41$900 to $999
- 51$1,000 to $1,249
- 39$1,250 to $1,499
- 184$1,500 to $1,999
- 572$2,000 or more

Median rent in 2022:
| Peninsula Gateway (Peninsula): | $2,223 |
| Daly City: | $2,001 |
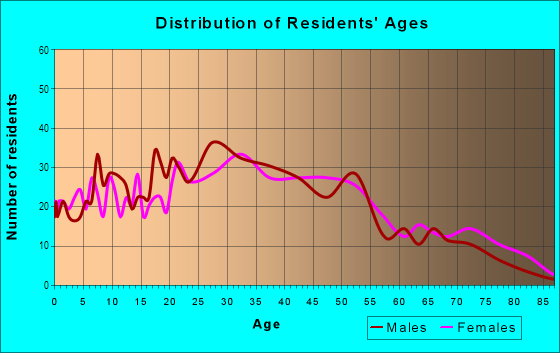
| Males: | 1,506 |
| Females: | 1,452 |
Males:
| This neighborhood: | 30.8 years |
| Whole city: | 40.9 years |
| This neighborhood: | 38.7 years |
| Whole city: | 44.8 years |
Average household size:
| Peninsula Gateway (Peninsula): | 3.0 people |
| Daly City: | 3.1 people |
Percentage of family households:
| Peninsula Gateway (Peninsula): | 56.7% |
| Daly City: | 40.3% |
| Here: | 35.6% |
| Daly City: | 50.3% |
Percentage of married-couple families with children (among all households):
| Peninsula Gateway (Peninsula): | 22.6% |
| Daly City: | 23.9% |
Percentage of single-mother households (among all households):
| Peninsula Gateway (Peninsula): | 9.5% |
| Daly City: | 5.7% |
Percentage of never married males 15 years old and over:
Percentage of never married females 15 years old and over:
| Peninsula Gateway (Peninsula): | 33.6% |
| Daly City: | 22.6% |
Percentage of never married females 15 years old and over:
| Peninsula Gateway (Peninsula): | 18.2% |
| city: | 17.9% |
Percentage of people that speak English not well or not at all:
| Peninsula Gateway (Peninsula): | 10.2% |
| Daly City: | 11.2% |
Percentage of people born in this state:
Percentage of people born in another U.S. state:
Percentage of native residents but born outside the U.S.:
Percentage of foreign born residents:
| Here: | 42.6% |
| Daly City: | 41.1% |
Percentage of people born in another U.S. state:
| Peninsula Gateway (Peninsula): | 4.0% |
| Daly City: | 5.1% |
Percentage of native residents but born outside the U.S.:
| Here: | 1.2% |
| city: | 1.8% |
Percentage of foreign born residents:
| Here: | 52.1% |
| Daly City: | 52.0% |

Owner-occupied
Renter-occupied


- Rooms in owner-occupied houses and condos in Peninsula Gateway <
> - 01 room
- 02 rooms
- 63 rooms
- 444 rooms
- 1025 rooms
- 876 rooms
- 437 rooms
- 568 rooms
- 239+ rooms

- Rooms in renter-occupied apartments in Peninsula Gateway <
> - 1171 room
- 1052 rooms
- 3063 rooms
- 1164 rooms
- 645 rooms
- 1136 rooms
- 227 rooms
- 548 rooms
- 09+ rooms
Owner-occupied
Renter-occupied

- Bedrooms in owner-occupied houses and condos in Peninsula Gateway <
> - 0no bedroom
- 321 bedroom
- 812 bedrooms
- 1273 bedrooms
- 154 bedrooms
- 405+ bedrooms

- Bedrooms in renter-occupied apartments in Peninsula Gateway <
> - 117no bedroom
- 3621 bedroom
- 2212 bedrooms
- 1853 bedrooms
- 304 bedrooms
- 75+ bedrooms
Average number of cars or other vehicles available in houses/condos:
Average number of cars or other vehicles available in apartments:
| This neighborhood: | 1.8 |
| Daly City: | 2.1 |
Average number of cars or other vehicles available in apartments:
| Here: | 1.7 |
| city: | 1.6 |
Percentage of units with a mortgage:
| Peninsula Gateway (Peninsula): | 42.7% |
| Daly City: | 61.0% |
Average estimated value of detached houses in 2022 (23.5% of all units):
| Peninsula Gateway (Peninsula): | $1,144,440 |
| California: | $988,808 |

- Year house built in Peninsula Gateway <
> - 02020 or later
- 192010 to 2019
- 452000 to 2009
- 941990 to 1999
- 1381980 to 1989
- 1991970 to 1979
- 1391960 to 1969
- 2751950 to 1959
- 1151940 to 1949
- 1921939 or earlier

City-data.com crime index for city in 2020 (higher means more crime):
| City: | 129.4 |
| U.S. average: | 219.5 |
Travel time to work (commute)
![Travel time to work (commute)]()
- 25Less than 5 minutes
- 695 to 9 minutes
- 21210 to 14 minutes
- 40415 to 19 minutes
- 33120 to 24 minutes
- 5325 to 29 minutes
- 40830 to 34 minutes
- 3635 to 39 minutes
- 6240 to 44 minutes
- 25845 to 59 minutes
- 18160 to 89 minutes
- 2690 or more minutes

Means of transportation to work
![Means of transportation to work]()
- 62.6%930Drove a car alone
- 5.7%84Carpooled
- 12.0%179Bus
- 30.9%459Subway or elevated rail
- 0.7%10Long-distance train or commuter rail
- 2.4%35Light rail, streetcar or trolley
- 1.2%18Taxi
- 1.7%25Motorcycle
- 9.5%141Bicycle
- 1.5%22Walked
- 10.4%154Other means
- 12.7%189Worked at home

Time leaving home to go to work
![Time leaving home to go to work]()
- 11112:00 a.m. to 4:59 a.m.
- 595:00 a.m. to 5:29 a.m.
- 575:30 a.m. to 5:59 a.m.
- 1476:00 a.m. to 6:29 a.m.
- 1616:30 a.m. to 6:59 a.m.
- 1597:00 a.m. to 7:29 a.m.
- 1657:30 a.m. to 7:59 a.m.
- 1208:00 a.m. to 8:29 a.m.
- 1168:30 a.m. to 8:59 a.m.
- 3049:00 a.m. to 9:59 a.m.
- 5710:00 a.m. to 10:59 a.m.
- 4711:00 a.m. to 11:59 a.m.
- 20712:00 p.m. to 3:59 p.m.
- 2154:00 p.m. to 11:59 p.m.

Occupations of males:
- Percentage of males in management occupations (except farmers):
Here: 5.7% city: 7.8%
- Percentage of males in business and financial operations occupations:
Here: 3.9% city: 4.6%
- Percentage of males in computer and mathematical occupations:
Here: 2.2% city: 5.8%
- Percentage of males in education, training, and library occupations:
Here: 4.7% city: 2.2%
- Percentage of males in arts, design, entertainment, sports, and media occupations:
Here: 3.5% city: 3.3%
- Percentage of males in healthcare practitioners and technical occupations:
Here: 1.8% city: 4.3%
- Percentage of males in service occupations:
Here: 29.0% city: 17.3%
- Percentage of males in sales and office occupations:
Here: 12.3% city: 17.7%
- Percentage of males in construction, extraction, and maintenance occupations:
Here: 14.6% city: 8.6%
- Percentage of males in production occupations:
Here: 4.6% city: 4.3%
- Percentage of males in transportation occupations:
Here: 10.0% city: 9.3%
Occupations of females:
- Percentage of females in management occupations (except farmers):
Here: 6.0% city: 8.1%
- Percentage of females in business and financial operations occupations:
Here: 8.9% city: 8.4%
- Percentage of females in computer and mathematical occupations:
Here: 3.8% city: 2.0%
- Percentage of females in architecture and engineering occupations:
Here: 1.6% city: 1.4%
- Percentage of females in community and social services occupations:
Here: 1.3% city: 1.9%
- Percentage of females in education, training, and library occupations:
Here: 3.8% city: 5.1%
- Percentage of females in arts, design, entertainment, sports, and media occupations:
Here: 4.1% city: 2.0%
- Percentage of females in healthcare practitioners and technical occupations:
Here: 3.0% city: 10.8%
- Percentage of females in service occupations:
Here: 42.7% city: 25.2%
- Percentage of females in sales and office occupations:
Here: 22.8% city: 27.7%
- Percentage of females in production occupations:
Here: 1.0% city: 1.9%
- Percentage of females in transportation occupations:
Here: 2.2% city: 0.8%
Education in this neighborhood (subdivision or community):
- Percentage of people 3 years and older in K-12 schools:
Peninsula Gateway (Peninsula): 19.3% Daly City: 11.4%
- Percentage of people 3 years and older in undergraduate colleges:
Peninsula Gateway (Peninsula): 6.2% Daly City: 6.1%
- Percentage of people 3 years and older in grad. or professional schools:
Peninsula Gateway (Peninsula): 15.4% Daly City: 2.0%
- Percentage of students K-12 enrolled in private schools:
Peninsula Gateway (Peninsula): 89.6% Daly City: 20.0%
Percentage of population below poverty level:
| Peninsula Gateway (Peninsula): | 10.2% |
| Daly City: | 11.3% |
Median year owner moved in (as recorded in 2022):
Median year renter moved in (as recorded in 2022):
| Peninsula Gateway (Peninsula): | 2003 |
| Daly City: | 2003 |
Median year renter moved in (as recorded in 2022):
| Peninsula Gateway (Peninsula): | 2016 |
| Daly City: | 2019 |
Percentage of married-couple families with both working:
| Peninsula Gateway (Peninsula): | 149.8% |
| Daly City: | 65.5% |

- 60.4%Utility gas
- 32.2%Electricity
- 3.7%Bottled, tank, or LP gas
- 2.5%No fuel used
- 1.3%Fuel oil, kerosene, etc.
Limited-access highways (interstate or state) in this neighborhood:
I- 280
Length: 0.69 miles
Directions: E-W, SW-NE
Directions: E-W, SW-NE
Roads and streets:
de Long St
Length: 0.30 miles
Directions: E-W, N-S, SE-NW, SW-NE
Address range: 300 to 543
Directions: E-W, N-S, SE-NW, SW-NE
Address range: 300 to 543
Niantic Ave
Length: 0.21 miles
Direction: SW-NE
Address range: 1 to 199
Direction: SW-NE
Address range: 1 to 199
Palmetto Ave
Length: 0.13 miles
Direction: E-W
Address range: 1030 to 1099
Direction: E-W
Address range: 1030 to 1099
Santa Cruz Ave
Length: 0.12 miles
Directions: N-S, SW-NE
Address range: 1 to 99
Directions: N-S, SW-NE
Address range: 1 to 99
San Luis Ave
Length: 0.11 miles
Direction: E-W
Address range: 1 to 79
Direction: E-W
Address range: 1 to 79
San Diego Ave
Length: 0.10 miles
Direction: N-S
Address range: 1 to 99
Direction: N-S
Address range: 1 to 99
Panama St
Length: 0.06 miles
Direction: E-W
Address range: 47 to 99
Direction: E-W
Address range: 47 to 99
Santa Barbara Ave
Length: 0.00 miles
Direction: N-S
Direction: N-S
Limited-access highways (interstate or state) in this neighborhood:
Junipero Serra Fwy (I- 280, State Hwy 1)
Length: 1.44 miles
Directions: N-S, SW-NE
Directions: N-S, SW-NE
Roads and streets:
Junipero Serra Blvd
Length: 0.80 miles
Directions: E-W, N-S, SE-NW, SW-NE
Address range: 1800 to 2299
Directions: E-W, N-S, SE-NW, SW-NE
Address range: 1800 to 2299
John Daly Blvd
Length: 0.54 miles
Direction: E-W
Address range: 400 to 499
Direction: E-W
Address range: 400 to 499
Niantic Ave
Length: 0.51 miles
Directions: N-S, SE-NW, SW-NE
Address range: 400 to 899
Directions: N-S, SE-NW, SW-NE
Address range: 400 to 899
Willits St
Length: 0.51 miles
Directions: N-S, SE-NW
Address range: 1 to 499
Directions: N-S, SE-NW
Address range: 1 to 499
Knowles Ave
Length: 0.29 miles
Direction: E-W
Address range: 100 to 599
Direction: E-W
Address range: 100 to 599
Hillcrest Dr
Length: 0.28 miles
Direction: E-W
Address range: 100 to 299
Direction: E-W
Address range: 100 to 299
Los Olivos Ave
Length: 0.27 miles
Direction: E-W
Address range: 100 to 299
Direction: E-W
Address range: 100 to 299
Los Banos Ave
Length: 0.27 miles
Direction: E-W
Address range: 100 to 234
Direction: E-W
Address range: 100 to 234
Woodrow St
Length: 0.26 miles
Directions: N-S, SE-NW
Address range: 1 to 199
Directions: N-S, SE-NW
Address range: 1 to 199
N Parkview Ave
Length: 0.23 miles
Directions: E-W, SW-NE
Address range: 300 to 599
Directions: E-W, SW-NE
Address range: 300 to 599
San Diego Ave
Length: 0.22 miles
Direction: N-S
Address range: 100 to 297
Direction: N-S
Address range: 100 to 297
de Long St
Length: 0.21 miles
Directions: N-S, SW-NE
Address range: 500 to 699
Directions: N-S, SW-NE
Address range: 500 to 699
Westlake Ave
Length: 0.19 miles
Direction: E-W
Address range: 400 to 599
Direction: E-W
Address range: 400 to 599
Vista Grande Ave
Length: 0.13 miles
Direction: E-W
Address range: 400 to 599
Direction: E-W
Address range: 400 to 599
Santa Cruz Ave
Length: 0.13 miles
Directions: N-S, SE-NW
Address range: 1 to 199
Directions: N-S, SE-NW
Address range: 1 to 199
Citrus Ave
Length: 0.11 miles
Direction: E-W
Address range: 400 to 599
Direction: E-W
Address range: 400 to 599
Santa Barbara Ave
Length: 0.10 miles
Directions: N-S, SW-NE
Address range: 200 to 299
Directions: N-S, SW-NE
Address range: 200 to 299
Guadalupe Ave
Length: 0.07 miles
Direction: E-W
Address range: 1 to 99
Direction: E-W
Address range: 1 to 99
S Parkview Ave
Length: 0.07 miles
Direction: E-W
Address range: 200 to 299
Direction: E-W
Address range: 200 to 299
Miriam St
Length: 0.03 miles
Direction: N-S
Address range: 1 to 3
Direction: N-S
Address range: 1 to 3
Railroad features:
Bart
Length: 1.71 miles
Directions: E-W, N-S, SE-NW, SW-NE
Directions: E-W, N-S, SE-NW, SW-NE
Union Pacific RR
Length: 0.01 miles
Direction: N-S
Direction: N-S