Parkside neighborhood in San Francisco, California (CA), 94116 detailed profile
Settings
X

Business Search - 14 Million verified businesses
Area: 1.066 square miles
Population: 22,300
Population density:
| Parkside: | 20,913 people per square mile |
| San Francisco: | 17,313 people per square mile |

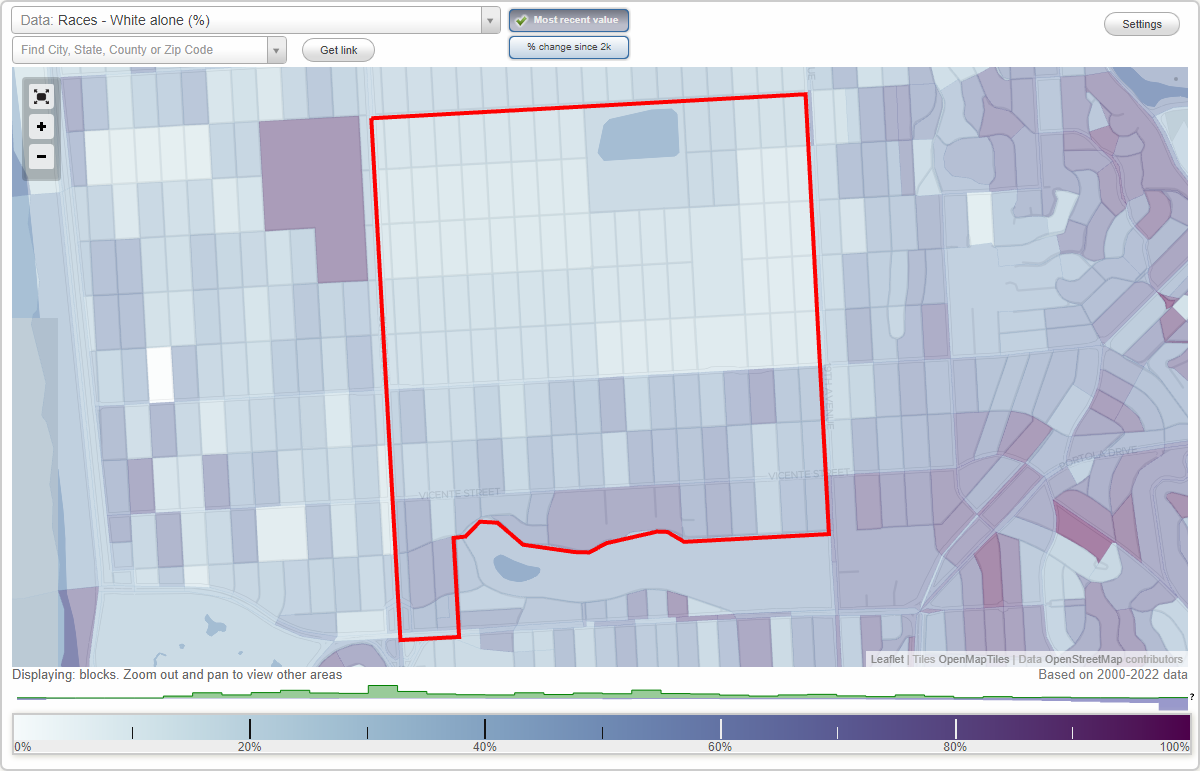
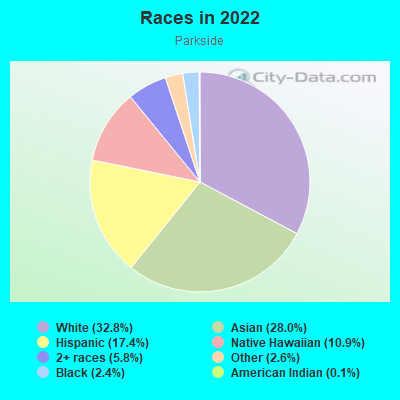
- 11,38149.2%Asian
- 7,00630.3%White
- 3,03313.1%Two or more races
- 1,0234.4%Hispanic or Latino
- 4572.0%Some other race
- 1470.6%Black
- 730.3%Native Hawaiian and Other
Pacific Islander
Median household income in 2022:
| Parkside: | $160,540 |
| San Francisco: | $136,692 |
Distribution of median household income
![Distribution of median household income]()
- 406Less than $10,000
- 219$10,000 to $19,999
- 333$20,000 to $29,999
- 350$30,000 to $39,999
- 461$40,000 to $49,999
- 197$50,000 to $59,999
- 197$60,000 to $74,999
- 863$75,000 to $99,999
- 258$100,000 to $124,999
- 957$125,000 to $149,999
- 1,097$150,000 to $199,999
- 3,028$200,000 or more

Distribution of owner-occupied house/condo value
![Distribution of owner-occupied house/condo value]()
- 166Less than $50,000
- 120$100,000 to $149,999
- 33$150,000 to $199,999
- 27$500,000 to $749,999
- 86$750,000 to $999,999
- 7,067$1,000,000 or more

Distribution of rent paid by renters
![Distribution of rent paid by renters]()
- 609$900 to $999
- 41$1,000 to $1,249
- 34$1,250 to $1,499
- 234$1,500 to $1,999
- 1,351$2,000 or more

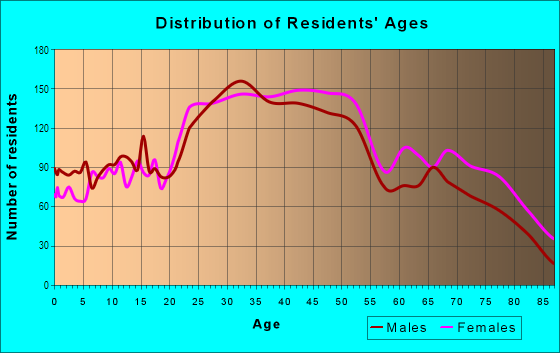
| Males: | 11,975 |
| Females: | 10,324 |
Males:
| This neighborhood: | 38.3 years |
| Whole city: | 40.3 years |
| This neighborhood: | 47.5 years |
| Whole city: | 40.5 years |
Average household size:
| Parkside: | 2.8 people |
| San Francisco: | 2.2 people |
Percentage of family households:
| Parkside: | 52.9% |
| San Francisco: | 30.3% |
| Here: | 65.1% |
| San Francisco: | 35.3% |
Percentage of married-couple families with children (among all households):
| Parkside: | 39.9% |
| San Francisco: | 35.9% |
Percentage of single-mother households (among all households):
| Parkside: | 3.3% |
| San Francisco: | 6.0% |
Percentage of never married males 15 years old and over:
Percentage of never married females 15 years old and over:
| Parkside: | 16.2% |
| San Francisco: | 24.6% |
Percentage of never married females 15 years old and over:
| Parkside: | 10.9% |
| city: | 19.9% |
Percentage of people that speak English not well or not at all:
| Parkside: | 4.6% |
| San Francisco: | 10.9% |
Percentage of people born in this state:
Percentage of people born in another U.S. state:
Percentage of native residents but born outside the U.S.:
Percentage of foreign born residents:
| Here: | 48.3% |
| San Francisco: | 40.8% |
Percentage of people born in another U.S. state:
| Parkside: | 10.1% |
| San Francisco: | 23.4% |
Percentage of native residents but born outside the U.S.:
| Here: | 2.4% |
| city: | 2.6% |
Percentage of foreign born residents:
| Here: | 39.2% |
| San Francisco: | 33.2% |
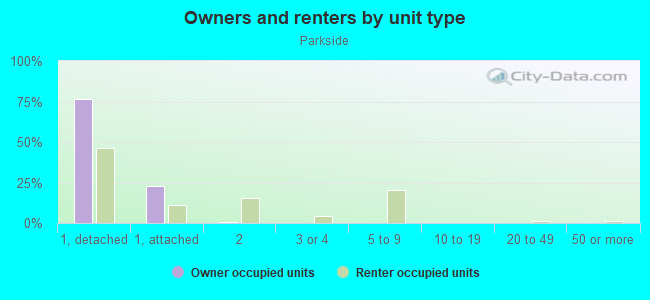
Owner-occupied
Renter-occupied

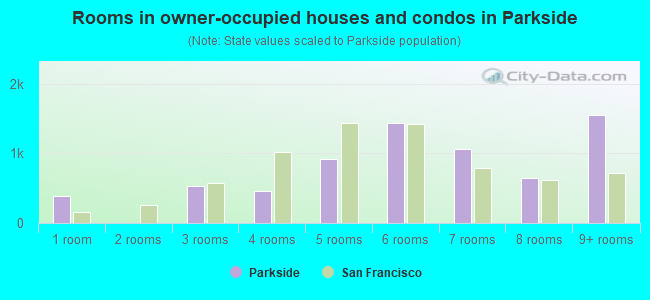
- Rooms in owner-occupied houses and condos in Parkside
- 3911 room
- 02 rooms
- 5303 rooms
- 4534 rooms
- 9225 rooms
- 1,4396 rooms
- 1,0697 rooms
- 6508 rooms
- 1,5539+ rooms
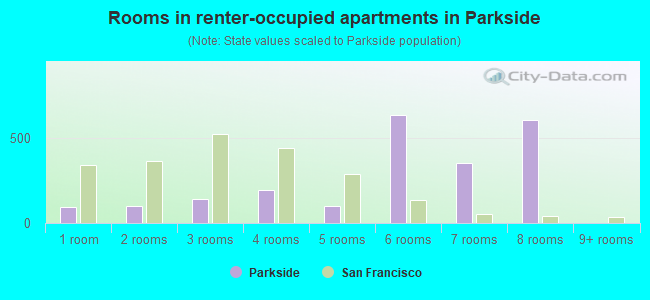
- Rooms in renter-occupied apartments in Parkside
- 951 room
- 982 rooms
- 1423 rooms
- 1974 rooms
- 985 rooms
- 6386 rooms
- 3567 rooms
- 6088 rooms
- 09+ rooms
Owner-occupied
Renter-occupied
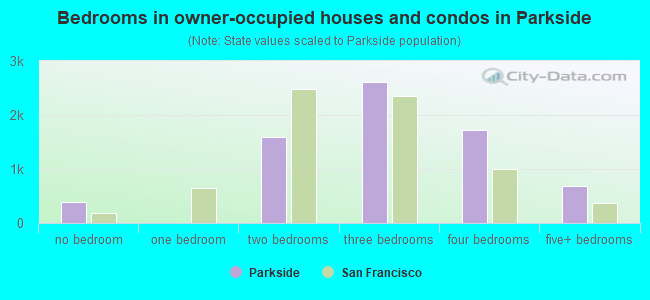
- Bedrooms in owner-occupied houses and condos in Parkside
- 391no bedroom
- 01 bedroom
- 1,5882 bedrooms
- 2,6203 bedrooms
- 1,7314 bedrooms
- 6875+ bedrooms
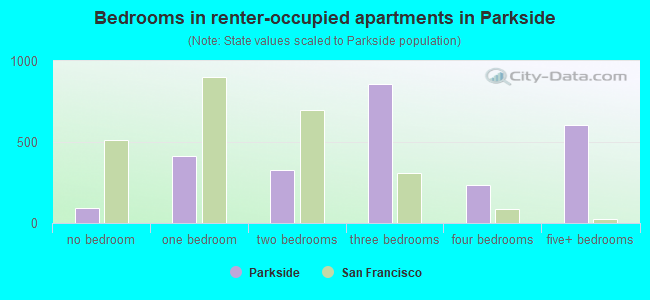
- Bedrooms in renter-occupied apartments in Parkside
- 95no bedroom
- 4121 bedroom
- 3282 bedrooms
- 8593 bedrooms
- 2334 bedrooms
- 6085+ bedrooms
Average number of cars or other vehicles available in houses/condos:
Average number of cars or other vehicles available in apartments:
| This neighborhood: | 1.8 |
| San Francisco: | 1.5 |
Average number of cars or other vehicles available in apartments:
| Here: | 1.7 |
| city: | 0.8 |
Percentage of units with a mortgage:
| Parkside: | 55.9% |
| San Francisco: | 62.3% |
Housing prices:
- Average estimated value of detached houses in 2022 (80.2% of all units):
Parkside: $2,196,658 San Francisco: $1,942,973
- Average estimated value of townhouses or other attached units in 2022 (19.8% of all units):
This neighborhood: $1,333,360 city: $1,528,422
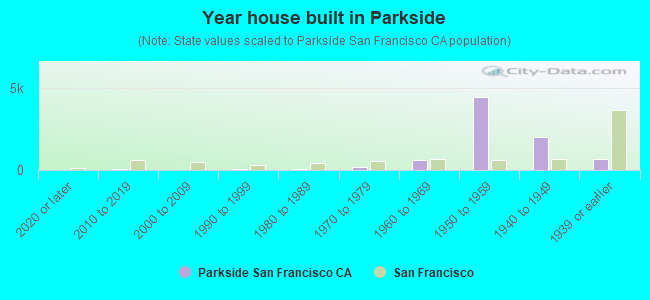
- Year house built in Parkside
- 02020 or later
- 672010 to 2019
- 02000 to 2009
- 401990 to 1999
- 721980 to 1989
- 1551970 to 1979
- 6141960 to 1969
- 4,4461950 to 1959
- 2,0091940 to 1949
- 6771939 or earlier
City-data.com crime index for city in 2020 (higher means more crime):
| City: | 387.4 |
| U.S. average: | 219.5 |
Travel time to work (commute)
![Travel time to work (commute)]()
- 251Less than 5 minutes
- 1695 to 9 minutes
- 22010 to 14 minutes
- 41515 to 19 minutes
- 60320 to 24 minutes
- 40225 to 29 minutes
- 1,00630 to 34 minutes
- 17535 to 39 minutes
- 33740 to 44 minutes
- 1,36745 to 59 minutes
- 64360 to 89 minutes
- 21290 or more minutes

Means of transportation to work
![Means of transportation to work]()
- 50.4%5,267Drove a car alone
- 3.3%343Carpooled
- 6.8%715Bus
- 5.4%565Subway or elevated rail
- 7.5%782Light rail, streetcar or trolley
- 0.5%49Bicycle
- 6.2%650Walked
- 3.3%343Other means
- 20.9%2,184Worked at home

Time leaving home to go to work
![Time leaving home to go to work]()
- 3712:00 a.m. to 4:59 a.m.
- 1005:00 a.m. to 5:29 a.m.
- 445:30 a.m. to 5:59 a.m.
- 1856:00 a.m. to 6:29 a.m.
- 6666:30 a.m. to 6:59 a.m.
- 1,0997:00 a.m. to 7:29 a.m.
- 4867:30 a.m. to 7:59 a.m.
- 7158:00 a.m. to 8:29 a.m.
- 5548:30 a.m. to 8:59 a.m.
- 5409:00 a.m. to 9:59 a.m.
- 23810:00 a.m. to 10:59 a.m.
- 11711:00 a.m. to 11:59 a.m.
- 32912:00 p.m. to 3:59 p.m.
- 1504:00 p.m. to 11:59 p.m.

Occupations of males:
- Percentage of males in management occupations (except farmers):
Here: 4.8% city: 17.2%
- Percentage of males in business and financial operations occupations:
Here: 17.2% city: 8.9%
- Percentage of males in computer and mathematical occupations:
Here: 8.7% city: 14.6%
- Percentage of males in architecture and engineering occupations:
Here: 13.1% city: 4.0%
- Percentage of males in community and social services occupations:
Here: 3.0% city: 1.0%
- Percentage of males in education, training, and library occupations:
Here: 4.5% city: 3.4%
- Percentage of males in arts, design, entertainment, sports, and media occupations:
Here: 5.6% city: 4.9%
- Percentage of males in healthcare practitioners and technical occupations:
Here: 6.6% city: 3.2%
- Percentage of males in service occupations:
Here: 3.6% city: 11.8%
- Percentage of males in sales and office occupations:
Here: 16.7% city: 13.5%
- Percentage of males in production occupations:
Here: 6.6% city: 2.5%
- Percentage of males in transportation occupations:
Here: 3.3% city: 3.4%
- Percentage of males in material moving occupations:
Here: 4.3% city: 1.8%
Occupations of females:
- Percentage of females in management occupations (except farmers):
Here: 11.0% city: 15.8%
- Percentage of females in business and financial operations occupations:
Here: 27.8% city: 11.5%
- Percentage of females in computer and mathematical occupations:
Here: 1.9% city: 5.1%
- Percentage of females in architecture and engineering occupations:
Here: 2.3% city: 1.6%
- Percentage of females in life, physical, and social science occupations:
Here: 1.9% city: 2.9%
- Percentage of females in education, training, and library occupations:
Here: 6.6% city: 7.1%
- Percentage of females in arts, design, entertainment, sports, and media occupations:
Here: 3.6% city: 5.1%
- Percentage of females in healthcare practitioners and technical occupations:
Here: 12.4% city: 8.4%
- Percentage of females in service occupations:
Here: 12.0% city: 15.4%
- Percentage of females in sales and office occupations:
Here: 20.6% city: 19.3%
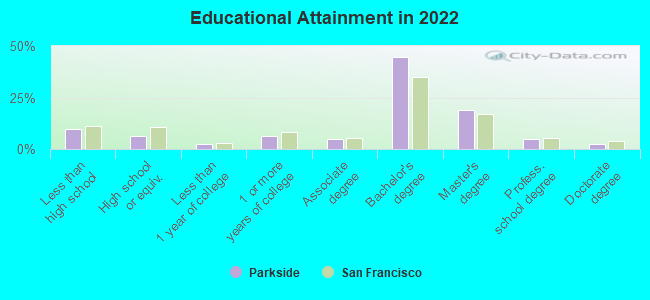
Education in this neighborhood (subdivision or community):
- Percentage of people 3 years and older in K-12 schools:
Parkside: 24.5% San Francisco: 9.7%
- Percentage of people 3 years and older in undergraduate colleges:
Parkside: 7.1% San Francisco: 4.8%
- Percentage of people 3 years and older in grad. or professional schools:
Parkside: 1.6% San Francisco: 2.6%
- Percentage of students K-12 enrolled in private schools:
Parkside: 30.7% San Francisco: 36.5%
Percentage of population below poverty level:
| Parkside: | 4.9% |
| San Francisco: | 10.4% |
Median year owner moved in (as recorded in 2022):
| Parkside: | 2007 |
| San Francisco: | 2007 |
Percentage of married-couple families with both working:
| Parkside: | 81.7% |
| San Francisco: | 75.9% |
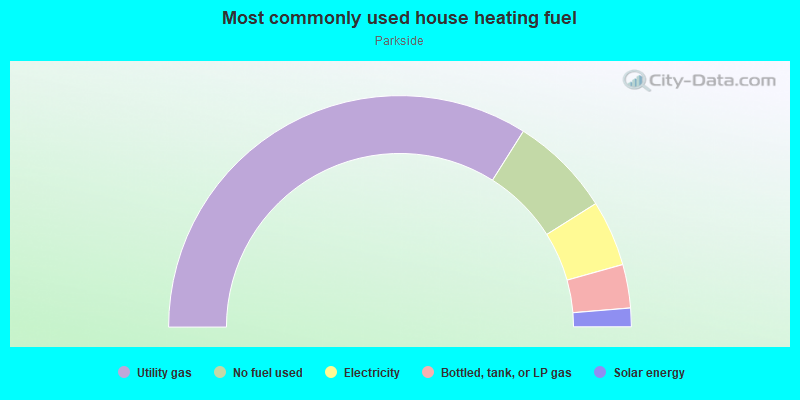
- 67.9%Utility gas
- 14.2%No fuel used
- 9.2%Electricity
- 6.1%Bottled, tank, or LP gas
- 2.6%Solar energy
Roads and streets:
Vicente St
Length: 1.19 miles
Direction: E-W
Address range: 900 to 2499
Direction: E-W
Address range: 900 to 2499
Ulloa St
Length: 1.18 miles
Direction: E-W
Address range: 1900 to 3499
Direction: E-W
Address range: 1900 to 3499
Quintara St
Length: 1.18 miles
Direction: E-W
Address range: 1100 to 2699
Direction: E-W
Address range: 1100 to 2699
Santiago St
Length: 1.18 miles
Direction: E-W
Address range: 900 to 2499
Direction: E-W
Address range: 900 to 2499
Taraval St
Length: 1.18 miles
Direction: E-W
Address range: 1000 to 2599
Direction: E-W
Address range: 1000 to 2599
36th Ave
Length: 1.08 miles
Direction: N-S
Address range: 2000 to 2899
Direction: N-S
Address range: 2000 to 2899
35th Ave
Length: 1.08 miles
Direction: N-S
Address range: 2000 to 2899
Direction: N-S
Address range: 2000 to 2899
Wawona St
Length: 1.05 miles
Directions: E-W, SE-NW, SW-NE
Address range: 900 to 2499
Directions: E-W, SE-NW, SW-NE
Address range: 900 to 2499
Rivera St
Length: 1.03 miles
Direction: E-W
Address range: 1000 to 2599
Direction: E-W
Address range: 1000 to 2599
30th Ave
Length: 0.91 miles
Directions: N-S, SW-NE
Address range: 2000 to 2599
Directions: N-S, SW-NE
Address range: 2000 to 2599
20th Ave
Length: 0.90 miles
Direction: N-S
Address range: 2000 to 2699
Direction: N-S
Address range: 2000 to 2699
22nd Ave
Length: 0.90 miles
Direction: N-S
Address range: 2000 to 2699
Direction: N-S
Address range: 2000 to 2699
21st Ave
Length: 0.90 miles
Direction: N-S
Address range: 2000 to 2699
Direction: N-S
Address range: 2000 to 2699
24th Ave
Length: 0.90 miles
Direction: N-S
Address range: 2000 to 2699
Direction: N-S
Address range: 2000 to 2699
28th Ave
Length: 0.90 miles
Direction: N-S
Address range: 2000 to 2699
Direction: N-S
Address range: 2000 to 2699
Pacheco St
Length: 0.89 miles
Direction: E-W
Address range: 1600 to 3199
Direction: E-W
Address range: 1600 to 3199
34th Ave
Length: 0.87 miles
Directions: N-S, SE-NW, SW-NE
Address range: 2000 to 2699
Directions: N-S, SE-NW, SW-NE
Address range: 2000 to 2699
31st Ave
Length: 0.85 miles
Directions: N-S, SE-NW
Address range: 2000 to 2699
Directions: N-S, SE-NW
Address range: 2000 to 2699
33rd Ave
Length: 0.82 miles
Direction: N-S
Address range: 2000 to 2699
Direction: N-S
Address range: 2000 to 2699
25th Ave
Length: 0.77 miles
Direction: N-S
Address range: 2100 to 2799
Direction: N-S
Address range: 2100 to 2799
32nd Ave
Length: 0.77 miles
Direction: N-S
Address range: 2000 to 2599
Direction: N-S
Address range: 2000 to 2599
29th Ave
Length: 0.77 miles
Direction: N-S
Address range: 2000 to 2599
Direction: N-S
Address range: 2000 to 2599
26th Ave
Length: 0.72 miles
Direction: N-S
Address range: 2100 to 2699
Direction: N-S
Address range: 2100 to 2699
27th Ave
Length: 0.64 miles
Direction: N-S
Address range: 2100 to 2599
Direction: N-S
Address range: 2100 to 2599
23rd Ave
Length: 0.52 miles
Direction: N-S
Address range: 2000 to 2699
Direction: N-S
Address range: 2000 to 2699
Sloat Blvd
Length: 0.28 miles
Directions: E-W, SE-NW, SW-NE
Address range: 1767 to 1849
Directions: E-W, SE-NW, SW-NE
Address range: 1767 to 1849
Escolta Way
Length: 0.17 miles
Directions: E-W, SE-NW
Address range: 1 to 199
Directions: E-W, SE-NW
Address range: 1 to 199
Yorba St
Length: 0.12 miles
Directions: E-W, SE-NW, SW-NE
Address range: 2346 to 2499
Directions: E-W, SE-NW, SW-NE
Address range: 2346 to 2499
Easement
Length: 0.09 miles
Directions: E-W, N-S
Address range: 100 to 199
Directions: E-W, N-S
Address range: 100 to 199
Rosemary Ct
Length: 0.04 miles
Direction: E-W
Address range: 1 to 99
Direction: E-W
Address range: 1 to 99