Ocean Park neighborhood in Santa Monica, California (CA), 90405 detailed profile
Settings
X


Business Search - 14 Million verified businesses
Area: 0.738 square miles
Population: 20,743
Population density:
| Ocean Park: | 28,126 people per square mile |
| Santa Monica: | 10,889 people per square mile |

- 12,92162.0%White
- 4,42021.2%Hispanic or Latino
- 1,4777.1%Asian
- 8314.0%Two or more races
- 7763.7%Black
- 2081.0%Some other race
- 1680.8%Native Hawaiian and Other
Pacific Islander - 430.2%American Indian

Median household income in 2022:
| Ocean Park: | $108,889 |
| Santa Monica: | $110,030 |
Distribution of median household income
![Distribution of median household income]()
- 693Less than $10,000
- 262$10,000 to $19,999
- 799$20,000 to $29,999
- 813$30,000 to $39,999
- 509$40,000 to $49,999
- 255$50,000 to $59,999
- 726$60,000 to $74,999
- 672$75,000 to $99,999
- 715$100,000 to $124,999
- 567$125,000 to $149,999
- 1,619$150,000 to $199,999
- 2,721$200,000 or more

Distribution of owner-occupied house/condo value
![Distribution of owner-occupied house/condo value]()
- 86Less than $50,000
- 65$200,000 to $249,999
- 45$300,000 to $399,999
- 196$400,000 to $499,999
- 390$500,000 to $749,999
- 164$750,000 to $999,999
- 3,322$1,000,000 or more

Distribution of rent paid by renters
![Distribution of rent paid by renters]()
- 357$200 to $299
- 87$300 to $399
- 87$500 to $599
- 266$600 to $699
- 188$700 to $799
- 131$800 to $899
- 232$900 to $999
- 467$1,000 to $1,249
- 814$1,250 to $1,499
- 1,012$1,500 to $1,999
- 3,340$2,000 or more

Median rent in 2022:
| Ocean Park: | $2,081 |
| Santa Monica: | $2,001 |
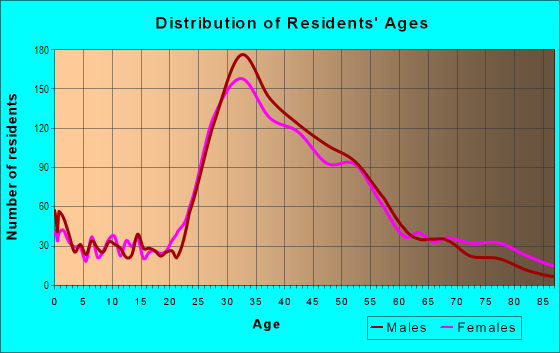
| Males: | 10,003 |
| Females: | 10,739 |
Males:
| This neighborhood: | 39.8 years |
| Whole city: | 41.4 years |
| This neighborhood: | 41.8 years |
| Whole city: | 44.4 years |
Average household size:
| Ocean Park: | 2.1 people |
| Santa Monica: | 23.0 people |
Percentage of family households:
| Ocean Park: | 27.3% |
| Santa Monica: | 32.2% |
| Here: | 34.4% |
| Santa Monica: | 33.9% |
Percentage of married-couple families with children (among all households):
| Ocean Park: | 41.6% |
| Santa Monica: | 35.9% |
Percentage of single-mother households (among all households):
| Ocean Park: | 7.9% |
| Santa Monica: | 8.7% |
Percentage of never married males 15 years old and over:
Percentage of never married females 15 years old and over:
| Ocean Park: | 23.3% |
| Santa Monica: | 20.0% |
Percentage of never married females 15 years old and over:
| Ocean Park: | 20.2% |
| city: | 22.0% |
Percentage of people that speak English not well or not at all:
| Ocean Park: | 1.9% |
| Santa Monica: | 3.7% |
Percentage of people born in this state:
Percentage of people born in another U.S. state:
Percentage of native residents but born outside the U.S.:
Percentage of foreign born residents:
| Here: | 45.1% |
| Santa Monica: | 41.4% |
Percentage of people born in another U.S. state:
| Ocean Park: | 29.4% |
| Santa Monica: | 33.1% |
Percentage of native residents but born outside the U.S.:
| Here: | 2.9% |
| city: | 1.8% |
Percentage of foreign born residents:
| Here: | 22.6% |
| Santa Monica: | 23.6% |

Owner-occupied
Renter-occupied


- Rooms in owner-occupied houses and condos in Ocean Park
- 531 room
- 112 rooms
- 1813 rooms
- 8824 rooms
- 9325 rooms
- 1,0046 rooms
- 4547 rooms
- 1958 rooms
- 3899+ rooms

- Rooms in renter-occupied apartments in Ocean Park
- 3311 room
- 4542 rooms
- 2,1233 rooms
- 1,8384 rooms
- 1,0745 rooms
- 2836 rooms
- 3927 rooms
- 448 rooms
- 439+ rooms
Owner-occupied
Renter-occupied

- Bedrooms in owner-occupied houses and condos in Ocean Park
- 53no bedroom
- 1601 bedroom
- 1,2232 bedrooms
- 2,0503 bedrooms
- 5724 bedrooms
- 1065+ bedrooms

- Bedrooms in renter-occupied apartments in Ocean Park
- 416no bedroom
- 2,2661 bedroom
- 2,8182 bedrooms
- 7393 bedrooms
- 554 bedrooms
- 435+ bedrooms
Average number of cars or other vehicles available in houses/condos:
Average number of cars or other vehicles available in apartments:
| This neighborhood: | 2.0 |
| Santa Monica: | 1.7 |
Average number of cars or other vehicles available in apartments:
| Here: | 1.3 |
| city: | 1.2 |
Percentage of units with a mortgage:
| Ocean Park: | 60.8% |
| Santa Monica: | 63.0% |

- Year house built in Ocean Park
- 532020 or later
- 3222010 to 2019
- 2202000 to 2009
- 7421990 to 1999
- 7091980 to 1989
- 9991970 to 1979
- 2,2301960 to 1969
- 2,5721950 to 1959
- 2,0071940 to 1949
- 1,9091939 or earlier

City-data.com crime index for city in 2020 (higher means more crime):
| City: | 383.7 |
| U.S. average: | 219.5 |
Travel time to work (commute)
![Travel time to work (commute)]()
- 301Less than 5 minutes
- 8335 to 9 minutes
- 1,09910 to 14 minutes
- 1,67015 to 19 minutes
- 74620 to 24 minutes
- 66525 to 29 minutes
- 94530 to 34 minutes
- 27635 to 39 minutes
- 38440 to 44 minutes
- 1,01645 to 59 minutes
- 41160 to 89 minutes
- 5890 or more minutes

Means of transportation to work
![Means of transportation to work]()
- 59.0%6,582Drove a car alone
- 3.6%402Carpooled
- 1.1%120Bus
- 0.4%41Subway or elevated rail
- 0.3%35Light rail, streetcar or trolley
- 1.9%217Taxi
- 2.4%273Bicycle
- 5.6%627Walked
- 1.2%133Other means
- 25.9%2,889Worked at home

Time leaving home to go to work
![Time leaving home to go to work]()
- 8212:00 a.m. to 4:59 a.m.
- 1295:00 a.m. to 5:29 a.m.
- 595:30 a.m. to 5:59 a.m.
- 2866:00 a.m. to 6:29 a.m.
- 3786:30 a.m. to 6:59 a.m.
- 6307:00 a.m. to 7:29 a.m.
- 6467:30 a.m. to 7:59 a.m.
- 2,0688:00 a.m. to 8:29 a.m.
- 1,1478:30 a.m. to 8:59 a.m.
- 7819:00 a.m. to 9:59 a.m.
- 75610:00 a.m. to 10:59 a.m.
- 20911:00 a.m. to 11:59 a.m.
- 55712:00 p.m. to 3:59 p.m.
- 6494:00 p.m. to 11:59 p.m.

Occupations of males:
- Percentage of males in management occupations (except farmers):
Here: 25.1% city: 22.6%
- Percentage of males in business and financial operations occupations:
Here: 3.9% city: 9.6%
- Percentage of males in computer and mathematical occupations:
Here: 12.6% city: 9.2%
- Percentage of males in architecture and engineering occupations:
Here: 2.5% city: 2.9%
- Percentage of males in community and social services occupations:
Here: 1.2% city: 1.0%
- Percentage of males in legal occupations:
Here: 5.4% city: 5.7%
- Percentage of males in education, training, and library occupations:
Here: 1.6% city: 4.2%
- Percentage of males in arts, design, entertainment, sports, and media occupations:
Here: 11.2% city: 10.6%
- Percentage of males in healthcare practitioners and technical occupations:
Here: 2.9% city: 4.6%
- Percentage of males in service occupations:
Here: 7.3% city: 7.6%
- Percentage of males in sales and office occupations:
Here: 11.0% city: 11.6%
- Percentage of males in construction, extraction, and maintenance occupations:
Here: 7.2% city: 2.7%
- Percentage of males in production occupations:
Here: 4.9% city: 2.1%
- Percentage of males in transportation occupations:
Here: 1.2% city: 1.8%
- Percentage of males in material moving occupations:
Here: 1.3% city: 0.8%
Occupations of females:
- Percentage of females in management occupations (except farmers):
Here: 22.2% city: 18.2%
- Percentage of females in business and financial operations occupations:
Here: 13.1% city: 11.6%
- Percentage of females in computer and mathematical occupations:
Here: 2.7% city: 2.2%
- Percentage of females in life, physical, and social science occupations:
Here: 3.2% city: 2.9%
- Percentage of females in community and social services occupations:
Here: 2.5% city: 1.9%
- Percentage of females in legal occupations:
Here: 4.9% city: 3.6%
- Percentage of females in education, training, and library occupations:
Here: 12.1% city: 7.7%
- Percentage of females in arts, design, entertainment, sports, and media occupations:
Here: 9.7% city: 11.5%
- Percentage of females in healthcare practitioners and technical occupations:
Here: 5.2% city: 8.7%
- Percentage of females in service occupations:
Here: 7.9% city: 11.0%
- Percentage of females in sales and office occupations:
Here: 13.8% city: 16.7%
- Percentage of females in transportation occupations:
Here: 1.6% city: 0.6%
Percentage of people 16-64 in Armed Forces:
| Ocean Park: | 0.0% |
| Santa Monica: | 0.1% |
Education in this neighborhood (subdivision or community):
- Percentage of people 3 years and older in K-12 schools:
Ocean Park: 14.1% Santa Monica: 10.3%
- Percentage of people 3 years and older in undergraduate colleges:
Ocean Park: 5.5% Santa Monica: 4.7%
- Percentage of people 3 years and older in grad. or professional schools:
Ocean Park: 2.0% Santa Monica: 2.6%
- Percentage of students K-12 enrolled in private schools:
Ocean Park: 53.0% Santa Monica: 22.4%
Percentage of population below poverty level:
| Ocean Park: | 9.4% |
| Santa Monica: | 11.5% |
Median year owner moved in (as recorded in 2022):
Median year renter moved in (as recorded in 2022):
| Ocean Park: | 2007 |
| Santa Monica: | 2006 |
Median year renter moved in (as recorded in 2022):
| Ocean Park: | 2013 |
| Santa Monica: | 2016 |
Percentage of married-couple families with both working:
| Ocean Park: | 84.3% |
| Santa Monica: | 69.1% |

- 72.2%Utility gas
- 23.3%Electricity
- 2.8%No fuel used
- 1.3%Bottled, tank, or LP gas
Highways in this neighborhood:
Lincoln Blvd (State Rte 1)
Length: 1.04 miles
Direction: SE-NW
Address range: 2000 to 3399
Direction: SE-NW
Address range: 2000 to 3399
Roads and streets:
Main St
Length: 0.93 miles
Direction: SE-NW
Address range: 2000 to 3414
Direction: SE-NW
Address range: 2000 to 3414
Neilson Way
Length: 0.92 miles
Direction: SE-NW
Address range: 2000 to 3199
Direction: SE-NW
Address range: 2000 to 3199
7th St
Length: 0.92 miles
Directions: E-W, SE-NW
Address range: 1900 to 3299
Directions: E-W, SE-NW
Address range: 1900 to 3299
3rd St
Length: 0.90 miles
Direction: SE-NW
Address range: 2000 to 3099
Direction: SE-NW
Address range: 2000 to 3099
6th St
Length: 0.87 miles
Directions: SE-NW, SW-NE
Address range: 1917 to 2999
Directions: SE-NW, SW-NE
Address range: 1917 to 2999
Ocean Park Blvd
Length: 0.84 miles
Directions: E-W, SW-NE
Address range: 1 to 799
Directions: E-W, SW-NE
Address range: 1 to 799
Ashland Ave
Length: 0.79 miles
Directions: E-W, SW-NE
Address range: 1 to 799
Directions: E-W, SW-NE
Address range: 1 to 799
Ocean Front (The Promenade)
Length: 0.76 miles
Directions: SE-NW, SW-NE
Address range: 2001 to 2899
Directions: SE-NW, SW-NE
Address range: 2001 to 2899
Bay St
Length: 0.75 miles
Direction: SW-NE
Address range: 100 to 847
Direction: SW-NE
Address range: 100 to 847
Barnard Way
Length: 0.74 miles
Directions: E-W, N-S, SE-NW, SW-NE
Address range: 101 to 3399
Directions: E-W, N-S, SE-NW, SW-NE
Address range: 101 to 3399
Pacific St
Length: 0.73 miles
Direction: SW-NE
Address range: 100 to 855
Direction: SW-NE
Address range: 100 to 855
Marine St
Length: 0.71 miles
Direction: SW-NE
Address range: 100 to 899
Direction: SW-NE
Address range: 100 to 899
Strand St
Length: 0.71 miles
Directions: N-S, SW-NE
Address range: 101 to 799
Directions: N-S, SW-NE
Address range: 101 to 799
2nd St
Length: 0.67 miles
Direction: SE-NW
Address range: 2300 to 3099
Direction: SE-NW
Address range: 2300 to 3099
Hill St
Length: 0.61 miles
Direction: SW-NE
Address range: 1 to 799
Direction: SW-NE
Address range: 1 to 799
5th St
Length: 0.61 miles
Directions: E-W, SE-NW
Address range: 2000 to 2699
Directions: E-W, SE-NW
Address range: 2000 to 2699
Pier Ave
Length: 0.59 miles
Direction: SW-NE
Address range: 100 to 865
Direction: SW-NE
Address range: 100 to 865
Hollister Ave
Length: 0.51 miles
Directions: E-W, SW-NE
Address range: 100 to 699
Directions: E-W, SW-NE
Address range: 100 to 699
Highland Ave
Length: 0.47 miles
Direction: SE-NW
Address range: 2600 to 3273
Direction: SE-NW
Address range: 2600 to 3273
4th St (4th Ave)
Length: 0.45 miles
Direction: SE-NW
Address range: 2223 to 2699
Direction: SE-NW
Address range: 2223 to 2699
4th St
Length: 0.44 miles
Direction: SE-NW
Address range: 2000 to 3099
Direction: SE-NW
Address range: 2000 to 3099
Raymond Ave
Length: 0.43 miles
Direction: SW-NE
Address range: 400 to 799
Direction: SW-NE
Address range: 400 to 799
Bicknell Ave
Length: 0.38 miles
Direction: SW-NE
Address range: 102 to 399
Direction: SW-NE
Address range: 102 to 399
Ocean Ave (Ocean Way)
Length: 0.28 miles
Directions: E-W, SE-NW
Address range: 2000 to 2399
Directions: E-W, SE-NW
Address range: 2000 to 2399
Ozone Ave
Length: 0.28 miles
Direction: SW-NE
Address range: 600 to 899
Direction: SW-NE
Address range: 600 to 899
Navy St
Length: 0.27 miles
Direction: SW-NE
Address range: 600 to 899
Direction: SW-NE
Address range: 600 to 899
Grant St
Length: 0.25 miles
Directions: E-W, SW-NE
Address range: 600 to 851
Directions: E-W, SW-NE
Address range: 600 to 851
Beverly Ave
Length: 0.24 miles
Direction: SE-NW
Address range: 2400 to 2599
Direction: SE-NW
Address range: 2400 to 2599
Kensington Rd
Length: 0.18 miles
Direction: SW-NE
Address range: 600 to 799
Direction: SW-NE
Address range: 600 to 799
Ocean Front Walk (The Promenade)
Length: 0.16 miles
Direction: SE-NW
Direction: SE-NW
Pine St
Length: 0.16 miles
Direction: SW-NE
Address range: 700 to 875
Direction: SW-NE
Address range: 700 to 875
Copeland Ct
Length: 0.15 miles
Direction: SW-NE
Address range: 600 to 799
Direction: SW-NE
Address range: 600 to 799
Cedar St
Length: 0.15 miles
Direction: SW-NE
Address range: 700 to 867
Direction: SW-NE
Address range: 700 to 867
Fraser Ave
Length: 0.11 miles
Direction: SW-NE
Address range: 100 to 199
Direction: SW-NE
Address range: 100 to 199
Hart Ave
Length: 0.11 miles
Direction: SW-NE
Address range: 100 to 199
Direction: SW-NE
Address range: 100 to 199
Wadsworth Ave
Length: 0.11 miles
Direction: SW-NE
Address range: 100 to 199
Direction: SW-NE
Address range: 100 to 199
Longfellow St
Length: 0.09 miles
Direction: SE-NW
Address range: 3100 to 3299
Direction: SE-NW
Address range: 3100 to 3299
Sea Colony Dr
Length: 0.09 miles
Directions: N-S, SE-NW
Address range: 25 to 99
Directions: N-S, SE-NW
Address range: 25 to 99
Pico Pl
Length: 0.08 miles
Direction: SW-NE
Address range: 600 to 699
Direction: SW-NE
Address range: 600 to 699
N Ocean Ave
Length: 0.08 miles
Directions: N-S, SE-NW
Directions: N-S, SE-NW
Beach St
Length: 0.07 miles
Direction: SW-NE
Address range: 200 to 299
Direction: SW-NE
Address range: 200 to 299
Mills St
Length: 0.07 miles
Direction: SW-NE
Address range: 200 to 299
Direction: SW-NE
Address range: 200 to 299
Norman Pl
Length: 0.06 miles
Direction: SW-NE
Address range: 200 to 299
Direction: SW-NE
Address range: 200 to 299
Kinney St
Length: 0.05 miles
Direction: SW-NE
Address range: 100 to 199
Direction: SW-NE
Address range: 100 to 199
Bentley Ct
Length: 0.04 miles
Direction: SE-NW
Address range: 3000 to 3099
Direction: SE-NW
Address range: 3000 to 3099
Ruskin St
Length: 0.04 miles
Direction: SE-NW
Address range: 3000 to 3099
Direction: SE-NW
Address range: 3000 to 3099
Pearl St
Length: 0.04 miles
Direction: SW-NE
Address range: 800 to 871
Direction: SW-NE
Address range: 800 to 871
Goldsmith St
Length: 0.04 miles
Direction: SE-NW
Address range: 3000 to 3099
Direction: SE-NW
Address range: 3000 to 3099
Maple St
Length: 0.03 miles
Direction: SW-NE
Address range: 800 to 861
Direction: SW-NE
Address range: 800 to 861