Northwest Industrial neighborhood in El Monte, California (CA), 91731, 91780 detailed profile
Settings
X


Business Search - 14 Million verified businesses
Area: 0.988 square miles
Population: 10,727
Population density:
| Northwest Industrial: | 10,856 people per square mile |
| El Monte: | 11,024 people per square mile |

- 5,83651.2%Hispanic or Latino
- 4,25437.3%Asian
- 4223.7%White
- 3933.4%Two or more races
- 1571.4%Black
- 1491.3%American Indian
- 1391.2%Native Hawaiian and Other
Pacific Islander - 440.4%Some other race

Median household income in 2022:
| Northwest Industrial: | $78,479 |
| El Monte: | $59,368 |
Distribution of median household income
![Distribution of median household income]()
- 188Less than $10,000
- 551$10,000 to $19,999
- 512$20,000 to $29,999
- 246$30,000 to $39,999
- 418$40,000 to $49,999
- 318$50,000 to $59,999
- 257$60,000 to $74,999
- 326$75,000 to $99,999
- 273$100,000 to $124,999
- 263$125,000 to $149,999
- 246$150,000 to $199,999
- 221$200,000 or more

Distribution of owner-occupied house/condo value
![Distribution of owner-occupied house/condo value]()
- 794Less than $50,000
- 265$50,000 to $99,999
- 135$100,000 to $149,999
- 35$150,000 to $199,999
- 48$200,000 to $249,999
- 30$250,000 to $299,999
- 51$300,000 to $399,999
- 146$400,000 to $499,999
- 476$500,000 to $749,999
- 375$750,000 to $999,999
- 469$1,000,000 or more

Distribution of rent paid by renters
![Distribution of rent paid by renters]()
- 441$200 to $299
- 124$300 to $399
- 387$400 to $499
- 201$500 to $599
- 91$600 to $699
- 533$700 to $799
- 307$800 to $899
- 306$900 to $999
- 210$1,000 to $1,249
- 661$1,250 to $1,499
- 519$1,500 to $1,999
- 444$2,000 or more

Median rent in 2022:
| Northwest Industrial: | $1,576 |
| El Monte: | $1,410 |
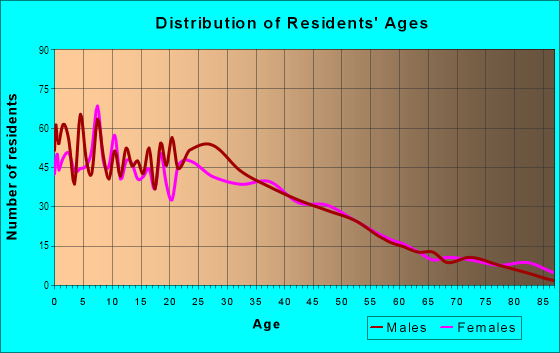
| Males: | 5,556 |
| Females: | 5,171 |
Males:
| This neighborhood: | 36.5 years |
| Whole city: | 35.8 years |
| This neighborhood: | 38.7 years |
| Whole city: | 37.8 years |
Average household size:
| Northwest Industrial: | 6.1 people |
| El Monte: | 3.4 people |
Percentage of family households:
| Northwest Industrial: | 44.9% |
| El Monte: | 54.5% |
| Here: | 43.8% |
| El Monte: | 45.5% |
Percentage of married-couple families with children (among all households):
| Northwest Industrial: | 17.8% |
| El Monte: | 15.3% |
Percentage of single-mother households (among all households):
| Northwest Industrial: | 9.0% |
| El Monte: | 9.5% |
Percentage of never married males 15 years old and over:
Percentage of never married females 15 years old and over:
| Northwest Industrial: | 19.5% |
| El Monte: | 22.9% |
Percentage of never married females 15 years old and over:
| Northwest Industrial: | 17.4% |
| city: | 19.7% |
Percentage of people that speak English not well or not at all:
| Northwest Industrial: | 31.9% |
| El Monte: | 29.0% |
Percentage of people born in this state:
Percentage of people born in another U.S. state:
Percentage of native residents but born outside the U.S.:
Percentage of foreign born residents:
| Here: | 49.6% |
| El Monte: | 44.3% |
Percentage of people born in another U.S. state:
| Northwest Industrial: | 3.5% |
| El Monte: | 2.2% |
Percentage of native residents but born outside the U.S.:
| Here: | 1.1% |
| city: | 1.1% |
Percentage of foreign born residents:
| Here: | 46.0% |
| El Monte: | 52.3% |

Owner-occupied
Renter-occupied


- Rooms in owner-occupied houses and condos in Northwest Industrial
- 71 room
- 142 rooms
- 753 rooms
- 2194 rooms
- 3235 rooms
- 3226 rooms
- 1947 rooms
- 2428 rooms
- 979+ rooms

- Rooms in renter-occupied apartments in Northwest Industrial
- 6761 room
- 5462 rooms
- 4993 rooms
- 6754 rooms
- 2195 rooms
- 2746 rooms
- 937 rooms
- 578 rooms
- 769+ rooms
Owner-occupied
Renter-occupied

- Bedrooms in owner-occupied houses and condos in Northwest Industrial
- 7no bedroom
- 311 bedroom
- 2222 bedrooms
- 5883 bedrooms
- 5494 bedrooms
- 685+ bedrooms

- Bedrooms in renter-occupied apartments in Northwest Industrial
- 682no bedroom
- 9071 bedroom
- 7262 bedrooms
- 2873 bedrooms
- 2164 bedrooms
- 765+ bedrooms
Average number of cars or other vehicles available in houses/condos:
Average number of cars or other vehicles available in apartments:
| This neighborhood: | 2.7 |
| El Monte: | 2.5 |
Average number of cars or other vehicles available in apartments:
| Here: | 1.3 |
| city: | 1.7 |
Percentage of units with a mortgage:
| Northwest Industrial: | 61.9% |
| El Monte: | 56.0% |
Average estimated value of detached houses in 2022 (51.1% of all units):
| Northwest Industrial: | $551,818 |
| California: | $988,808 |

- Year house built in Northwest Industrial
- 2582020 or later
- 2892010 to 2019
- 7902000 to 2009
- 1951990 to 1999
- 3111980 to 1989
- 3351970 to 1979
- 4381960 to 1969
- 7671950 to 1959
- 5111940 to 1949
- 2861939 or earlier

City-data.com crime index for city in 2020 (higher means more crime):
| City: | 191.4 |
| U.S. average: | 219.5 |
Travel time to work (commute)
![Travel time to work (commute)]()
- 30Less than 5 minutes
- 1285 to 9 minutes
- 14710 to 14 minutes
- 28215 to 19 minutes
- 31320 to 24 minutes
- 10625 to 29 minutes
- 32430 to 34 minutes
- 5135 to 39 minutes
- 7840 to 44 minutes
- 32045 to 59 minutes
- 19860 to 89 minutes
- 7790 or more minutes

Means of transportation to work
![Means of transportation to work]()
- 77.8%3,440Drove a car alone
- 8.2%362Carpooled
- 4.6%202Bus
- 4.9%216Subway or elevated rail
- 0.3%12Light rail, streetcar or trolley
- 1.7%75Taxi
- 19.8%873Bicycle
- 2.4%107Walked
- 1.1%47Other means
- 8.0%355Worked at home

Time leaving home to go to work
![Time leaving home to go to work]()
- 14612:00 a.m. to 4:59 a.m.
- 535:00 a.m. to 5:29 a.m.
- 1505:30 a.m. to 5:59 a.m.
- 1826:00 a.m. to 6:29 a.m.
- 1186:30 a.m. to 6:59 a.m.
- 1847:00 a.m. to 7:29 a.m.
- 1137:30 a.m. to 7:59 a.m.
- 2558:00 a.m. to 8:29 a.m.
- 1338:30 a.m. to 8:59 a.m.
- 1689:00 a.m. to 9:59 a.m.
- 13510:00 a.m. to 10:59 a.m.
- 3711:00 a.m. to 11:59 a.m.
- 11912:00 p.m. to 3:59 p.m.
- 924:00 p.m. to 11:59 p.m.

Occupations of males:
- Percentage of males in management occupations (except farmers):
Here: 4.8% city: 4.8%
- Percentage of males in computer and mathematical occupations:
Here: 1.6% city: 2.4%
- Percentage of males in architecture and engineering occupations:
Here: 2.0% city: 1.1%
- Percentage of males in education, training, and library occupations:
Here: 2.8% city: 1.9%
- Percentage of males in arts, design, entertainment, sports, and media occupations:
Here: 2.2% city: 1.8%
- Percentage of males in healthcare practitioners and technical occupations:
Here: 2.9% city: 2.0%
- Percentage of males in service occupations:
Here: 20.7% city: 19.7%
- Percentage of males in sales and office occupations:
Here: 20.3% city: 14.9%
- Percentage of males in construction, extraction, and maintenance occupations:
Here: 9.4% city: 11.1%
- Percentage of males in production occupations:
Here: 10.9% city: 12.1%
- Percentage of males in transportation occupations:
Here: 6.1% city: 8.7%
- Percentage of males in material moving occupations:
Here: 8.9% city: 9.6%
Occupations of females:
- Percentage of females in management occupations (except farmers):
Here: 9.9% city: 6.1%
- Percentage of females in business and financial operations occupations:
Here: 7.0% city: 4.7%
- Percentage of females in community and social services occupations:
Here: 1.3% city: 1.8%
- Percentage of females in education, training, and library occupations:
Here: 3.5% city: 4.7%
- Percentage of females in arts, design, entertainment, sports, and media occupations:
Here: 2.6% city: 0.9%
- Percentage of females in healthcare practitioners and technical occupations:
Here: 9.6% city: 4.7%
- Percentage of females in service occupations:
Here: 21.4% city: 30.7%
- Percentage of females in sales and office occupations:
Here: 29.0% city: 28.7%
- Percentage of females in production occupations:
Here: 3.7% city: 8.9%
- Percentage of females in transportation occupations:
Here: 6.0% city: 1.8%
- Percentage of females in material moving occupations:
Here: 4.1% city: 3.7%
Percentage of people 16-64 in Armed Forces:
| Northwest Industrial: | 0.0% |
| El Monte: | 0.1% |
Education in this neighborhood (subdivision or community):
- Percentage of people 3 years and older in K-12 schools:
Northwest Industrial: 16.7% El Monte: 17.9%
- Percentage of people 3 years and older in undergraduate colleges:
Northwest Industrial: 8.1% El Monte: 6.0%
- Percentage of people 3 years and older in grad. or professional schools:
Northwest Industrial: 1.2% El Monte: 0.6%
- Percentage of students K-12 enrolled in private schools:
Northwest Industrial: 19.3% El Monte: 6.3%
Percentage of population below poverty level:
| Northwest Industrial: | 17.7% |
| El Monte: | 16.0% |
Median year owner moved in (as recorded in 2022):
Median year renter moved in (as recorded in 2022):
| Northwest Industrial: | 2001 |
| El Monte: | 2005 |
Median year renter moved in (as recorded in 2022):
| Northwest Industrial: | 2014 |
| El Monte: | 2015 |
Percentage of married-couple families with both working:
| Northwest Industrial: | 63.9% |
| El Monte: | 58.8% |

- 59.4%Utility gas
- 24.7%Electricity
- 5.8%No fuel used
- 4.9%Bottled, tank, or LP gas
- 2.1%Solar energy
- 2.1%Other fuel
- 0.9%Fuel oil, kerosene, etc.
Roads and streets:
Lower Azusa Rd
Length: 1.51 miles
Direction: E-W
Address range: 9354 to 10398
Direction: E-W
Address range: 9354 to 10398
Valley Blvd
Length: 1.48 miles
Directions: E-W, SE-NW
Address range: 9448 to 10551
Directions: E-W, SE-NW
Address range: 9448 to 10551
Arden Dr
Length: 1.08 miles
Directions: N-S, SW-NE
Address range: 3800 to 4799
Directions: N-S, SW-NE
Address range: 3800 to 4799
Shirley Ave
Length: 0.88 miles
Directions: N-S, SE-NW, SW-NE
Address range: 3900 to 4599
Directions: N-S, SE-NW, SW-NE
Address range: 3900 to 4599
Baldwin Ave
Length: 0.86 miles
Directions: N-S, SW-NE
Address range: 3900 to 4599
Directions: N-S, SW-NE
Address range: 3900 to 4599
Temple City Blvd
Length: 0.64 miles
Directions: N-S, SE-NW, SW-NE
Address range: 3968 to 4599
Directions: N-S, SE-NW, SW-NE
Address range: 3968 to 4599
Rowland Ave
Length: 0.63 miles
Directions: N-S, SW-NE
Address range: 3900 to 4599
Directions: N-S, SW-NE
Address range: 3900 to 4599
Rose Ave
Length: 0.63 miles
Direction: E-W
Address range: 9900 to 10299
Direction: E-W
Address range: 9900 to 10299
Gidley St
Length: 0.55 miles
Directions: E-W, SE-NW
Address range: 9400 to 10099
Directions: E-W, SE-NW
Address range: 9400 to 10099
Bessie Ave
Length: 0.33 miles
Directions: E-W, N-S, SE-NW, SW-NE
Address range: 9900 to 10099
Directions: E-W, N-S, SE-NW, SW-NE
Address range: 9900 to 10099
Gibson Rd
Length: 0.31 miles
Directions: N-S, SE-NW
Address range: 3900 to 4199
Directions: N-S, SE-NW
Address range: 3900 to 4199
de Garmo Ave
Length: 0.30 miles
Direction: N-S
Address range: 3800 to 4099
Direction: N-S
Address range: 3800 to 4099
Velma Ave
Length: 0.30 miles
Direction: N-S
Address range: 3800 to 4099
Direction: N-S
Address range: 3800 to 4099
Eunice Ave
Length: 0.29 miles
Directions: N-S, SW-NE
Address range: 3900 to 4199
Directions: N-S, SW-NE
Address range: 3900 to 4199
Arden Way
Length: 0.25 miles
Directions: N-S, SW-NE
Address range: 4542 to 4799
Directions: N-S, SW-NE
Address range: 4542 to 4799
Easy St
Length: 0.22 miles
Directions: E-W, N-S, SE-NW
Address range: 4000 to 4099
Directions: E-W, N-S, SE-NW
Address range: 4000 to 4099
Ellis Ln
Length: 0.21 miles
Directions: E-W, N-S, SW-NE
Address range: 4400 to 4599
Directions: E-W, N-S, SW-NE
Address range: 4400 to 4599
Railroad Dr
Length: 0.17 miles
Direction: E-W
Address range: 10100 to 10299
Direction: E-W
Address range: 10100 to 10299
Eaton Way
Length: 0.14 miles
Direction: N-S
Direction: N-S
Bisby St
Length: 0.13 miles
Directions: E-W, SE-NW
Address range: 9500 to 9599
Directions: E-W, SE-NW
Address range: 9500 to 9599
Lorica St
Length: 0.12 miles
Direction: E-W
Address range: 9600 to 9699
Direction: E-W
Address range: 9600 to 9699
Abilene St
Length: 0.11 miles
Direction: E-W
Address range: 9700 to 9799
Direction: E-W
Address range: 9700 to 9799
Cloverly Ave
Length: 0.09 miles
Directions: N-S, SE-NW
Address range: 4500 to 4599
Directions: N-S, SE-NW
Address range: 4500 to 4599
Windsor Ln
Length: 0.09 miles
Direction: E-W
Address range: 9700 to 9899
Direction: E-W
Address range: 9700 to 9899
Fiesta Ave
Length: 0.07 miles
Directions: N-S, SE-NW
Address range: 4500 to 4599
Directions: N-S, SE-NW
Address range: 4500 to 4599
Miller Dr
Length: 0.05 miles
Direction: N-S
Address range: 4700 to 4799
Direction: N-S
Address range: 4700 to 4799
Brookline Ave
Length: 0.03 miles
Direction: SW-NE
Address range: 3880 to 3899
Direction: SW-NE
Address range: 3880 to 3899
Strang Ave
Length: 0.03 miles
Direction: SW-NE
Address range: 3843 to 3999
Direction: SW-NE
Address range: 3843 to 3999
Golden West Ave
Length: 0.02 miles
Direction: N-S
Address range: 4800 to 4855
Direction: N-S
Address range: 4800 to 4855
Railroad features:
Southern Pacific RR
Length: 1.25 miles
Directions: E-W, SE-NW
Directions: E-W, SE-NW
Other features:
Eaton Wash
Length: 0.85 miles
Directions: E-W, N-S, SE-NW
Directions: E-W, N-S, SE-NW