Neighborhood L (L) neighborhood in Rohnert Park, California (CA), 94928, 94931 detailed profile
Settings
X


Business Search - 14 Million verified businesses
Area: 0.400 square miles
Population: 2,372
Population density:
| Neighborhood L (L): | 5,929 people per square mile |
| Rohnert Park: | 6,910 people per square mile |

- 1,53562.4%White
- 57723.4%Hispanic or Latino
- 1817.4%Two or more races
- 542.2%Asian
- 542.2%Some other race
- 431.7%Native Hawaiian and Other
Pacific Islander - 100.4%Black
- 70.3%American Indian

Median household income in 2022:
| Neighborhood L (L): | $105,484 |
| Rohnert Park: | $93,322 |
Distribution of median household income
![Distribution of median household income]()
- 51Less than $10,000
- 141$10,000 to $19,999
- 71$20,000 to $29,999
- 113$30,000 to $39,999
- 101$40,000 to $49,999
- 180$50,000 to $59,999
- 71$60,000 to $74,999
- 150$75,000 to $99,999
- 181$100,000 to $124,999
- 166$125,000 to $149,999
- 112$150,000 to $199,999
- 89$200,000 or more

Distribution of owner-occupied house/condo value
![Distribution of owner-occupied house/condo value]()
- 22$50,000 to $99,999
- 6$150,000 to $199,999
- 67$250,000 to $299,999
- 109$300,000 to $399,999
- 44$400,000 to $499,999
- 429$500,000 to $749,999
- 133$750,000 to $999,999
- 51$1,000,000 or more

Distribution of rent paid by renters
![Distribution of rent paid by renters]()
- 110$200 to $299
- 21$600 to $699
- 93$900 to $999
- 75$1,000 to $1,249
- 48$1,250 to $1,499
- 91$1,500 to $1,999
- 272$2,000 or more

Median rent in 2022:
| Neighborhood L (L): | $2,183 |
| Rohnert Park: | $1,984 |
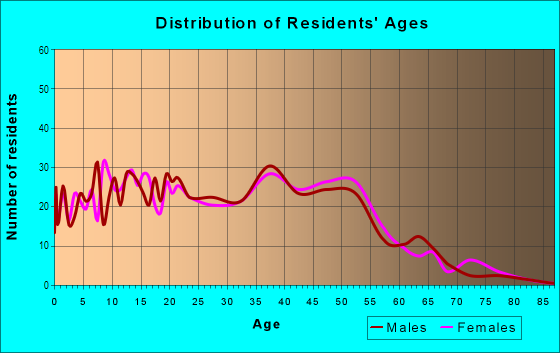
| Males: | 1,024 |
| Females: | 1,347 |
Males:
| This neighborhood: | 40.0 years |
| Whole city: | 35.9 years |
| This neighborhood: | 36.5 years |
| Whole city: | 34.5 years |
Average household size:
| Neighborhood L (L): | 2.4 people |
| Rohnert Park: | 2.6 people |
Percentage of family households:
| Neighborhood L (L): | 43.6% |
| Rohnert Park: | 43.9% |
| Here: | 41.3% |
| Rohnert Park: | 43.1% |
Percentage of married-couple families with children (among all households):
| Neighborhood L (L): | 36.7% |
| Rohnert Park: | 24.7% |
Percentage of single-mother households (among all households):
| Neighborhood L (L): | 5.5% |
| Rohnert Park: | 10.3% |
Percentage of never married males 15 years old and over:
Percentage of never married females 15 years old and over:
| Neighborhood L (L): | 14.8% |
| Rohnert Park: | 20.3% |
Percentage of never married females 15 years old and over:
| Neighborhood L (L): | 19.5% |
| city: | 21.1% |
Percentage of people that speak English not well or not at all:
| Neighborhood L (L): | 3.9% |
| Rohnert Park: | 3.7% |
Percentage of people born in this state:
Percentage of people born in another U.S. state:
Percentage of native residents but born outside the U.S.:
Percentage of foreign born residents:
| Here: | 73.9% |
| Rohnert Park: | 65.7% |
Percentage of people born in another U.S. state:
| Neighborhood L (L): | 18.2% |
| Rohnert Park: | 18.6% |
Percentage of native residents but born outside the U.S.:
| Here: | 0.7% |
| city: | 1.1% |
Percentage of foreign born residents:
| Here: | 7.2% |
| Rohnert Park: | 14.5% |

Owner-occupied
Renter-occupied


- Rooms in owner-occupied houses and condos in Neighborhood L <
> - 01 room
- 02 rooms
- 403 rooms
- 764 rooms
- 2835 rooms
- 1166 rooms
- 1387 rooms
- 488 rooms
- 169+ rooms

- Rooms in renter-occupied apartments in Neighborhood L <
> - 111 room
- 1812 rooms
- 1543 rooms
- 774 rooms
- 1245 rooms
- 656 rooms
- 277 rooms
- 288 rooms
- 369+ rooms
Owner-occupied
Renter-occupied

- Bedrooms in owner-occupied houses and condos in Neighborhood L <
> - 46no bedroom
- 121 bedroom
- 952 bedrooms
- 3723 bedrooms
- 1364 bedrooms
- 175+ bedrooms

- Bedrooms in renter-occupied apartments in Neighborhood L <
> - 11no bedroom
- 3151 bedroom
- 1352 bedrooms
- 793 bedrooms
- 494 bedrooms
- 285+ bedrooms
Average number of cars or other vehicles available in houses/condos:
Average number of cars or other vehicles available in apartments:
| This neighborhood: | 2.1 |
| Rohnert Park: | 2.3 |
Average number of cars or other vehicles available in apartments:
| Here: | 1.6 |
| city: | 1.9 |
Percentage of units with a mortgage:
| Neighborhood L (L): | 77.3% |
| Rohnert Park: | 69.0% |
Average estimated value of detached houses in 2022 (59.2% of all units):
| Neighborhood L (L): | $798,792 |
| Rohnert Park: | $718,881 |

- Year house built in Neighborhood L <
> - 02020 or later
- 732010 to 2019
- 2572000 to 2009
- 1971990 to 1999
- 2171980 to 1989
- 5371970 to 1979
- 301960 to 1969
- 301950 to 1959
- 51940 to 1949
- 91939 or earlier

City-data.com crime index for city in 2020 (higher means more crime):
| City: | 266.5 |
| U.S. average: | 219.5 |
Travel time to work (commute)
![Travel time to work (commute)]()
- 77Less than 5 minutes
- 345 to 9 minutes
- 17310 to 14 minutes
- 15115 to 19 minutes
- 12220 to 24 minutes
- 3025 to 29 minutes
- 19030 to 34 minutes
- 4535 to 39 minutes
- 1840 to 44 minutes
- 12045 to 59 minutes
- 16560 to 89 minutes
- 3090 or more minutes

Means of transportation to work
![Means of transportation to work]()
- 71.4%898Drove a car alone
- 6.3%79Carpooled
- 2.0%25Bus
- 1.6%20Subway or elevated rail
- 0.4%5Long-distance train or commuter rail
- 0.8%10Motorcycle
- 6.5%82Bicycle
- 3.7%47Walked
- 1.8%23Other means
- 19.4%244Worked at home

Time leaving home to go to work
![Time leaving home to go to work]()
- 4012:00 a.m. to 4:59 a.m.
- 355:00 a.m. to 5:29 a.m.
- 605:30 a.m. to 5:59 a.m.
- 806:00 a.m. to 6:29 a.m.
- 676:30 a.m. to 6:59 a.m.
- 927:00 a.m. to 7:29 a.m.
- 2267:30 a.m. to 7:59 a.m.
- 1338:00 a.m. to 8:29 a.m.
- 708:30 a.m. to 8:59 a.m.
- 709:00 a.m. to 9:59 a.m.
- 7310:00 a.m. to 10:59 a.m.
- 6411:00 a.m. to 11:59 a.m.
- 5712:00 p.m. to 3:59 p.m.
- 704:00 p.m. to 11:59 p.m.

Occupations of males:
- Percentage of males in management occupations (except farmers):
Here: 8.8% city: 10.9%
- Percentage of males in business and financial operations occupations:
Here: 6.7% city: 3.0%
- Percentage of males in computer and mathematical occupations:
Here: 4.3% city: 4.9%
- Percentage of males in education, training, and library occupations:
Here: 2.0% city: 1.7%
- Percentage of males in arts, design, entertainment, sports, and media occupations:
Here: 6.4% city: 1.7%
- Percentage of males in healthcare practitioners and technical occupations:
Here: 2.0% city: 3.6%
- Percentage of males in service occupations:
Here: 15.5% city: 20.6%
- Percentage of males in sales and office occupations:
Here: 10.4% city: 16.7%
- Percentage of males in farming, fishing, and forestry occupations:
Here: 1.9% city: 0.5%
- Percentage of males in construction, extraction, and maintenance occupations:
Here: 25.3% city: 15.5%
- Percentage of males in production occupations:
Here: 8.8% city: 3.8%
- Percentage of males in transportation occupations:
Here: 2.8% city: 4.0%
Occupations of females:
- Percentage of females in management occupations (except farmers):
Here: 8.5% city: 7.5%
- Percentage of females in business and financial operations occupations:
Here: 6.5% city: 5.5%
- Percentage of females in computer and mathematical occupations:
Here: 3.7% city: 0.9%
- Percentage of females in life, physical, and social science occupations:
Here: 1.3% city: 0.9%
- Percentage of females in community and social services occupations:
Here: 7.9% city: 3.6%
- Percentage of females in legal occupations:
Here: 1.2% city: 0.9%
- Percentage of females in education, training, and library occupations:
Here: 6.0% city: 9.5%
- Percentage of females in arts, design, entertainment, sports, and media occupations:
Here: 5.4% city: 2.4%
- Percentage of females in healthcare practitioners and technical occupations:
Here: 6.3% city: 8.1%
- Percentage of females in service occupations:
Here: 6.4% city: 24.0%
- Percentage of females in sales and office occupations:
Here: 42.1% city: 30.9%
- Percentage of females in transportation occupations:
Here: 1.5% city: 1.0%
- Percentage of females in material moving occupations:
Here: 1.7% city: 1.2%
Education in this neighborhood (subdivision or community):
- Percentage of people 3 years and older in K-12 schools:
Neighborhood L (L): 19.2% Rohnert Park: 15.1%
- Percentage of people 3 years and older in undergraduate colleges:
Neighborhood L (L): 11.2% Rohnert Park: 10.5%
- Percentage of people 3 years and older in grad. or professional schools:
Neighborhood L (L): 2.4% Rohnert Park: 0.9%
- Percentage of students K-12 enrolled in private schools:
Neighborhood L (L): 14.8% Rohnert Park: 4.1%
Percentage of population below poverty level:
| Neighborhood L (L): | 10.0% |
| Rohnert Park: | 9.7% |
Median year owner moved in (as recorded in 2022):
Median year renter moved in (as recorded in 2022):
| Neighborhood L (L): | 2008 |
| Rohnert Park: | 2008 |
Median year renter moved in (as recorded in 2022):
| Neighborhood L (L): | 2017 |
| Rohnert Park: | 2017 |
Percentage of married-couple families with both working:
| Neighborhood L (L): | 58.3% |
| Rohnert Park: | 74.9% |

- 67.1%Utility gas
- 17.1%Electricity
- 10.6%Wood
- 2.2%Bottled, tank, or LP gas
- 1.8%Solar energy
- 1.2%No fuel used
Roads and streets:
Lancaster Dr
Length: 1.11 miles
Directions: E-W, N-S, SE-NW
Address range: 8200 to 8999
Directions: E-W, N-S, SE-NW
Address range: 8200 to 8999
Lincoln Ave
Length: 0.52 miles
Directions: E-W, N-S, SW-NE
Address range: 217 to 799
Directions: E-W, N-S, SW-NE
Address range: 217 to 799
Liman Way
Length: 0.44 miles
Directions: E-W, N-S, SE-NW, SW-NE
Address range: 8400 to 8554
Directions: E-W, N-S, SE-NW, SW-NE
Address range: 8400 to 8554
Lakewood Ave
Length: 0.39 miles
Directions: E-W, N-S, SE-NW, SW-NE
Address range: 8300 to 8599
Directions: E-W, N-S, SE-NW, SW-NE
Address range: 8300 to 8599
Loretto Ave
Length: 0.39 miles
Directions: E-W, N-S, SE-NW
Address range: 8400 to 8585
Directions: E-W, N-S, SE-NW
Address range: 8400 to 8585
Lords Manor Way
Length: 0.35 miles
Directions: E-W, N-S, SE-NW
Address range: 8640 to 8799
Directions: E-W, N-S, SE-NW
Address range: 8640 to 8799
Lombard Way
Length: 0.34 miles
Directions: E-W, SE-NW, SW-NE
Address range: 770 to 8599
Directions: E-W, SE-NW, SW-NE
Address range: 770 to 8599
Lasalle Ave
Length: 0.32 miles
Directions: N-S, SE-NW
Address range: 8355 to 8599
Directions: N-S, SE-NW
Address range: 8355 to 8599
Larch Ave
Length: 0.32 miles
Directions: E-W, N-S, SE-NW, SW-NE
Address range: 8400 to 8599
Directions: E-W, N-S, SE-NW, SW-NE
Address range: 8400 to 8599
Landsdown Cir
Length: 0.29 miles
Directions: E-W, N-S, SE-NW, SW-NE
Address range: 453 to 520
Directions: E-W, N-S, SE-NW, SW-NE
Address range: 453 to 520
Lilac Way
Length: 0.22 miles
Direction: E-W
Address range: 800 to 854
Direction: E-W
Address range: 800 to 854
Laurelwood Dr
Length: 0.22 miles
Directions: N-S, SE-NW
Address range: 8630 to 8799
Directions: N-S, SE-NW
Address range: 8630 to 8799
Lindsay Ave
Length: 0.17 miles
Directions: E-W, SW-NE
Address range: 700 to 799
Directions: E-W, SW-NE
Address range: 700 to 799
Manor Dr
Length: 0.17 miles
Directions: E-W, SE-NW
Directions: E-W, SE-NW
Liberty Ave
Length: 0.16 miles
Direction: SE-NW
Address range: 8300 to 8499
Direction: SE-NW
Address range: 8300 to 8499
Linden Ave
Length: 0.15 miles
Directions: N-S, SE-NW
Address range: 8400 to 8599
Directions: N-S, SE-NW
Address range: 8400 to 8599
Myrtle Ave
Length: 0.15 miles
Direction: E-W
Address range: 501 to 599
Direction: E-W
Address range: 501 to 599
Lunar Ct
Length: 0.14 miles
Directions: E-W, N-S, SE-NW, SW-NE
Address range: 821 to 899
Directions: E-W, N-S, SE-NW, SW-NE
Address range: 821 to 899
Lassen Ct
Length: 0.12 miles
Directions: E-W, SW-NE
Address range: 500 to 599
Directions: E-W, SW-NE
Address range: 500 to 599
Lanyard Ct W
Length: 0.10 miles
Directions: E-W, SW-NE
Address range: 500 to 599
Directions: E-W, SW-NE
Address range: 500 to 599
Lamont Ct N
Length: 0.10 miles
Directions: N-S, SW-NE
Address range: 559 to 599
Directions: N-S, SW-NE
Address range: 559 to 599
Liana Ct
Length: 0.10 miles
Direction: E-W
Address range: 800 to 899
Direction: E-W
Address range: 800 to 899
Lorraine Ct S
Length: 0.09 miles
Directions: N-S, SW-NE
Address range: 520 to 560
Directions: N-S, SW-NE
Address range: 520 to 560
Lorraine Ct N
Length: 0.08 miles
Directions: N-S, SE-NW
Address range: 556 to 599
Directions: N-S, SE-NW
Address range: 556 to 599
Lisbon Ct
Length: 0.08 miles
Direction: E-W
Address range: 700 to 799
Direction: E-W
Address range: 700 to 799
Lamont Ct S
Length: 0.08 miles
Direction: N-S
Address range: 524 to 564
Direction: N-S
Address range: 524 to 564
Lydia Ct N
Length: 0.07 miles
Directions: N-S, SE-NW
Address range: 553 to 599
Directions: N-S, SE-NW
Address range: 553 to 599
Lancewood Ct
Length: 0.07 miles
Directions: E-W, SW-NE
Address range: 800 to 899
Directions: E-W, SW-NE
Address range: 800 to 899
Lacrosse Ct S
Length: 0.07 miles
Directions: N-S, SE-NW, SW-NE
Address range: 518 to 570
Directions: N-S, SE-NW, SW-NE
Address range: 518 to 570
Liberty Ct
Length: 0.06 miles
Directions: E-W, SW-NE
Address range: 700 to 799
Directions: E-W, SW-NE
Address range: 700 to 799
Linden Ct
Length: 0.06 miles
Directions: E-W, SW-NE
Address range: 400 to 430
Directions: E-W, SW-NE
Address range: 400 to 430
Lightwood Ct
Length: 0.06 miles
Direction: E-W
Address range: 800 to 846
Direction: E-W
Address range: 800 to 846
Loadstone Ct
Length: 0.06 miles
Directions: E-W, SW-NE
Address range: 800 to 899
Directions: E-W, SW-NE
Address range: 800 to 899
Livery Ct
Length: 0.05 miles
Direction: SW-NE
Address range: 783 to 816
Direction: SW-NE
Address range: 783 to 816
Lanyard Ct E
Length: 0.04 miles
Directions: E-W, SW-NE
Address range: 500 to 699
Directions: E-W, SW-NE
Address range: 500 to 699
Benson Ln
Length: 0.04 miles
Direction: SW-NE
Address range: 91 to 149
Direction: SW-NE
Address range: 91 to 149
Lydia Ct S
Length: 0.04 miles
Directions: N-S, SW-NE
Address range: 530 to 558
Directions: N-S, SW-NE
Address range: 530 to 558
Lacrosse Ct N
Length: 0.04 miles
Directions: N-S, SW-NE
Address range: 546 to 599
Directions: N-S, SW-NE
Address range: 546 to 599
Larkspur Ct
Length: 0.03 miles
Direction: SW-NE
Address range: 400 to 452
Direction: SW-NE
Address range: 400 to 452
Railroad features:
Northwestern Pacific RR
Length: 0.64 miles
Direction: SE-NW
Direction: SE-NW
Other features:
Laguna de Santa Rosa
Length: 0.43 miles
Directions: E-W, SE-NW
Directions: E-W, SE-NW