Neighborhood A (A) neighborhood in Rohnert Park, California (CA), 94928 detailed profile
Settings
X


Business Search - 14 Million verified businesses
Area: 0.364 square miles
Population: 6,465
Population density:
| Neighborhood A (A): | 17,741 people per square mile |
| Rohnert Park: | 6,910 people per square mile |

- 3,36750.5%Hispanic or Latino
- 2,56838.6%White
- 2123.2%Black
- 1842.8%Asian
- 1682.5%Two or more races
- 1151.7%Native Hawaiian and Other
Pacific Islander - 470.7%Some other race

Median household income in 2022:
| Neighborhood A (A): | $77,211 |
| Rohnert Park: | $93,322 |
Distribution of median household income
![Distribution of median household income]()
- 74Less than $10,000
- 152$10,000 to $19,999
- 164$20,000 to $29,999
- 198$30,000 to $39,999
- 123$40,000 to $49,999
- 251$50,000 to $59,999
- 165$60,000 to $74,999
- 646$75,000 to $99,999
- 217$100,000 to $124,999
- 305$125,000 to $149,999
- 243$150,000 to $199,999
- 87$200,000 or more

Distribution of owner-occupied house/condo value
![Distribution of owner-occupied house/condo value]()
- 121Less than $50,000
- 327$50,000 to $99,999
- 45$100,000 to $149,999
- 69$150,000 to $199,999
- 69$200,000 to $249,999
- 26$250,000 to $299,999
- 49$300,000 to $399,999
- 104$400,000 to $499,999
- 274$500,000 to $749,999
- 35$750,000 to $999,999
- 35$1,000,000 or more

Distribution of rent paid by renters
![Distribution of rent paid by renters]()
- 40$100 to $199
- 83$200 to $299
- 180$300 to $399
- 25$400 to $499
- 187$500 to $599
- 44$700 to $799
- 43$800 to $899
- 17$900 to $999
- 145$1,000 to $1,249
- 64$1,250 to $1,499
- 796$1,500 to $1,999
- 628$2,000 or more

Median rent in 2022:
| Neighborhood A (A): | $1,946 |
| Rohnert Park: | $1,984 |
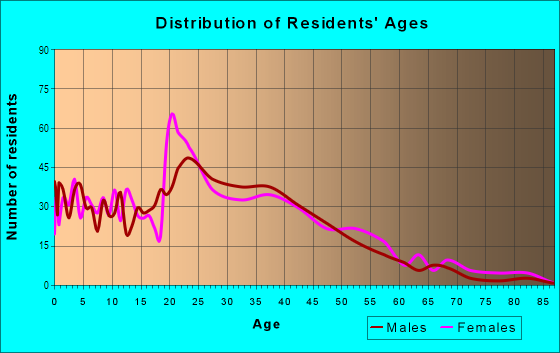
| Males: | 2,942 |
| Females: | 3,523 |
Males:
| This neighborhood: | 34.3 years |
| Whole city: | 35.9 years |
| This neighborhood: | 31.5 years |
| Whole city: | 34.5 years |
Average household size:
| Neighborhood A (A): | 2.6 people |
| Rohnert Park: | 2.6 people |
Percentage of family households:
| Neighborhood A (A): | 66.1% |
| Rohnert Park: | 43.9% |
| Here: | 40.9% |
| Rohnert Park: | 43.1% |
Percentage of married-couple families with children (among all households):
| Neighborhood A (A): | 17.8% |
| Rohnert Park: | 24.7% |
Percentage of single-mother households (among all households):
| Neighborhood A (A): | 13.4% |
| Rohnert Park: | 10.3% |
Percentage of never married males 15 years old and over:
Percentage of never married females 15 years old and over:
| Neighborhood A (A): | 25.6% |
| Rohnert Park: | 20.3% |
Percentage of never married females 15 years old and over:
| Neighborhood A (A): | 27.2% |
| city: | 21.1% |
Percentage of people that speak English not well or not at all:
| Neighborhood A (A): | 8.2% |
| Rohnert Park: | 3.7% |
Percentage of people born in this state:
Percentage of people born in another U.S. state:
Percentage of native residents but born outside the U.S.:
Percentage of foreign born residents:
| Here: | 52.4% |
| Rohnert Park: | 65.7% |
Percentage of people born in another U.S. state:
| Neighborhood A (A): | 18.6% |
| Rohnert Park: | 18.6% |
Percentage of native residents but born outside the U.S.:
| Here: | 1.3% |
| city: | 1.1% |
Percentage of foreign born residents:
| Here: | 27.7% |
| Rohnert Park: | 14.5% |

Owner-occupied
Renter-occupied


- Rooms in owner-occupied houses and condos in Neighborhood A <>
- 01 room
- 172 rooms
- 633 rooms
- 774 rooms
- 935 rooms
- 766 rooms
- 1677 rooms
- 548 rooms
- 409+ rooms

- Rooms in renter-occupied apartments in Neighborhood A <>
- 861 room
- 1292 rooms
- 5243 rooms
- 3474 rooms
- 3645 rooms
- 1086 rooms
- 797 rooms
- 148 rooms
- 229+ rooms


Average number of cars or other vehicles available in houses/condos:
Average number of cars or other vehicles available in apartments:
| This neighborhood: | 2.3 |
| Rohnert Park: | 2.3 |
Average number of cars or other vehicles available in apartments:
| Here: | 2.0 |
| city: | 1.9 |
Percentage of units with a mortgage:
| Neighborhood A (A): | 76.3% |
| Rohnert Park: | 69.0% |
Average estimated value of detached houses in 2022 (39.2% of all units):
| Neighborhood A (A): | $533,793 |
| Rohnert Park: | $718,881 |

- Year house built in Neighborhood A <>
- 162020 or later
- 482010 to 2019
- 2362000 to 2009
- 4361990 to 1999
- 2101980 to 1989
- 6741970 to 1979
- 4321960 to 1969
- 1781950 to 1959
- 2081940 to 1949
- 411939 or earlier

City-data.com crime index for city in 2020 (higher means more crime):
| City: | 266.5 |
| U.S. average: | 219.5 |
Travel time to work (commute)
![Travel time to work (commute)]()
- 67Less than 5 minutes
- 1775 to 9 minutes
- 26610 to 14 minutes
- 17215 to 19 minutes
- 41820 to 24 minutes
- 21725 to 29 minutes
- 21730 to 34 minutes
- 1235 to 39 minutes
- 11040 to 44 minutes
- 13645 to 59 minutes
- 16760 to 89 minutes
- 2890 or more minutes

Means of transportation to work
![Means of transportation to work]()
- 68.8%2,330Drove a car alone
- 6.8%231Carpooled
- 0.4%14Bus
- 1.0%35Subway or elevated rail
- 6.5%219Long-distance train or commuter rail
- 5.6%191Taxi
- 0.8%26Motorcycle
- 0.3%11Bicycle
- 2.9%97Walked
- 2.8%96Other means
- 16.9%571Worked at home

Time leaving home to go to work
![Time leaving home to go to work]()
- 9012:00 a.m. to 4:59 a.m.
- 515:00 a.m. to 5:29 a.m.
- 675:30 a.m. to 5:59 a.m.
- 2236:00 a.m. to 6:29 a.m.
- 1156:30 a.m. to 6:59 a.m.
- 4267:00 a.m. to 7:29 a.m.
- 2247:30 a.m. to 7:59 a.m.
- 2158:00 a.m. to 8:29 a.m.
- 778:30 a.m. to 8:59 a.m.
- 1299:00 a.m. to 9:59 a.m.
- 2810:00 a.m. to 10:59 a.m.
- 5511:00 a.m. to 11:59 a.m.
- 18812:00 p.m. to 3:59 p.m.
- 844:00 p.m. to 11:59 p.m.

Occupations of males:
- Percentage of males in management occupations (except farmers):
Here: 9.4% city: 10.9%
- Percentage of males in computer and mathematical occupations:
Here: 3.2% city: 4.9%
- Percentage of males in community and social services occupations:
Here: 2.1% city: 0.3%
- Percentage of males in healthcare practitioners and technical occupations:
Here: 4.9% city: 3.6%
- Percentage of males in service occupations:
Here: 21.8% city: 20.6%
- Percentage of males in sales and office occupations:
Here: 17.0% city: 16.7%
- Percentage of males in construction, extraction, and maintenance occupations:
Here: 21.4% city: 15.5%
- Percentage of males in production occupations:
Here: 6.2% city: 3.8%
- Percentage of males in transportation occupations:
Here: 2.7% city: 4.0%
- Percentage of males in material moving occupations:
Here: 6.2% city: 4.2%
Occupations of females:
- Percentage of females in management occupations (except farmers):
Here: 3.8% city: 7.5%
- Percentage of females in business and financial operations occupations:
Here: 1.9% city: 5.5%
- Percentage of females in life, physical, and social science occupations:
Here: 2.7% city: 0.9%
- Percentage of females in community and social services occupations:
Here: 3.7% city: 3.6%
- Percentage of females in education, training, and library occupations:
Here: 3.3% city: 9.5%
- Percentage of females in arts, design, entertainment, sports, and media occupations:
Here: 4.1% city: 2.4%
- Percentage of females in healthcare practitioners and technical occupations:
Here: 3.8% city: 8.1%
- Percentage of females in service occupations:
Here: 34.3% city: 24.0%
- Percentage of females in sales and office occupations:
Here: 26.9% city: 30.9%
- Percentage of females in farming, fishing, and forestry occupations:
Here: 4.2% city: 0.4%
- Percentage of females in production occupations:
Here: 6.0% city: 2.3%
- Percentage of females in transportation occupations:
Here: 2.0% city: 1.0%
- Percentage of females in material moving occupations:
Here: 3.3% city: 1.2%
Percentage of people 16-64 in Armed Forces:
| Neighborhood A (A): | 0.0% |
| Rohnert Park: | 0.2% |
Education in this neighborhood (subdivision or community):
- Percentage of people 3 years and older in K-12 schools:
Neighborhood A (A): 30.0% Rohnert Park: 15.1%
- Percentage of people 3 years and older in undergraduate colleges:
Neighborhood A (A): 8.6% Rohnert Park: 10.5%
- Percentage of people 3 years and older in grad. or professional schools:
Neighborhood A (A): 0.8% Rohnert Park: 0.9%
- Percentage of students K-12 enrolled in private schools:
Neighborhood A (A): 4.6% Rohnert Park: 4.1%
Percentage of population below poverty level:
| Neighborhood A (A): | 11.5% |
| Rohnert Park: | 9.7% |
Median year owner moved in (as recorded in 2022):
Median year renter moved in (as recorded in 2022):
| Neighborhood A (A): | 2006 |
| Rohnert Park: | 2008 |
Median year renter moved in (as recorded in 2022):
| Neighborhood A (A): | 2015 |
| Rohnert Park: | 2017 |
Percentage of married-couple families with both working:
| Neighborhood A (A): | 103.3% |
| Rohnert Park: | 74.9% |

- 44.3%Utility gas
- 38.4%Electricity
- 4.7%No fuel used
- 4.1%Other fuel
- 3.6%Wood
- 2.8%Bottled, tank, or LP gas
- 2.1%Solar energy
Roads and streets:
Southwest Blvd
Length: 1.64 miles
Directions: E-W, SE-NW, SW-NE
Address range: 1 to 599
Directions: E-W, SE-NW, SW-NE
Address range: 1 to 599
Santa Alicia Dr
Length: 0.91 miles
Directions: E-W, N-S, SW-NE
Address range: 2 to 998
Directions: E-W, N-S, SW-NE
Address range: 2 to 998
Arlen Dr
Length: 0.72 miles
Directions: E-W, N-S, SW-NE
Address range: 1 to 555
Directions: E-W, N-S, SW-NE
Address range: 1 to 555
Alta Ave
Length: 0.66 miles
Directions: E-W, N-S, SE-NW, SW-NE
Address range: 474 to 7299
Directions: E-W, N-S, SE-NW, SW-NE
Address range: 474 to 7299
Anson Ave
Length: 0.58 miles
Directions: E-W, SW-NE
Address range: 400 to 599
Directions: E-W, SW-NE
Address range: 400 to 599
Commerce Blvd
Length: 0.57 miles
Directions: E-W, N-S, SE-NW, SW-NE
Address range: 6725 to 7199
Directions: E-W, N-S, SE-NW, SW-NE
Address range: 6725 to 7199
Alma Ave
Length: 0.54 miles
Directions: E-W, N-S, SE-NW, SW-NE
Address range: 25 to 7298
Directions: E-W, N-S, SE-NW, SW-NE
Address range: 25 to 7298
Adele Ave
Length: 0.54 miles
Directions: E-W, N-S, SE-NW, SW-NE
Address range: 41 to 7198
Directions: E-W, N-S, SE-NW, SW-NE
Address range: 41 to 7198
Alison Ave
Length: 0.47 miles
Direction: E-W
Address range: 1 to 371
Direction: E-W
Address range: 1 to 371
Redwood Hwy N
Length: 0.42 miles
Direction: N-S
Direction: N-S
Allan Ave
Length: 0.36 miles
Direction: E-W
Address range: 28 to 353
Direction: E-W
Address range: 28 to 353
Ava Ave
Length: 0.35 miles
Directions: E-W, N-S, SW-NE
Address range: 400 to 559
Directions: E-W, N-S, SW-NE
Address range: 400 to 559
Alden Ave
Length: 0.35 miles
Directions: E-W, N-S, SE-NW
Address range: 37 to 366
Directions: E-W, N-S, SE-NW
Address range: 37 to 366
Adrian Dr
Length: 0.27 miles
Direction: N-S
Address range: 7000 to 7307
Direction: N-S
Address range: 7000 to 7307
Avram Ave
Length: 0.26 miles
Directions: E-W, SE-NW
Address range: 1 to 206
Directions: E-W, SE-NW
Address range: 1 to 206
Seed Farm Dr
Length: 0.22 miles
Directions: N-S, SE-NW, SW-NE
Directions: N-S, SE-NW, SW-NE
Almond St
Length: 0.20 miles
Direction: SE-NW
Address range: 7021 to 7099
Direction: SE-NW
Address range: 7021 to 7099
Adrian Ct
Length: 0.09 miles
Directions: E-W, N-S, SW-NE
Address range: 400 to 467
Directions: E-W, N-S, SW-NE
Address range: 400 to 467
Anson Ct
Length: 0.03 miles
Direction: SE-NW
Address range: 500 to 544
Direction: SE-NW
Address range: 500 to 544
No Name St
Length: 0.03 miles
Direction: N-S
Direction: N-S
Railroad features:
Northwestern Pacific RR
Length: 0.18 miles
Direction: SE-NW
Direction: SE-NW
Other features:
Copeland Crk
Length: 0.98 miles
Direction: E-W
Direction: E-W
Laguna de Santa Rosa
Length: 0.12 miles
Directions: E-W, N-S, SE-NW
Directions: E-W, N-S, SE-NW