Monterey Heights neighborhood in San Francisco, California (CA), 94127 detailed profile
Settings
X

Business Search - 14 Million verified businesses
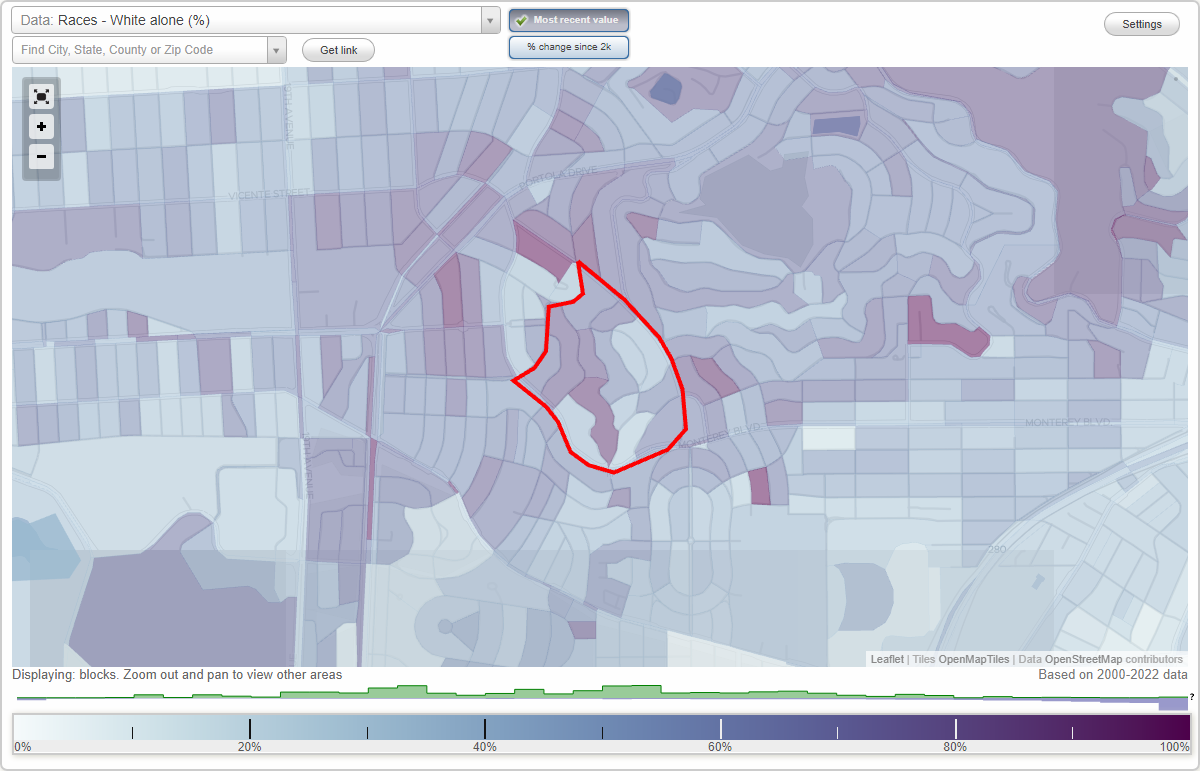
Area: 0.112 square miles
Population: 1,030
Population density:
| Monterey Heights: | 9,158 people per square mile |
| San Francisco: | 17,313 people per square mile |

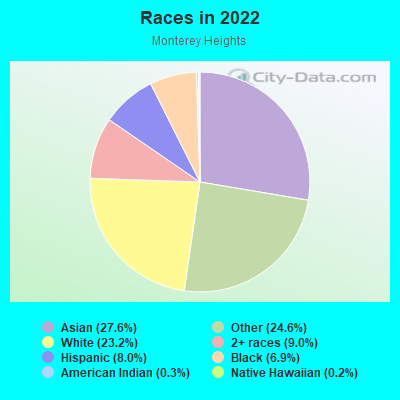
- 41227.6%Asian
- 36824.6%Some other race
- 34723.2%White
- 1359.0%Two or more races
- 1208.0%Hispanic or Latino
- 1036.9%Black
- 50.3%American Indian
- 30.2%Native Hawaiian and Other
Pacific Islander
Distribution of median household income
![Distribution of median household income]()
- 30Less than $10,000
- 55$10,000 to $19,999
- 34$20,000 to $29,999
- 57$30,000 to $39,999
- 25$40,000 to $49,999
- 39$50,000 to $59,999
- 27$60,000 to $74,999
- 51$75,000 to $99,999
- 22$100,000 to $124,999
- 17$125,000 to $149,999
- 43$150,000 to $199,999
- 178$200,000 or more

Distribution of owner-occupied house/condo value
![Distribution of owner-occupied house/condo value]()
- 32Less than $50,000
- 14$100,000 to $149,999
- 7$150,000 to $199,999
- 25$300,000 to $399,999
- 6$400,000 to $499,999
- 36$500,000 to $749,999
- 18$750,000 to $999,999
- 340$1,000,000 or more

Distribution of rent paid by renters
![Distribution of rent paid by renters]()
- 5$200 to $299
- 13$400 to $499
- 16$700 to $799
- 3$1,000 to $1,249
- 11$1,250 to $1,499
- 32$1,500 to $1,999
- 83$2,000 or more

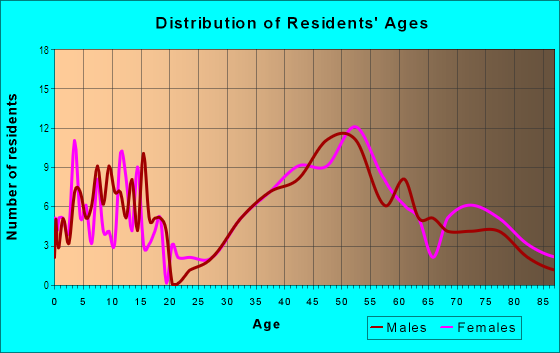
| Males: | 445 |
| Females: | 584 |
Males:
| This neighborhood: | 44.6 years |
| Whole city: | 40.3 years |
| This neighborhood: | 44.7 years |
| Whole city: | 40.5 years |
Average household size:
| Monterey Heights: | 3.1 people |
| San Francisco: | 2.2 people |
Percentage of family households:
| Monterey Heights: | 33.3% |
| San Francisco: | 30.3% |
| Here: | 58.6% |
| San Francisco: | 35.3% |
Percentage of married-couple families with children (among all households):
| Monterey Heights: | 35.1% |
| San Francisco: | 35.9% |
Percentage of single-mother households (among all households):
| Monterey Heights: | 2.7% |
| San Francisco: | 6.0% |
Percentage of never married males 15 years old and over:
Percentage of never married females 15 years old and over:
| Monterey Heights: | 12.2% |
| San Francisco: | 24.6% |
Percentage of never married females 15 years old and over:
| Monterey Heights: | 10.0% |
| city: | 19.9% |
Percentage of people that speak English not well or not at all:
| Monterey Heights: | 7.9% |
| San Francisco: | 10.9% |
Percentage of people born in this state:
Percentage of people born in another U.S. state:
Percentage of native residents but born outside the U.S.:
Percentage of foreign born residents:
| Here: | 50.5% |
| San Francisco: | 40.8% |
Percentage of people born in another U.S. state:
| Monterey Heights: | 20.2% |
| San Francisco: | 23.4% |
Percentage of native residents but born outside the U.S.:
| Here: | 1.5% |
| city: | 2.6% |
Percentage of foreign born residents:
| Here: | 27.9% |
| San Francisco: | 33.2% |
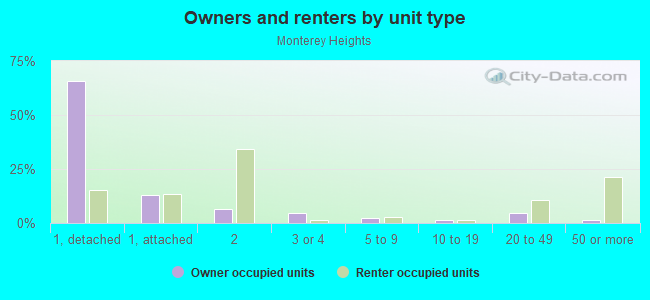
Owner-occupied
Renter-occupied

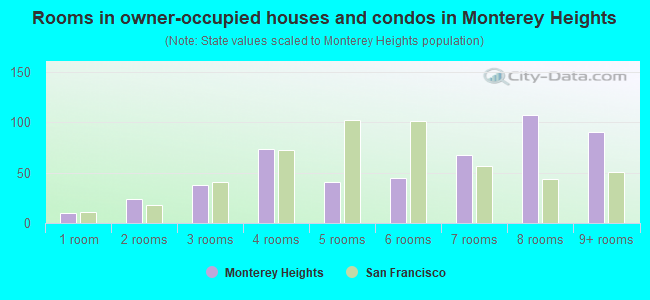
- Rooms in owner-occupied houses and condos in Monterey Heights
- 101 room
- 242 rooms
- 383 rooms
- 734 rooms
- 415 rooms
- 456 rooms
- 677 rooms
- 1078 rooms
- 909+ rooms
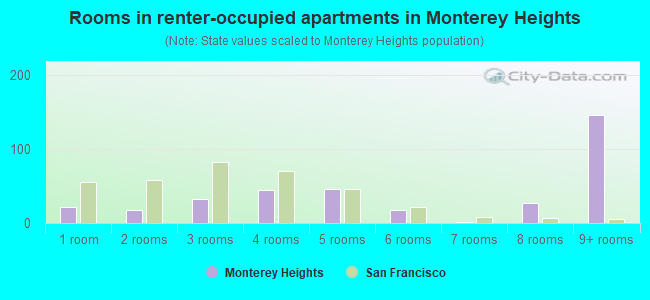
- Rooms in renter-occupied apartments in Monterey Heights
- 221 room
- 172 rooms
- 333 rooms
- 444 rooms
- 465 rooms
- 176 rooms
- 27 rooms
- 278 rooms
- 1469+ rooms
Owner-occupied
Renter-occupied
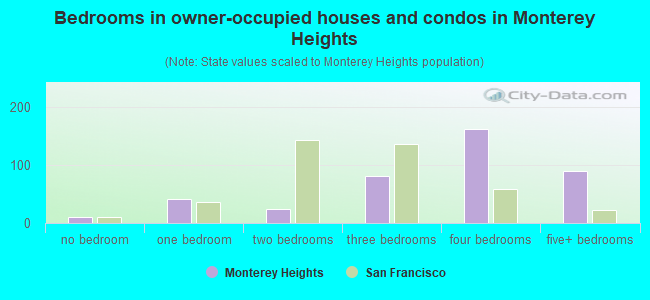
- Bedrooms in owner-occupied houses and condos in Monterey Heights
- 10no bedroom
- 411 bedroom
- 242 bedrooms
- 813 bedrooms
- 1624 bedrooms
- 895+ bedrooms
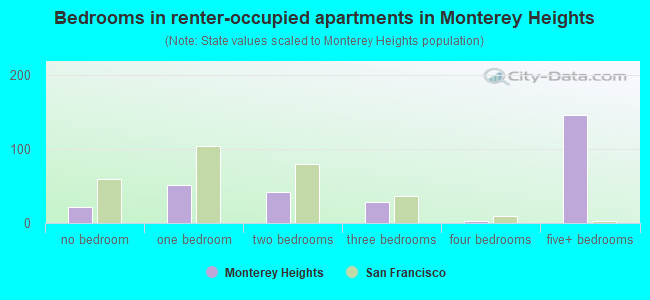
- Bedrooms in renter-occupied apartments in Monterey Heights
- 22no bedroom
- 511 bedroom
- 422 bedrooms
- 293 bedrooms
- 34 bedrooms
- 1465+ bedrooms
Average number of cars or other vehicles available in houses/condos:
Average number of cars or other vehicles available in apartments:
| This neighborhood: | 1.5 |
| San Francisco: | 1.5 |
Average number of cars or other vehicles available in apartments:
| Here: | |
| city: |
Percentage of units with a mortgage:
| Monterey Heights: | 53.9% |
| San Francisco: | 62.3% |
Average estimated value of detached houses in 2022 (98.0% of all units):
| Monterey Heights: | $2,344,561 |
| San Francisco: | $1,942,973 |
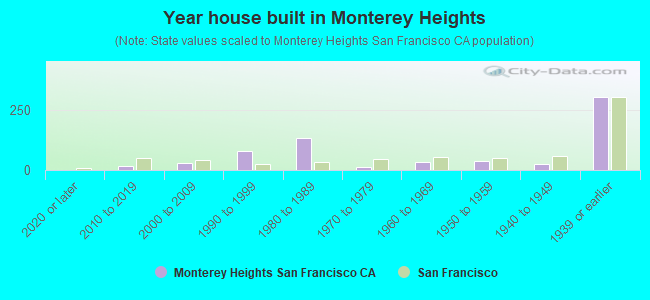
- Year house built in Monterey Heights
- 02020 or later
- 162010 to 2019
- 292000 to 2009
- 811990 to 1999
- 1331980 to 1989
- 121970 to 1979
- 321960 to 1969
- 371950 to 1959
- 271940 to 1949
- 3031939 or earlier
City-data.com crime index for city in 2020 (higher means more crime):
| City: | 387.4 |
| U.S. average: | 219.5 |
Travel time to work (commute)
![Travel time to work (commute)]()
- 5Less than 5 minutes
- 245 to 9 minutes
- 4010 to 14 minutes
- 5115 to 19 minutes
- 5820 to 24 minutes
- 2525 to 29 minutes
- 7430 to 34 minutes
- 3835 to 39 minutes
- 1740 to 44 minutes
- 1645 to 59 minutes
- 3260 to 89 minutes
- 490 or more minutes

Means of transportation to work
![Means of transportation to work]()
- 47.6%230Drove a car alone
- 3.3%16Carpooled
- 3.3%16Bus
- 10.1%49Subway or elevated rail
- 5.0%24Long-distance train or commuter rail
- 13.3%64Light rail, streetcar or trolley
- 2.9%14Taxi
- 1.7%8Bicycle
- 5.2%25Walked
- 1.7%8Other means
- 43.1%208Worked at home

Time leaving home to go to work
![Time leaving home to go to work]()
- 1012:00 a.m. to 4:59 a.m.
- 195:00 a.m. to 5:29 a.m.
- 55:30 a.m. to 5:59 a.m.
- 236:00 a.m. to 6:29 a.m.
- 206:30 a.m. to 6:59 a.m.
- 507:00 a.m. to 7:29 a.m.
- 597:30 a.m. to 7:59 a.m.
- 548:00 a.m. to 8:29 a.m.
- 508:30 a.m. to 8:59 a.m.
- 589:00 a.m. to 9:59 a.m.
- 4810:00 a.m. to 10:59 a.m.
- 711:00 a.m. to 11:59 a.m.
- 1212:00 p.m. to 3:59 p.m.
- 164:00 p.m. to 11:59 p.m.

Occupations of males:
- Percentage of males in management occupations (except farmers):
Here: 34.5% city: 17.2%
- Percentage of males in business and financial operations occupations:
Here: 1.6% city: 8.9%
- Percentage of males in computer and mathematical occupations:
Here: 14.6% city: 14.6%
- Percentage of males in architecture and engineering occupations:
Here: 6.6% city: 4.0%
- Percentage of males in legal occupations:
Here: 1.5% city: 2.5%
- Percentage of males in education, training, and library occupations:
Here: 10.9% city: 3.4%
- Percentage of males in healthcare practitioners and technical occupations:
Here: 1.6% city: 3.2%
- Percentage of males in sales and office occupations:
Here: 11.1% city: 13.5%
- Percentage of males in production occupations:
Here: 6.2% city: 2.5%
- Percentage of males in transportation occupations:
Here: 9.4% city: 3.4%
Occupations of females:
- Percentage of females in management occupations (except farmers):
Here: 12.3% city: 15.8%
- Percentage of females in business and financial operations occupations:
Here: 17.5% city: 11.5%
- Percentage of females in computer and mathematical occupations:
Here: 13.1% city: 5.1%
- Percentage of females in life, physical, and social science occupations:
Here: 1.5% city: 2.9%
- Percentage of females in community and social services occupations:
Here: 3.5% city: 1.6%
- Percentage of females in legal occupations:
Here: 2.6% city: 3.0%
- Percentage of females in arts, design, entertainment, sports, and media occupations:
Here: 1.8% city: 5.1%
- Percentage of females in healthcare practitioners and technical occupations:
Here: 9.6% city: 8.4%
- Percentage of females in service occupations:
Here: 14.2% city: 15.4%
- Percentage of females in sales and office occupations:
Here: 23.6% city: 19.3%
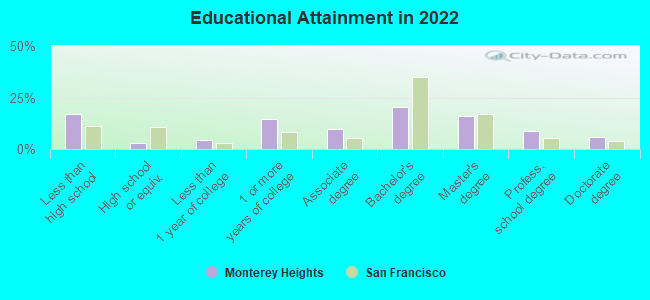
Education in this neighborhood (subdivision or community):
- Percentage of people 3 years and older in K-12 schools:
Monterey Heights: 21.5% San Francisco: 9.7%
- Percentage of people 3 years and older in undergraduate colleges:
Monterey Heights: 3.0% San Francisco: 4.8%
- Percentage of people 3 years and older in grad. or professional schools:
Monterey Heights: 6.7% San Francisco: 2.6%
- Percentage of students K-12 enrolled in private schools:
Monterey Heights: 96.8% San Francisco: 36.5%
Percentage of population below poverty level:
| Monterey Heights: | 5.9% |
| San Francisco: | 10.4% |
Median year owner moved in (as recorded in 2022):
| Monterey Heights: | 2003 |
| San Francisco: | 2007 |
Percentage of married-couple families with both working:
| Monterey Heights: | 98.3% |
| San Francisco: | 75.9% |
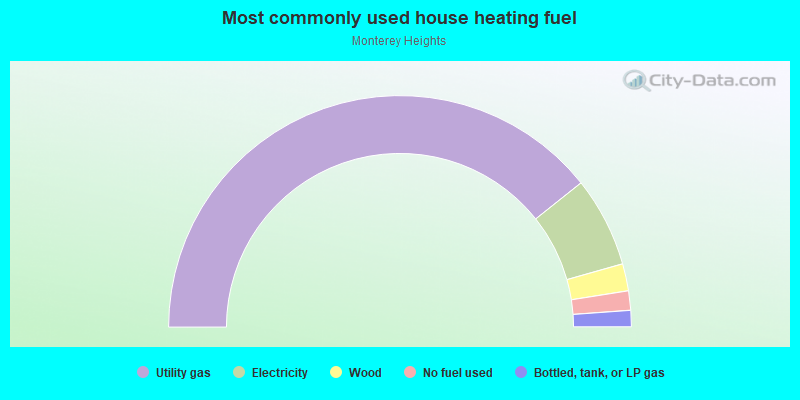
- 78.7%Utility gas
- 12.6%Electricity
- 3.8%Wood
- 2.7%No fuel used
- 2.3%Bottled, tank, or LP gas
Roads and streets:
Monterey Blvd
Length: 0.63 miles
Directions: E-W, N-S, SE-NW, SW-NE
Address range: 1001 to 1455
Directions: E-W, N-S, SE-NW, SW-NE
Address range: 1001 to 1455
Maywood Dr
Length: 0.42 miles
Directions: E-W, N-S, SE-NW, SW-NE
Address range: 1 to 299
Directions: E-W, N-S, SE-NW, SW-NE
Address range: 1 to 299
Yerba Buena Ave
Length: 0.36 miles
Directions: N-S, SE-NW
Address range: 140 to 399
Directions: N-S, SE-NW
Address range: 140 to 399
San Felipe Ave
Length: 0.25 miles
Directions: N-S, SE-NW, SW-NE
Address range: 1 to 199
Directions: N-S, SE-NW, SW-NE
Address range: 1 to 199
San Jacinto Way
Length: 0.24 miles
Directions: N-S, SE-NW, SW-NE
Address range: 26 to 99
Directions: N-S, SE-NW, SW-NE
Address range: 26 to 99
Fernwood Dr
Length: 0.23 miles
Directions: N-S, SE-NW
Address range: 1 to 199
Directions: N-S, SE-NW
Address range: 1 to 199
el Verano Way
Length: 0.22 miles
Directions: E-W, N-S, SW-NE
Address range: 1 to 199
Directions: E-W, N-S, SW-NE
Address range: 1 to 199
Brentwood Ave
Length: 0.22 miles
Directions: E-W, N-S, SW-NE
Address range: 200 to 399
Directions: E-W, N-S, SW-NE
Address range: 200 to 399
St Elmo Way
Length: 0.21 miles
Directions: E-W, N-S, SW-NE
Address range: 1 to 199
Directions: E-W, N-S, SW-NE
Address range: 1 to 199
Rosewood Dr
Length: 0.21 miles
Directions: E-W, N-S, SE-NW, SW-NE
Address range: 1 to 99
Directions: E-W, N-S, SE-NW, SW-NE
Address range: 1 to 99
Ravenwood Dr
Length: 0.19 miles
Directions: E-W, SW-NE
Address range: 1 to 99
Directions: E-W, SW-NE
Address range: 1 to 99
Miraloma Dr
Length: 0.01 miles
Direction: SE-NW
Address range: 202 to 206
Direction: SE-NW
Address range: 202 to 206