Marine neighborhood in Redwood City, Aghnajane, California (CA), 94002, 94065 detailed profile
Settings
X


Business Search - 14 Million verified businesses
Area: 0.387 square miles
Population: 1,278
Population density:
| Marine: | 3,305 people per square mile |
| Redwood City: | 4,134 people per square mile |

- 60746.7%Asian
- 44033.8%White
- 1209.2%Hispanic or Latino
- 705.4%Two or more races
- 382.9%Native Hawaiian and Other
Pacific Islander - 141.1%Some other race
- 110.8%Black

Distribution of median household income
![Distribution of median household income]()
- 20Less than $10,000
- 17$10,000 to $19,999
- 20$20,000 to $29,999
- 24$30,000 to $39,999
- 15$40,000 to $49,999
- 14$50,000 to $59,999
- 7$60,000 to $74,999
- 25$75,000 to $99,999
- 91$100,000 to $124,999
- 39$125,000 to $149,999
- 47$150,000 to $199,999
- 239$200,000 or more

Distribution of owner-occupied house/condo value
![Distribution of owner-occupied house/condo value]()
- 3Less than $50,000
- 8$50,000 to $99,999
- 3$100,000 to $149,999
- 5$300,000 to $399,999
- 17$400,000 to $499,999
- 19$500,000 to $749,999
- 72$750,000 to $999,999
- 193$1,000,000 or more

Distribution of rent paid by renters
![Distribution of rent paid by renters]()
- 74$300 to $399
- 6$400 to $499
- 23$800 to $899
- 13$1,000 to $1,249
- 26$1,250 to $1,499
- 7$1,500 to $1,999
- 220$2,000 or more

Median rent in 2022:
| Marine: | $3,383 |
| Redwood City: | $2,001 |
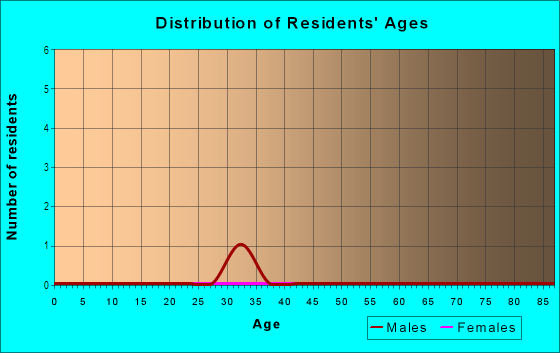
| Males: | 627 |
| Females: | 650 |
Males:
| This neighborhood: | 39.7 years |
| Whole city: | 34.0 years |
| This neighborhood: | 43.2 years |
| Whole city: | 37.5 years |
Average household size:
| Marine: | 2.6 people |
| Redwood City: | 2.6 people |
Percentage of family households:
| Marine: | 53.8% |
| Redwood City: | 48.9% |
| Here: | 51.8% |
| Redwood City: | 49.5% |
Percentage of married-couple families with children (among all households):
| Marine: | 34.3% |
| Redwood City: | 30.8% |
Percentage of single-mother households (among all households):
| Marine: | 3.7% |
| Redwood City: | 5.0% |
Percentage of never married males 15 years old and over:
Percentage of never married females 15 years old and over:
| Marine: | 13.1% |
| Redwood City: | 20.9% |
Percentage of never married females 15 years old and over:
| Marine: | 14.2% |
| city: | 15.9% |
Percentage of people that speak English not well or not at all:
| Marine: | 1.4% |
| Redwood City: | 7.0% |
Percentage of people born in this state:
Percentage of people born in another U.S. state:
Percentage of native residents but born outside the U.S.:
Percentage of foreign born residents:
| Here: | 45.1% |
| Redwood City: | 50.0% |
Percentage of people born in another U.S. state:
| Marine: | 16.0% |
| Redwood City: | 16.0% |
Percentage of native residents but born outside the U.S.:
| Here: | 2.4% |
| city: | 2.1% |
Percentage of foreign born residents:
| Here: | 36.5% |
| Redwood City: | 31.9% |

Owner-occupied
Renter-occupied


- Rooms in owner-occupied houses and condos in Marine
- 01 room
- 12 rooms
- 333 rooms
- 904 rooms
- 965 rooms
- 496 rooms
- 177 rooms
- 68 rooms
- 59+ rooms

- Rooms in renter-occupied apartments in Marine
- 361 room
- 112 rooms
- 303 rooms
- 694 rooms
- 525 rooms
- 166 rooms
- 427 rooms
- 38 rooms
- 29+ rooms
Owner-occupied
Renter-occupied

- Bedrooms in owner-occupied houses and condos in Marine
- 0no bedroom
- 331 bedroom
- 1022 bedrooms
- 1483 bedrooms
- 404 bedrooms
- 25+ bedrooms

- Bedrooms in renter-occupied apartments in Marine
- 36no bedroom
- 221 bedroom
- 1102 bedrooms
- 763 bedrooms
- 94 bedrooms
- 25+ bedrooms
Average number of cars or other vehicles available in houses/condos:
Average number of cars or other vehicles available in apartments:
| This neighborhood: | 1.6 |
| Redwood City: | 2.1 |
Average number of cars or other vehicles available in apartments:
| Here: | 1.6 |
| city: | 1.5 |
Percentage of units with a mortgage:
| Marine: | 72.4% |
| Redwood City: | 71.1% |
Housing prices:
- Average estimated value of detached houses in 2022 (28.3% of all units):
Marine: $1,649,726 California: $988,808
- Average estimated value of townhouses or other attached units in 2022 (25.1% of all units):
This neighborhood: $1,090,036 California: $838,546

- Year house built in Marine
- 02020 or later
- 62010 to 2019
- 62000 to 2009
- 871990 to 1999
- 3581980 to 1989
- 361970 to 1979
- 481960 to 1969
- 191950 to 1959
- 1131940 to 1949
- 51939 or earlier

City-data.com crime index for city in 2020 (higher means more crime):
| City: | 167.5 |
| U.S. average: | 219.5 |
Travel time to work (commute)
![Travel time to work (commute)]()
- 6Less than 5 minutes
- 275 to 9 minutes
- 4010 to 14 minutes
- 5915 to 19 minutes
- 4520 to 24 minutes
- 2025 to 29 minutes
- 7230 to 34 minutes
- 2635 to 39 minutes
- 1940 to 44 minutes
- 6245 to 59 minutes
- 2060 to 89 minutes
- 890 or more minutes

Means of transportation to work
![Means of transportation to work]()
- 48.4%328Drove a car alone
- 10.8%73Carpooled
- 4.6%31Bus
- 3.8%26Subway or elevated rail
- 4.4%30Long-distance train or commuter rail
- 1.5%10Light rail, streetcar or trolley
- 0.1%1Taxi
- 0.7%5Bicycle
- 6.1%41Walked
- 1.2%8Other means
- 31.0%210Worked at home

Time leaving home to go to work
![Time leaving home to go to work]()
- 812:00 a.m. to 4:59 a.m.
- 145:00 a.m. to 5:29 a.m.
- 25:30 a.m. to 5:59 a.m.
- 196:00 a.m. to 6:29 a.m.
- 226:30 a.m. to 6:59 a.m.
- 427:00 a.m. to 7:29 a.m.
- 557:30 a.m. to 7:59 a.m.
- 898:00 a.m. to 8:29 a.m.
- 608:30 a.m. to 8:59 a.m.
- 479:00 a.m. to 9:59 a.m.
- 1710:00 a.m. to 10:59 a.m.
- 211:00 a.m. to 11:59 a.m.
- 1712:00 p.m. to 3:59 p.m.
- 94:00 p.m. to 11:59 p.m.

Occupations of males:
- Percentage of males in management occupations (except farmers):
Here: 13.2% city: 16.8%
- Percentage of males in business and financial operations occupations:
Here: 15.0% city: 5.3%
- Percentage of males in computer and mathematical occupations:
Here: 22.2% city: 12.5%
- Percentage of males in architecture and engineering occupations:
Here: 5.2% city: 5.7%
- Percentage of males in life, physical, and social science occupations:
Here: 9.8% city: 3.9%
- Percentage of males in legal occupations:
Here: 1.4% city: 1.2%
- Percentage of males in education, training, and library occupations:
Here: 3.6% city: 3.3%
- Percentage of males in arts, design, entertainment, sports, and media occupations:
Here: 8.1% city: 2.7%
- Percentage of males in healthcare practitioners and technical occupations:
Here: 1.4% city: 2.6%
- Percentage of males in service occupations:
Here: 3.4% city: 13.8%
- Percentage of males in sales and office occupations:
Here: 14.8% city: 10.3%
Occupations of females:
- Percentage of females in management occupations (except farmers):
Here: 22.9% city: 15.2%
- Percentage of females in business and financial operations occupations:
Here: 3.4% city: 7.3%
- Percentage of females in computer and mathematical occupations:
Here: 7.2% city: 5.3%
- Percentage of females in architecture and engineering occupations:
Here: 1.4% city: 1.4%
- Percentage of females in life, physical, and social science occupations:
Here: 10.0% city: 4.4%
- Percentage of females in education, training, and library occupations:
Here: 7.1% city: 9.3%
- Percentage of females in arts, design, entertainment, sports, and media occupations:
Here: 1.5% city: 2.9%
- Percentage of females in healthcare practitioners and technical occupations:
Here: 9.9% city: 7.4%
- Percentage of females in service occupations:
Here: 15.8% city: 17.8%
- Percentage of females in sales and office occupations:
Here: 17.6% city: 20.9%
Education in this neighborhood (subdivision or community):
- Percentage of people 3 years and older in K-12 schools:
Marine: 24.8% Redwood City: 16.6%
- Percentage of people 3 years and older in undergraduate colleges:
Marine: 3.8% Redwood City: 5.1%
- Percentage of people 3 years and older in grad. or professional schools:
Marine: 0.4% Redwood City: 2.0%
- Percentage of students K-12 enrolled in private schools:
Marine: 14.8% Redwood City: 23.2%
Percentage of population below poverty level:
| Marine: | 6.4% |
| Redwood City: | 6.2% |
Median year owner moved in (as recorded in 2022):
Median year renter moved in (as recorded in 2022):
| Marine: | 2006 |
| Redwood City: | 2007 |
Median year renter moved in (as recorded in 2022):
| Marine: | 2016 |
| Redwood City: | 2020 |
Percentage of married-couple families with both working:
| Marine: | 70.8% |
| Redwood City: | 67.4% |

- 47.5%Electricity
- 41.0%Utility gas
- 5.3%No fuel used
- 2.4%Bottled, tank, or LP gas
- 2.0%Wood
- 1.0%Solar energy
- 0.7%Other fuel
Roads and streets:
Oracle Pkwy
Length: 0.91 miles
Directions: E-W, N-S, SE-NW, SW-NE
Address range: 100 to 699
Directions: E-W, N-S, SE-NW, SW-NE
Address range: 100 to 699
Marine Pkwy
Length: 0.84 miles
Directions: E-W, N-S, SW-NE
Address range: 108 to 399
Directions: E-W, N-S, SW-NE
Address range: 108 to 399
Twin Dolphin Dr
Length: 0.34 miles
Directions: N-S, SE-NW, SW-NE
Address range: 1 to 199
Directions: N-S, SE-NW, SW-NE
Address range: 1 to 199
Bridge Pkwy
Length: 0.33 miles
Directions: E-W, N-S, SE-NW, SW-NE
Address range: 1 to 391
Directions: E-W, N-S, SE-NW, SW-NE
Address range: 1 to 391
US Hwy 101
Length: 0.31 miles
Direction: SE-NW
Direction: SE-NW
Shoreway Rd
Length: 0.28 miles
Directions: N-S, SE-NW, SW-NE
Address range: 1000 to 1299
Directions: N-S, SE-NW, SW-NE
Address range: 1000 to 1299
Lagoon Dr
Length: 0.26 miles
Directions: E-W, N-S, SW-NE
Address range: 1 to 99
Directions: E-W, N-S, SW-NE
Address range: 1 to 99
Sem Ln
Length: 0.14 miles
Direction: SW-NE
Address range: 100 to 199
Direction: SW-NE
Address range: 100 to 199
Ralston Ave
Length: 0.12 miles
Directions: E-W, SW-NE
Directions: E-W, SW-NE
Marina Dr
Length: 0.08 miles
Directions: E-W, SW-NE
Directions: E-W, SW-NE