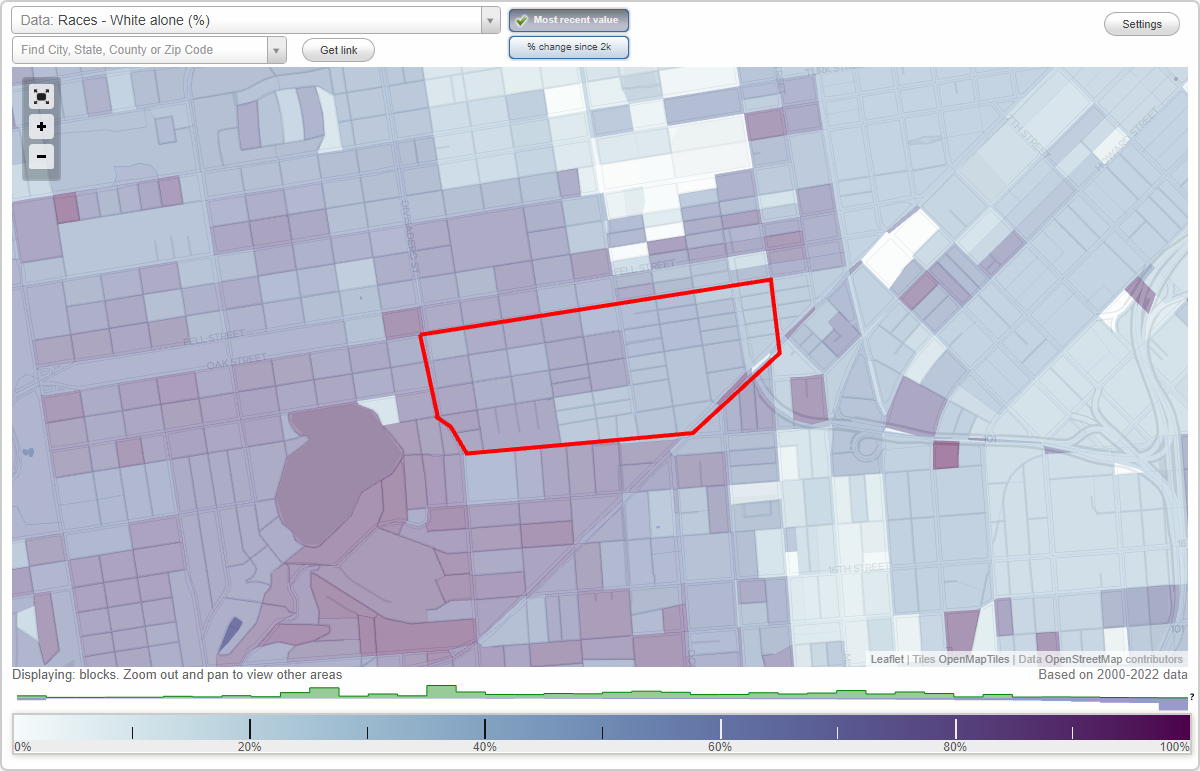
Lower Haight neighborhood in San Francisco, California (CA), 94102, 94117 detailed profile
Settings
X

Business Search - 14 Million verified businesses
Area: 0.236 square miles
Population: 9,007
Population density:
| Lower Haight: | 38,123 people per square mile |
| San Francisco: | 17,313 people per square mile |

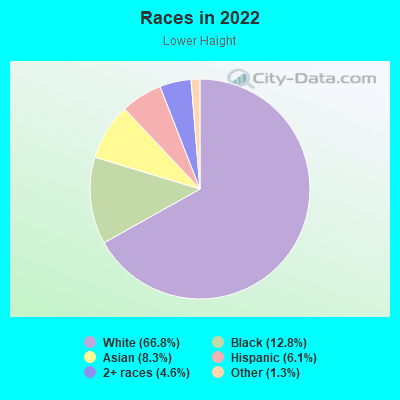
- 6,39166.8%White
- 1,22912.8%Black
- 7988.3%Asian
- 5866.1%Hispanic or Latino
- 4394.6%Two or more races
- 1281.3%Some other race
Median household income in 2022:
| Lower Haight: | $225,936 |
| San Francisco: | $136,692 |
Distribution of median household income
![Distribution of median household income]()
- 411Less than $10,000
- 126$10,000 to $19,999
- 42$20,000 to $29,999
- 285$30,000 to $39,999
- 384$40,000 to $49,999
- 154$50,000 to $59,999
- 510$60,000 to $74,999
- 136$75,000 to $99,999
- 313$100,000 to $124,999
- 204$125,000 to $149,999
- 395$150,000 to $199,999
- 2,302$200,000 or more

Distribution of owner-occupied house/condo value
![Distribution of owner-occupied house/condo value]()
- 42$400,000 to $499,999
- 157$500,000 to $749,999
- 87$750,000 to $999,999
- 923$1,000,000 or more

Distribution of rent paid by renters
![Distribution of rent paid by renters]()
- 238$600 to $699
- 154$700 to $799
- 223$800 to $899
- 89$900 to $999
- 199$1,000 to $1,249
- 341$1,250 to $1,499
- 607$1,500 to $1,999
- 2,058$2,000 or more

Median rent in 2022:
| Lower Haight: | $2,501 |
| San Francisco: | $2,001 |
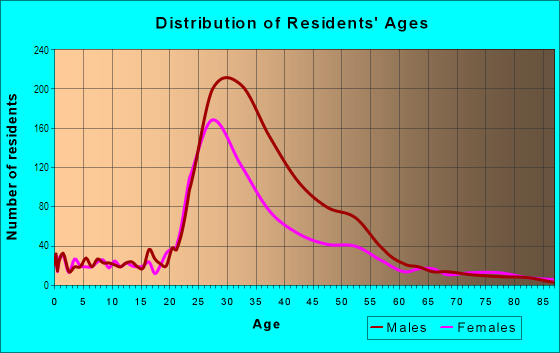
| Males: | 5,186 |
| Females: | 3,820 |
Males:
| This neighborhood: | 34.7 years |
| Whole city: | 40.3 years |
| This neighborhood: | 35.0 years |
| Whole city: | 40.5 years |
Average household size:
| Lower Haight: | 6.1 people |
| San Francisco: | 2.2 people |
Percentage of family households:
| Lower Haight: | 34.2% |
| San Francisco: | 30.3% |
| Here: | 24.0% |
| San Francisco: | 35.3% |
Percentage of married-couple families with children (among all households):
| Lower Haight: | 12.6% |
| San Francisco: | 35.9% |
Percentage of single-mother households (among all households):
| Lower Haight: | 34.7% |
| San Francisco: | 6.0% |
Percentage of never married males 15 years old and over:
Percentage of never married females 15 years old and over:
| Lower Haight: | 33.2% |
| San Francisco: | 24.6% |
Percentage of never married females 15 years old and over:
| Lower Haight: | 25.9% |
| city: | 19.9% |
Percentage of people that speak English not well or not at all:
| Lower Haight: | 0.3% |
| San Francisco: | 10.9% |
Percentage of people born in this state:
Percentage of people born in another U.S. state:
Percentage of native residents but born outside the U.S.:
Percentage of foreign born residents:
| Here: | 35.6% |
| San Francisco: | 40.8% |
Percentage of people born in another U.S. state:
| Lower Haight: | 51.6% |
| San Francisco: | 23.4% |
Percentage of native residents but born outside the U.S.:
| Here: | 2.7% |
| city: | 2.6% |
Percentage of foreign born residents:
| Here: | 10.1% |
| San Francisco: | 33.2% |
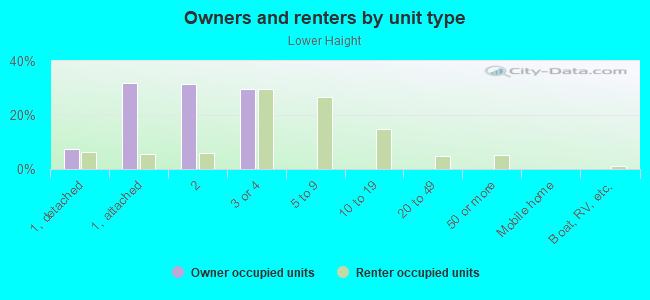
Owner-occupied
Renter-occupied

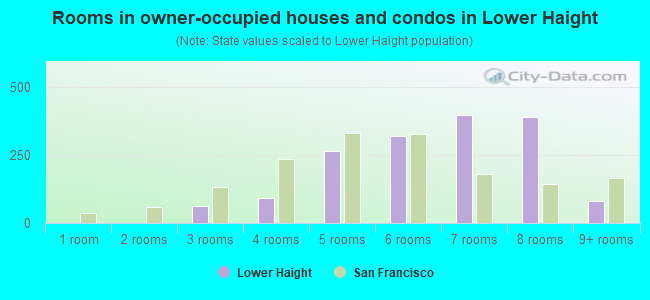
- Rooms in owner-occupied houses and condos in Lower Haight
- 01 room
- 02 rooms
- 643 rooms
- 934 rooms
- 2665 rooms
- 3196 rooms
- 3987 rooms
- 3918 rooms
- 819+ rooms
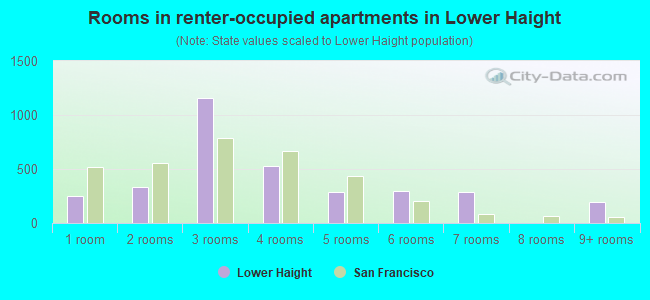
- Rooms in renter-occupied apartments in Lower Haight
- 2531 room
- 3342 rooms
- 1,1573 rooms
- 5284 rooms
- 2855 rooms
- 2946 rooms
- 2917 rooms
- 08 rooms
- 1999+ rooms
Owner-occupied
Renter-occupied
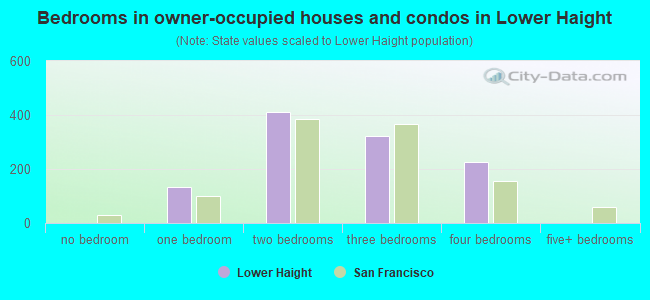
- Bedrooms in owner-occupied houses and condos in Lower Haight
- 0no bedroom
- 1321 bedroom
- 4112 bedrooms
- 3233 bedrooms
- 2254 bedrooms
- 05+ bedrooms
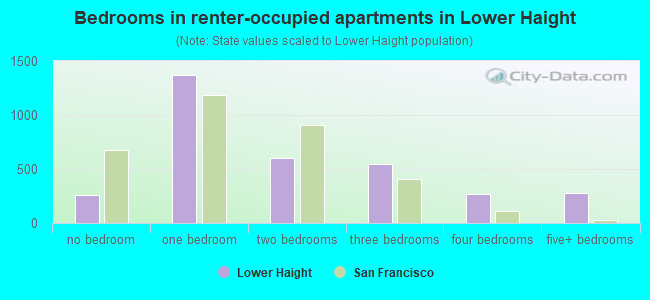
- Bedrooms in renter-occupied apartments in Lower Haight
- 256no bedroom
- 1,3681 bedroom
- 6062 bedrooms
- 5473 bedrooms
- 2724 bedrooms
- 2785+ bedrooms
Average number of cars or other vehicles available in houses/condos:
Average number of cars or other vehicles available in apartments:
| This neighborhood: | 1.1 |
| San Francisco: | 1.5 |
Average number of cars or other vehicles available in apartments:
| Here: | 0.7 |
| city: | 0.8 |
Percentage of units with a mortgage:
| Lower Haight: | 84.2% |
| San Francisco: | 62.3% |
Housing prices:
- Average estimated value of detached houses in 2022 (3.6% of all units):
Lower Haight: $3,314,733 San Francisco: $1,942,973
- Average estimated value of townhouses or other attached units in 2022 (10.4% of all units):
This neighborhood: $2,330,069 city: $1,528,422
- Average estimated value of housing units in 2-unit structures in 2022 (10.9% of all units):
This neighborhood: $3,838,270 San Francisco: $1,536,932
- Average estimated '22 value of housing units in 3-to-4-unit structures (39.4% of all units):
Lower Haight: $1,386,341 city: $1,622,965
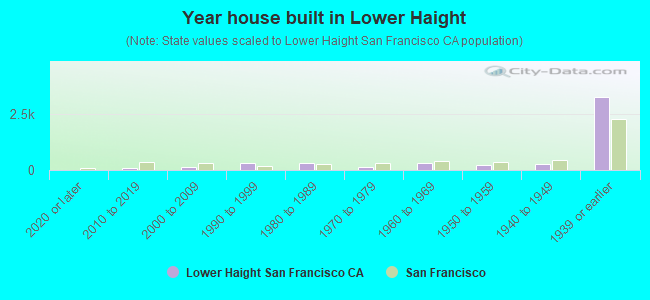
- Year house built in Lower Haight
- 02020 or later
- 832010 to 2019
- 1562000 to 2009
- 2931990 to 1999
- 2981980 to 1989
- 1421970 to 1979
- 3191960 to 1969
- 2471950 to 1959
- 2551940 to 1949
- 3,2671939 or earlier
City-data.com crime index for city in 2020 (higher means more crime):
| City: | 387.4 |
| U.S. average: | 219.5 |
Travel time to work (commute)
![Travel time to work (commute)]()
- 126Less than 5 minutes
- 955 to 9 minutes
- 33410 to 14 minutes
- 27315 to 19 minutes
- 1,10220 to 24 minutes
- 40525 to 29 minutes
- 58230 to 34 minutes
- 8935 to 39 minutes
- 25740 to 44 minutes
- 49645 to 59 minutes
- 37860 to 89 minutes
- 16190 or more minutes

Means of transportation to work
![Means of transportation to work]()
- 18.2%1,290Drove a car alone
- 2.6%181Carpooled
- 12.8%905Bus
- 16.0%1,133Subway or elevated rail
- 1.5%104Long-distance train or commuter rail
- 4.6%327Light rail, streetcar or trolley
- 2.8%199Taxi
- 1.3%90Motorcycle
- 11.0%780Bicycle
- 7.6%537Walked
- 2.4%172Other means
- 26.3%1,863Worked at home

Time leaving home to go to work
![Time leaving home to go to work]()
- 612:00 a.m. to 4:59 a.m.
- 735:30 a.m. to 5:59 a.m.
- 956:00 a.m. to 6:29 a.m.
- 4236:30 a.m. to 6:59 a.m.
- 3567:00 a.m. to 7:29 a.m.
- 7037:30 a.m. to 7:59 a.m.
- 6608:00 a.m. to 8:29 a.m.
- 8098:30 a.m. to 8:59 a.m.
- 5969:00 a.m. to 9:59 a.m.
- 20410:00 a.m. to 10:59 a.m.
- 11711:00 a.m. to 11:59 a.m.
- 15312:00 p.m. to 3:59 p.m.
- 1524:00 p.m. to 11:59 p.m.

Occupations of males:
- Percentage of males in management occupations (except farmers):
Here: 20.2% city: 17.2%
- Percentage of males in business and financial operations occupations:
Here: 15.3% city: 8.9%
- Percentage of males in computer and mathematical occupations:
Here: 22.7% city: 14.6%
- Percentage of males in architecture and engineering occupations:
Here: 2.4% city: 4.0%
- Percentage of males in life, physical, and social science occupations:
Here: 5.9% city: 2.4%
- Percentage of males in community and social services occupations:
Here: 3.1% city: 1.0%
- Percentage of males in arts, design, entertainment, sports, and media occupations:
Here: 4.2% city: 4.9%
- Percentage of males in service occupations:
Here: 4.1% city: 11.8%
- Percentage of males in sales and office occupations:
Here: 6.2% city: 13.5%
- Percentage of males in construction, extraction, and maintenance occupations:
Here: 1.7% city: 3.1%
- Percentage of males in production occupations:
Here: 3.0% city: 2.5%
- Percentage of males in transportation occupations:
Here: 3.2% city: 3.4%
- Percentage of males in material moving occupations:
Here: 3.8% city: 1.8%
Occupations of females:
- Percentage of females in management occupations (except farmers):
Here: 12.9% city: 15.8%
- Percentage of females in business and financial operations occupations:
Here: 19.5% city: 11.5%
- Percentage of females in computer and mathematical occupations:
Here: 8.3% city: 5.1%
- Percentage of females in architecture and engineering occupations:
Here: 8.9% city: 1.6%
- Percentage of females in community and social services occupations:
Here: 1.9% city: 1.6%
- Percentage of females in legal occupations:
Here: 2.2% city: 3.0%
- Percentage of females in education, training, and library occupations:
Here: 1.7% city: 7.1%
- Percentage of females in arts, design, entertainment, sports, and media occupations:
Here: 1.8% city: 5.1%
- Percentage of females in healthcare practitioners and technical occupations:
Here: 10.4% city: 8.4%
- Percentage of females in service occupations:
Here: 2.7% city: 15.4%
- Percentage of females in sales and office occupations:
Here: 25.1% city: 19.3%
- Percentage of females in construction, extraction, and maintenance occupations:
Here: 2.5% city: 0.1%
- Percentage of females in transportation occupations:
Here: 1.9% city: 0.8%
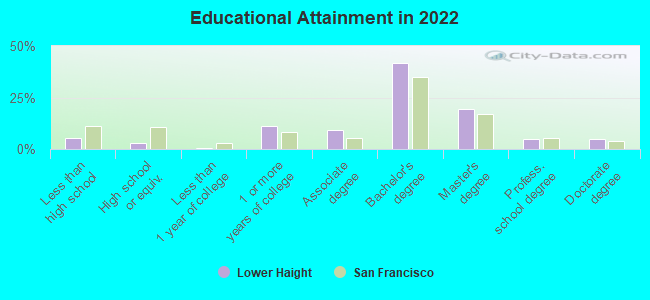
Education in this neighborhood (subdivision or community):
- Percentage of people 3 years and older in K-12 schools:
Lower Haight: 9.5% San Francisco: 9.7%
- Percentage of people 3 years and older in undergraduate colleges:
Lower Haight: 6.4% San Francisco: 4.8%
- Percentage of people 3 years and older in grad. or professional schools:
Lower Haight: 7.7% San Francisco: 2.6%
- Percentage of students K-12 enrolled in private schools:
Lower Haight: 78.1% San Francisco: 36.5%
Percentage of population below poverty level:
| Lower Haight: | 3.6% |
| San Francisco: | 10.4% |
Median year owner moved in (as recorded in 2022):
Median year renter moved in (as recorded in 2022):
| Lower Haight: | 2009 |
| San Francisco: | 2007 |
Median year renter moved in (as recorded in 2022):
| Lower Haight: | 2014 |
| San Francisco: | 2019 |
Percentage of married-couple families with both working:
| Lower Haight: | 98.5% |
| San Francisco: | 75.9% |
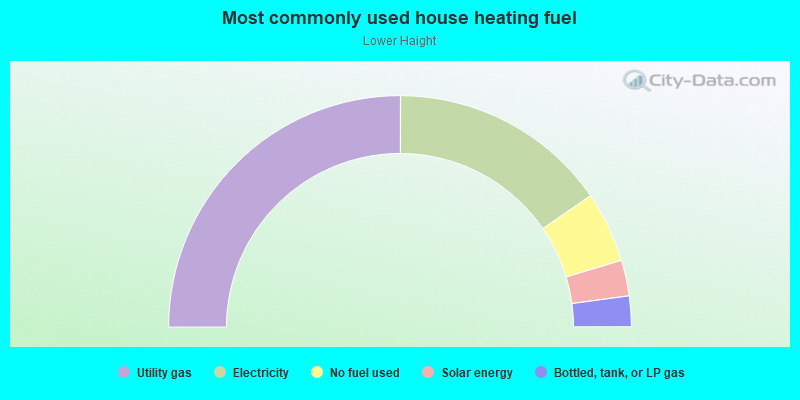
- 50.1%Utility gas
- 30.7%Electricity
- 9.9%No fuel used
- 5.0%Solar energy
- 4.3%Bottled, tank, or LP gas
Roads and streets:
Page St
Length: 1.03 miles
Direction: E-W
Address range: 100 to 999
Direction: E-W
Address range: 100 to 999
Haight St
Length: 1.03 miles
Direction: E-W
Address range: 41 to 899
Direction: E-W
Address range: 41 to 899
Waller St
Length: 0.69 miles
Direction: E-W
Address range: 1 to 699
Direction: E-W
Address range: 1 to 699
Hermann St
Length: 0.46 miles
Direction: E-W
Address range: 1 to 399
Direction: E-W
Address range: 1 to 399
Market St
Length: 0.44 miles
Directions: E-W, N-S, SW-NE
Address range: 1701 to 1899
Directions: E-W, N-S, SW-NE
Address range: 1701 to 1899
Lily St
Length: 0.41 miles
Direction: E-W
Address range: 100 to 499
Direction: E-W
Address range: 100 to 499
Laguna St
Length: 0.25 miles
Directions: N-S, SE-NW
Address range: 1 to 315
Directions: N-S, SE-NW
Address range: 1 to 315
Scott St
Length: 0.23 miles
Direction: N-S
Address range: 1 to 299
Direction: N-S
Address range: 1 to 299
Webster St
Length: 0.23 miles
Direction: N-S
Address range: 46 to 345
Direction: N-S
Address range: 46 to 345
Buchanan St
Length: 0.23 miles
Direction: N-S
Address range: 100 to 421
Direction: N-S
Address range: 100 to 421
Rose St
Length: 0.23 miles
Direction: E-W
Address range: 100 to 299
Direction: E-W
Address range: 100 to 299
Germania St
Length: 0.23 miles
Direction: E-W
Address range: 1 to 199
Direction: E-W
Address range: 1 to 199
Laussat St
Length: 0.23 miles
Direction: E-W
Address range: 1 to 299
Direction: E-W
Address range: 1 to 299
Octavia St
Length: 0.21 miles
Direction: N-S
Address range: 21 to 249
Direction: N-S
Address range: 21 to 249
Pierce St
Length: 0.20 miles
Direction: N-S
Address range: 1 to 299
Direction: N-S
Address range: 1 to 299
Fillmore St
Length: 0.20 miles
Direction: N-S
Address range: 53 to 399
Direction: N-S
Address range: 53 to 399
Steiner St
Length: 0.20 miles
Direction: N-S
Address range: 100 to 399
Direction: N-S
Address range: 100 to 399
Gough St
Length: 0.10 miles
Direction: N-S
Address range: 38 to 128
Direction: N-S
Address range: 38 to 128
Potomac St
Length: 0.07 miles
Direction: N-S
Address range: 1 to 99
Direction: N-S
Address range: 1 to 99
Divisadero St
Length: 0.07 miles
Directions: N-S, SE-NW, SW-NE
Directions: N-S, SE-NW, SW-NE
Carmelita St
Length: 0.06 miles
Direction: N-S
Address range: 1 to 99
Direction: N-S
Address range: 1 to 99
Guerrero St
Length: 0.02 miles
Directions: E-W, N-S
Address range: 1 to 25
Directions: E-W, N-S
Address range: 1 to 25