Kingsbury Heights neighborhood in Livonia, Michigan (MI), 48154 detailed profile
Settings
X


Business Search - 14 Million verified businesses
Area: 0.283 square miles
Population: 1,652
Population density:
| Kingsbury Heights: | 5,830 people per square mile |
| Livonia: | 2,626 people per square mile |

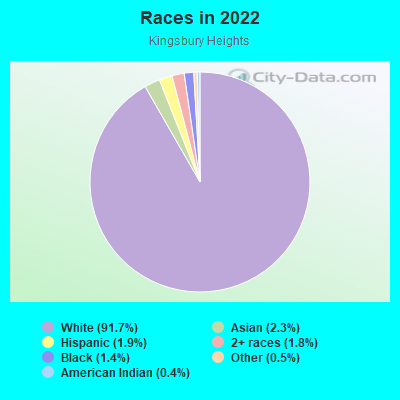
- 1,55191.7%White
- 392.3%Asian
- 321.9%Hispanic or Latino
- 301.8%Two or more races
- 241.4%Black
- 90.5%Some other race
- 70.4%American Indian
Median household income in 2022:
| Kingsbury Heights: | $103,788 |
| Livonia: | $92,125 |
Distribution of median household income
![Distribution of median household income]()
- 17Less than $10,000
- 27$10,000 to $19,999
- 19$20,000 to $29,999
- 44$30,000 to $39,999
- 73$40,000 to $49,999
- 60$50,000 to $59,999
- 26$60,000 to $74,999
- 64$75,000 to $99,999
- 106$100,000 to $124,999
- 34$125,000 to $149,999
- 106$150,000 to $199,999
- 86$200,000 or more

Distribution of owner-occupied house/condo value
![Distribution of owner-occupied house/condo value]()
- 27Less than $50,000
- 27$50,000 to $99,999
- 13$100,000 to $149,999
- 35$150,000 to $199,999
- 53$200,000 to $249,999
- 101$250,000 to $299,999
- 326$300,000 to $399,999
- 77$400,000 to $499,999
- 16$500,000 to $749,999
- 4$750,000 to $999,999
- 21$1,000,000 or more

Distribution of rent paid by renters
![Distribution of rent paid by renters]()
- 2$100 to $199
- 11$200 to $299
- 8$300 to $399
- 14$500 to $599
- 3$600 to $699
- 11$700 to $799
- 7$800 to $899
- 1$900 to $999
- 5$1,000 to $1,249
- 5$1,250 to $1,499
- 1$1,500 to $1,999

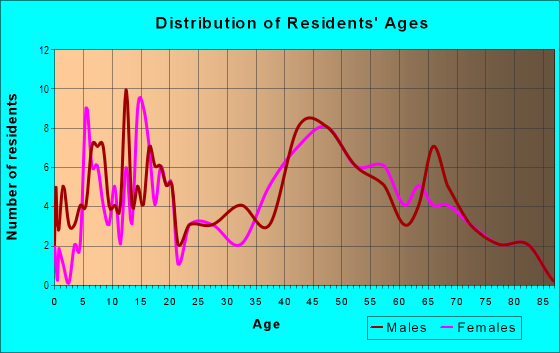
| Males: | 800 |
| Females: | 852 |
Males:
| This neighborhood: | 52.2 years |
| Whole city: | 42.2 years |
| This neighborhood: | 54.7 years |
| Whole city: | 46.5 years |
Average household size:
| Kingsbury Heights: | 11.1 people |
| Livonia: | 2.4 people |
Percentage of family households:
| Kingsbury Heights: | 45.6% |
| Livonia: | 44.1% |
| Here: | 69.5% |
| Livonia: | 50.1% |
Percentage of married-couple families with children (among all households):
| Kingsbury Heights: | 33.7% |
| Livonia: | 33.5% |
Percentage of single-mother households (among all households):
| Kingsbury Heights: | 3.2% |
| Livonia: | 6.6% |
Percentage of never married males 15 years old and over:
Percentage of never married females 15 years old and over:
| Kingsbury Heights: | 11.7% |
| Livonia: | 16.7% |
Percentage of never married females 15 years old and over:
| Kingsbury Heights: | 9.7% |
| city: | 12.0% |
Percentage of people that speak English not well or not at all:
| Kingsbury Heights: | 0.0% |
| Livonia: | 1.4% |
Percentage of people born in this state:
Percentage of people born in another U.S. state:
Percentage of native residents but born outside the U.S.:
Percentage of foreign born residents:
| Here: | 78.3% |
| Livonia: | 78.1% |
Percentage of people born in another U.S. state:
| Kingsbury Heights: | 11.8% |
| Livonia: | 13.0% |
Percentage of native residents but born outside the U.S.:
| Here: | 2.0% |
| city: | 0.4% |
Percentage of foreign born residents:
| Here: | 8.0% |
| Livonia: | 8.4% |
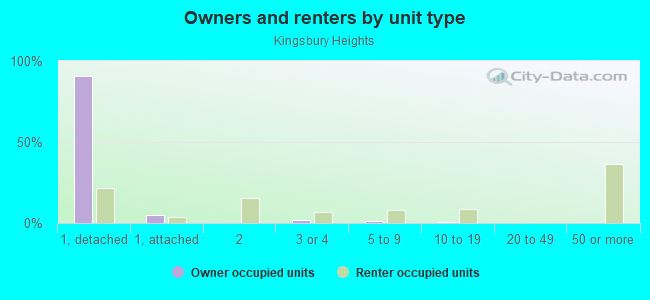
Owner-occupied
Renter-occupied

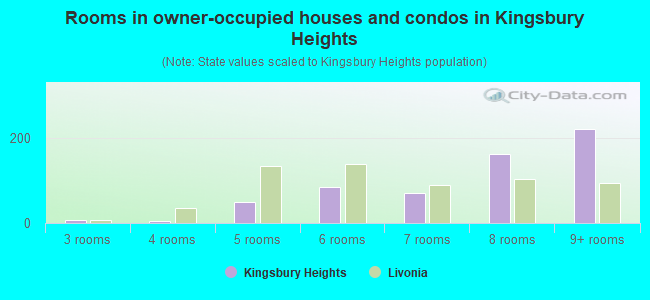
- Rooms in owner-occupied houses and condos in Kingsbury Heights
- 01 room
- 12 rooms
- 73 rooms
- 54 rooms
- 505 rooms
- 846 rooms
- 717 rooms
- 1628 rooms
- 2209+ rooms
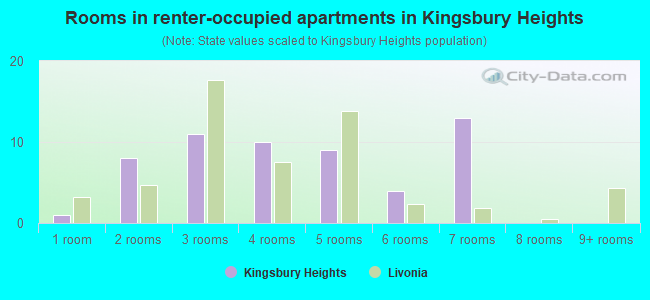
- Rooms in renter-occupied apartments in Kingsbury Heights
- 11 room
- 82 rooms
- 113 rooms
- 104 rooms
- 95 rooms
- 46 rooms
- 137 rooms
- 08 rooms
- 09+ rooms
Owner-occupied
Renter-occupied
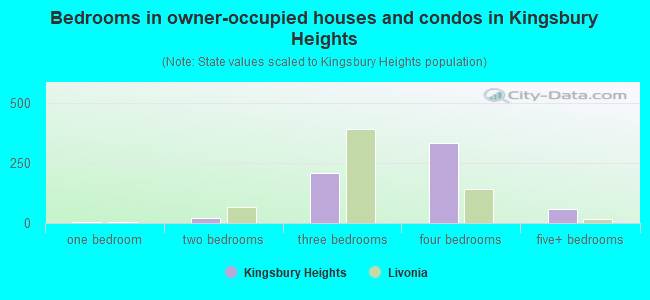
- Bedrooms in owner-occupied houses and condos in Kingsbury Heights
- 0no bedroom
- 31 bedroom
- 222 bedrooms
- 2073 bedrooms
- 3344 bedrooms
- 575+ bedrooms
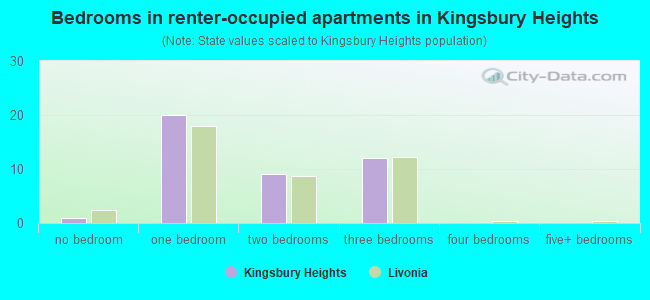
- Bedrooms in renter-occupied apartments in Kingsbury Heights
- 1no bedroom
- 201 bedroom
- 92 bedrooms
- 123 bedrooms
- 04 bedrooms
- 05+ bedrooms
Average number of cars or other vehicles available in houses/condos:
Average number of cars or other vehicles available in apartments:
| This neighborhood: | 1.6 |
| Livonia: | 2.0 |
Average number of cars or other vehicles available in apartments:
| Here: | |
| city: |
Percentage of units with a mortgage:
| Kingsbury Heights: | 56.3% |
| Livonia: | 60.8% |
Average estimated value of detached houses in 2022 (99.2% of all units):
| Kingsbury Heights: | $338,630 |
| Livonia: | $291,361 |

- Year house built in Kingsbury Heights
- 02020 or later
- 12010 to 2019
- 172000 to 2009
- 391990 to 1999
- 741980 to 1989
- 1221970 to 1979
- 3661960 to 1969
- 241950 to 1959
- 141940 to 1949
- 181939 or earlier
City-data.com crime index for city in 2020 (higher means more crime):
| City: | 122.1 |
| U.S. average: | 219.5 |
Travel time to work (commute)
![Travel time to work (commute)]()
- 4Less than 5 minutes
- 325 to 9 minutes
- 3210 to 14 minutes
- 7615 to 19 minutes
- 2220 to 24 minutes
- 2825 to 29 minutes
- 4030 to 34 minutes
- 635 to 39 minutes
- 840 to 44 minutes
- 3345 to 59 minutes
- 1160 to 89 minutes
- 390 or more minutes

Means of transportation to work
![Means of transportation to work]()
- 78.2%517Drove a car alone
- 6.4%42Carpooled
- 0.9%6Bus
- 0.3%2Bicycle
- 0.2%1Other means
- 14.8%98Worked at home

Time leaving home to go to work
![Time leaving home to go to work]()
- 1012:00 a.m. to 4:59 a.m.
- 25:00 a.m. to 5:29 a.m.
- 195:30 a.m. to 5:59 a.m.
- 166:00 a.m. to 6:29 a.m.
- 246:30 a.m. to 6:59 a.m.
- 337:00 a.m. to 7:29 a.m.
- 577:30 a.m. to 7:59 a.m.
- 208:00 a.m. to 8:29 a.m.
- 378:30 a.m. to 8:59 a.m.
- 99:00 a.m. to 9:59 a.m.
- 610:00 a.m. to 10:59 a.m.
- 311:00 a.m. to 11:59 a.m.
- 812:00 p.m. to 3:59 p.m.
- 224:00 p.m. to 11:59 p.m.

Occupations of males:
- Percentage of males in management occupations (except farmers):
Here: 20.3% city: 12.8%
- Percentage of males in business and financial operations occupations:
Here: 8.1% city: 6.2%
- Percentage of males in computer and mathematical occupations:
Here: 3.7% city: 6.7%
- Percentage of males in architecture and engineering occupations:
Here: 14.0% city: 8.4%
- Percentage of males in legal occupations:
Here: 2.6% city: 0.5%
- Percentage of males in arts, design, entertainment, sports, and media occupations:
Here: 3.1% city: 2.5%
- Percentage of males in service occupations:
Here: 13.3% city: 11.5%
- Percentage of males in sales and office occupations:
Here: 14.9% city: 15.7%
- Percentage of males in construction, extraction, and maintenance occupations:
Here: 5.7% city: 7.2%
- Percentage of males in production occupations:
Here: 2.5% city: 8.0%
- Percentage of males in transportation occupations:
Here: 3.6% city: 4.8%
- Percentage of males in material moving occupations:
Here: 1.2% city: 3.4%
Occupations of females:
- Percentage of females in management occupations (except farmers):
Here: 17.9% city: 11.2%
- Percentage of females in business and financial operations occupations:
Here: 8.0% city: 7.4%
- Percentage of females in computer and mathematical occupations:
Here: 1.3% city: 2.4%
- Percentage of females in architecture and engineering occupations:
Here: 2.6% city: 2.2%
- Percentage of females in community and social services occupations:
Here: 7.2% city: 2.5%
- Percentage of females in legal occupations:
Here: 1.4% city: 1.6%
- Percentage of females in education, training, and library occupations:
Here: 8.0% city: 9.0%
- Percentage of females in arts, design, entertainment, sports, and media occupations:
Here: 2.5% city: 2.5%
- Percentage of females in healthcare practitioners and technical occupations:
Here: 6.1% city: 12.3%
- Percentage of females in service occupations:
Here: 16.5% city: 14.3%
- Percentage of females in sales and office occupations:
Here: 22.7% city: 29.2%
- Percentage of females in production occupations:
Here: 5.4% city: 2.1%
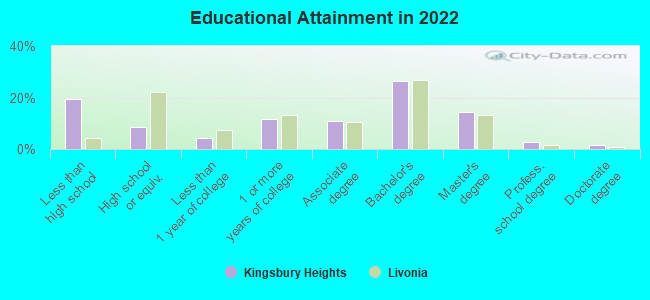
Education in this neighborhood (subdivision or community):
- Percentage of people 3 years and older in K-12 schools:
Kingsbury Heights: 18.3% Livonia: 13.6%
- Percentage of people 3 years and older in undergraduate colleges:
Kingsbury Heights: 4.4% Livonia: 4.0%
- Percentage of people 3 years and older in grad. or professional schools:
Kingsbury Heights: 2.5% Livonia: 1.7%
- Percentage of students K-12 enrolled in private schools:
Kingsbury Heights: 25.7% Livonia: 13.5%
Percentage of population below poverty level:
| Kingsbury Heights: | 1.6% |
| Livonia: | 4.6% |
Median year owner moved in (as recorded in 2022):
| Kingsbury Heights: | 2004 |
| Livonia: | 2008 |
Percentage of married-couple families with both working:
| Kingsbury Heights: | 71.6% |
| Livonia: | 74.3% |
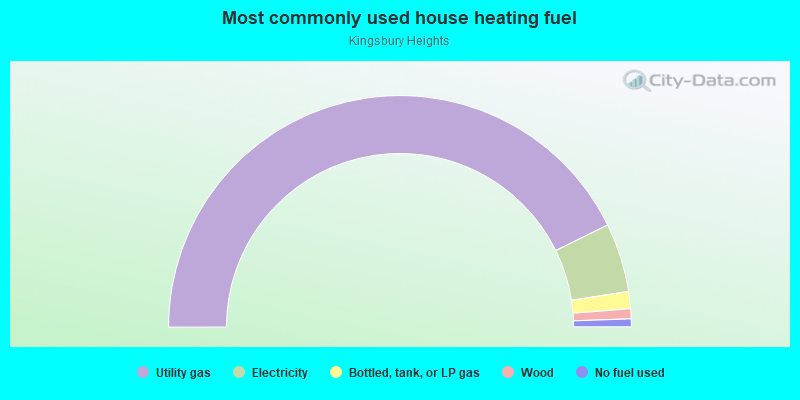
- 85.4%Utility gas
- 9.6%Electricity
- 2.4%Bottled, tank, or LP gas
- 1.4%Wood
- 1.1%No fuel used
Roads and streets:
6 Mile Rd
Length: 0.92 miles
Direction: E-W
Address range: 36400 to 37399
Direction: E-W
Address range: 36400 to 37399
Munger St
Length: 0.60 miles
Directions: E-W, N-S, SE-NW, SW-NE
Address range: 36500 to 37399
Directions: E-W, N-S, SE-NW, SW-NE
Address range: 36500 to 37399
Levan Rd
Length: 0.53 miles
Directions: N-S, SE-NW
Address range: 16062 to 17159
Directions: N-S, SE-NW
Address range: 16062 to 17159
Newburgh Rd
Length: 0.44 miles
Direction: N-S
Address range: 16068 to 17099
Direction: N-S
Address range: 16068 to 17099
Bristol Ct
Length: 0.35 miles
Directions: E-W, SW-NE
Address range: 36793 to 37699
Directions: E-W, SW-NE
Address range: 36793 to 37699
6 Mile Svc Rd
Length: 0.33 miles
Direction: E-W
Direction: E-W
Mallory St
Length: 0.32 miles
Directions: E-W, SW-NE
Address range: 36400 to 36999
Directions: E-W, SW-NE
Address range: 36400 to 36999
Grove St
Length: 0.29 miles
Directions: E-W, SE-NW
Address range: 36400 to 36799
Directions: E-W, SE-NW
Address range: 36400 to 36799
Fitzgerald St
Length: 0.29 miles
Directions: N-S, SE-NW
Address range: 16600 to 17129
Directions: N-S, SE-NW
Address range: 16600 to 17129
Six Mile Rd (6 Mile Svc Rd)
Length: 0.26 miles
Direction: E-W
Direction: E-W
Whitcomb St
Length: 0.17 miles
Directions: E-W, SW-NE
Address range: 36474 to 36725
Directions: E-W, SW-NE
Address range: 36474 to 36725
Comstock St
Length: 0.15 miles
Direction: N-S
Address range: 16600 to 16949
Direction: N-S
Address range: 16600 to 16949
Renwick St
Length: 0.15 miles
Directions: N-S, SW-NE
Address range: 16600 to 16999
Directions: N-S, SW-NE
Address range: 16600 to 16999
Munger Ct
Length: 0.07 miles
Direction: E-W
Address range: 36400 to 36599
Direction: E-W
Address range: 36400 to 36599
Whitcomb
Length: 0.04 miles
Direction: E-W
Address range: 36800 to 36899
Direction: E-W
Address range: 36800 to 36899
Southampton St
Length: 0.01 miles
Direction: E-W
Address range: 37400 to 37445
Direction: E-W
Address range: 37400 to 37445