Hidden Valley neighborhood in Monrovia, California (CA), 91016 detailed profile
Settings
X


Business Search - 14 Million verified businesses
Area: 0.212 square miles
Population: 439
Population density:
| Hidden Valley: | 2,073 people per square mile |
| Monrovia: | 2,739 people per square mile |

- 22451.1%White
- 12027.4%Hispanic or Latino
- 6514.8%Asian
- 173.9%Black
- 122.7%Two or more races

Distribution of median household income
![Distribution of median household income]()
- 2Less than $10,000
- 53$10,000 to $19,999
- 29$20,000 to $29,999
- 8$30,000 to $39,999
- 70$40,000 to $49,999
- 4$50,000 to $59,999
- 7$60,000 to $74,999
- 15$75,000 to $99,999
- 19$100,000 to $124,999
- 21$125,000 to $149,999
- 23$150,000 to $199,999
- 47$200,000 or more

Distribution of owner-occupied house/condo value
![Distribution of owner-occupied house/condo value]()
- 9$100,000 to $149,999
- 1$150,000 to $199,999
- 1$400,000 to $499,999
- 5$500,000 to $749,999
- 37$750,000 to $999,999
- 84$1,000,000 or more

Distribution of rent paid by renters
![Distribution of rent paid by renters]()
- 3$1,000 to $1,249
- 1$1,250 to $1,499
- 4$1,500 to $1,999
- 23$2,000 or more

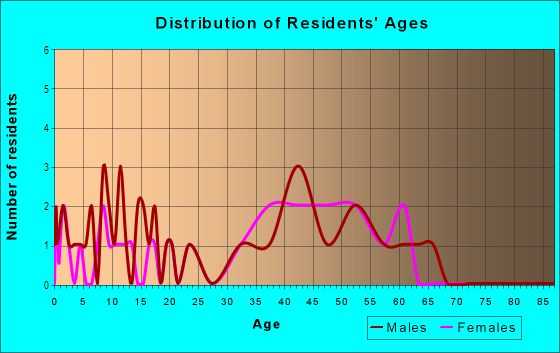
| Males: | 214 |
| Females: | 224 |
Males:
| This neighborhood: | |
| Whole city: |
| This neighborhood: | |
| Whole city: |
Percentage of family households:
| Hidden Valley: | 55.2% |
| Monrovia: | 50.1% |
| Here: | 69.2% |
| Monrovia: | 44.8% |
Percentage of married-couple families with children (among all households):
| Hidden Valley: | 29.4% |
| Monrovia: | 26.4% |
Percentage of single-mother households (among all households):
| Hidden Valley: | 5.5% |
| Monrovia: | 6.7% |
Percentage of never married males 15 years old and over:
Percentage of never married females 15 years old and over:
| Hidden Valley: | 11.3% |
| Monrovia: | 20.0% |
Percentage of never married females 15 years old and over:
| Hidden Valley: | 13.3% |
| city: | 17.2% |
Percentage of people that speak English not well or not at all:
| Hidden Valley: | 1.7% |
| Monrovia: | 4.8% |
Percentage of people born in this state:
Percentage of people born in another U.S. state:
Percentage of native residents but born outside the U.S.:
Percentage of foreign born residents:
| Here: | 60.9% |
| Monrovia: | 60.6% |
Percentage of people born in another U.S. state:
| Hidden Valley: | 20.3% |
| Monrovia: | 13.3% |
Percentage of native residents but born outside the U.S.:
| Here: | 0.6% |
| city: | 0.8% |
Percentage of foreign born residents:
| Here: | 18.3% |
| Monrovia: | 25.2% |

Owner-occupied
Renter-occupied


- Rooms in owner-occupied houses and condos in Hidden Valley
- 01 room
- 02 rooms
- 423 rooms
- 64 rooms
- 175 rooms
- 346 rooms
- 277 rooms
- 168 rooms
- 219+ rooms

- Rooms in renter-occupied apartments in Hidden Valley
- 01 room
- 02 rooms
- 53 rooms
- 54 rooms
- 95 rooms
- 16 rooms
- 07 rooms
- 78 rooms
- 09+ rooms
Owner-occupied
Renter-occupied

- Bedrooms in owner-occupied houses and condos in Hidden Valley
- 0no bedroom
- 141 bedroom
- 142 bedrooms
- 853 bedrooms
- 204 bedrooms
- 45+ bedrooms

- Bedrooms in renter-occupied apartments in Hidden Valley
- 0no bedroom
- 21 bedroom
- 172 bedrooms
- 13 bedrooms
- 74 bedrooms
- 05+ bedrooms
Average number of cars or other vehicles available in houses/condos:
Average number of cars or other vehicles available in apartments:
| This neighborhood: | |
| Monrovia: |
Average number of cars or other vehicles available in apartments:
| Here: | |
| city: |
Percentage of units with a mortgage:
| Hidden Valley: | 59.7% |
| Monrovia: | 65.1% |
Average estimated value of detached houses in 2022 (88.5% of all units):
| Hidden Valley: | $1,222,179 |
| Monrovia: | $952,225 |

- Year house built in Hidden Valley
- 02020 or later
- 02010 to 2019
- 22000 to 2009
- 51990 to 1999
- 221980 to 1989
- 151970 to 1979
- 221960 to 1969
- 421950 to 1959
- 141940 to 1949
- 401939 or earlier

City-data.com crime index for city in 2020 (higher means more crime):
| City: | 183.5 |
| U.S. average: | 219.5 |
Travel time to work (commute)
![Travel time to work (commute)]()
- 4Less than 5 minutes
- 95 to 9 minutes
- 1510 to 14 minutes
- 2015 to 19 minutes
- 1020 to 24 minutes
- 725 to 29 minutes
- 2730 to 34 minutes
- 435 to 39 minutes
- 640 to 44 minutes
- 1545 to 59 minutes
- 760 to 89 minutes
- 1290 or more minutes

Means of transportation to work
![Means of transportation to work]()
- 71.1%150Drove a car alone
- 45.0%95Carpooled
- 0.5%1Bus
- 12.8%27Bicycle
- 0.9%2Other means
- 20.4%43Worked at home

Time leaving home to go to work
![Time leaving home to go to work]()
- 1312:00 a.m. to 4:59 a.m.
- 55:00 a.m. to 5:29 a.m.
- 55:30 a.m. to 5:59 a.m.
- 86:00 a.m. to 6:29 a.m.
- 106:30 a.m. to 6:59 a.m.
- 207:00 a.m. to 7:29 a.m.
- 167:30 a.m. to 7:59 a.m.
- 198:00 a.m. to 8:29 a.m.
- 58:30 a.m. to 8:59 a.m.
- 199:00 a.m. to 9:59 a.m.
- 111:00 a.m. to 11:59 a.m.
- 612:00 p.m. to 3:59 p.m.
- 74:00 p.m. to 11:59 p.m.

Occupations of males:
- Percentage of males in management occupations (except farmers):
Here: 20.9% city: 12.7%
- Percentage of males in business and financial operations occupations:
Here: 3.4% city: 3.1%
- Percentage of males in computer and mathematical occupations:
Here: 3.6% city: 4.5%
- Percentage of males in architecture and engineering occupations:
Here: 9.3% city: 4.8%
- Percentage of males in community and social services occupations:
Here: 2.5% city: 1.4%
- Percentage of males in legal occupations:
Here: 1.5% city: 1.4%
- Percentage of males in education, training, and library occupations:
Here: 4.3% city: 5.1%
- Percentage of males in arts, design, entertainment, sports, and media occupations:
Here: 4.2% city: 4.2%
- Percentage of males in healthcare practitioners and technical occupations:
Here: 5.1% city: 4.5%
- Percentage of males in service occupations:
Here: 12.8% city: 13.0%
- Percentage of males in sales and office occupations:
Here: 17.4% city: 19.9%
- Percentage of males in production occupations:
Here: 8.7% city: 4.8%
- Percentage of males in transportation occupations:
Here: 1.5% city: 4.1%
- Percentage of males in material moving occupations:
Here: 1.1% city: 2.7%
Occupations of females:
- Percentage of females in management occupations (except farmers):
Here: 15.1% city: 13.3%
- Percentage of females in business and financial operations occupations:
Here: 5.9% city: 5.5%
- Percentage of females in computer and mathematical occupations:
Here: 2.2% city: 2.4%
- Percentage of females in life, physical, and social science occupations:
Here: 2.9% city: 1.2%
- Percentage of females in community and social services occupations:
Here: 4.8% city: 4.3%
- Percentage of females in education, training, and library occupations:
Here: 15.9% city: 11.6%
- Percentage of females in arts, design, entertainment, sports, and media occupations:
Here: 4.1% city: 4.0%
- Percentage of females in healthcare practitioners and technical occupations:
Here: 14.0% city: 9.7%
- Percentage of females in service occupations:
Here: 5.1% city: 16.1%
- Percentage of females in sales and office occupations:
Here: 27.7% city: 26.0%
Percentage of people 16-64 in Armed Forces:
| Hidden Valley: | 0.1% |
| Monrovia: | 0.1% |
Education in this neighborhood (subdivision or community):
- Percentage of people 3 years and older in K-12 schools:
Hidden Valley: 21.0% Monrovia: 16.9%
- Percentage of people 3 years and older in undergraduate colleges:
Hidden Valley: 4.6% Monrovia: 5.6%
- Percentage of people 3 years and older in grad. or professional schools:
Hidden Valley: 2.8% Monrovia: 2.0%
- Percentage of students K-12 enrolled in private schools:
Hidden Valley: 19.8% Monrovia: 10.9%
Percentage of population below poverty level:
| Hidden Valley: | 6.3% |
| Monrovia: | 10.1% |
Percentage of married-couple families with both working:
| Hidden Valley: | 99.3% |
| Monrovia: | 64.0% |

- 80.4%Utility gas
- 8.8%Electricity
- 5.5%Solar energy
- 3.7%Bottled, tank, or LP gas
- 1.7%No fuel used
Roads and streets:
N Alta Vista Ave
Length: 0.76 miles
Directions: E-W, N-S, SE-NW, SW-NE
Address range: 448 to 599
Directions: E-W, N-S, SE-NW, SW-NE
Address range: 448 to 599
Hidden Valley Ave
Length: 0.53 miles
Directions: E-W, N-S, SE-NW, SW-NE
Address range: 1 to 58
Directions: E-W, N-S, SE-NW, SW-NE
Address range: 1 to 58
Cloverleaf Dr
Length: 0.17 miles
Directions: E-W, N-S, SE-NW, SW-NE
Address range: 500 to 519
Directions: E-W, N-S, SE-NW, SW-NE
Address range: 500 to 519
Oak Grove
Length: 0.15 miles
Directions: E-W, N-S, SE-NW, SW-NE
Address range: 100 to 199
Directions: E-W, N-S, SE-NW, SW-NE
Address range: 100 to 199
Chateau Ct
Length: 0.11 miles
Direction: E-W
Direction: E-W
Sutter Creek
Length: 0.10 miles
Directions: N-S, SE-NW, SW-NE
Address range: 100 to 199
Directions: N-S, SE-NW, SW-NE
Address range: 100 to 199
Chateau Crst
Length: 0.09 miles
Directions: E-W, N-S, SW-NE
Directions: E-W, N-S, SW-NE
Patrician Way
Length: 0.09 miles
Directions: E-W, N-S, SW-NE
Address range: 400 to 499
Directions: E-W, N-S, SW-NE
Address range: 400 to 499
N Myrtle Ave
Length: 0.09 miles
Direction: SE-NW
Address range: 546 to 599
Direction: SE-NW
Address range: 546 to 599
James Town
Length: 0.09 miles
Directions: E-W, SW-NE
Address range: 100 to 199
Directions: E-W, SW-NE
Address range: 100 to 199
Lotone St
Length: 0.07 miles
Directions: E-W, N-S, SE-NW, SW-NE
Address range: 400 to 499
Directions: E-W, N-S, SE-NW, SW-NE
Address range: 400 to 499
Sky Way
Length: 0.07 miles
Directions: E-W, SW-NE
Address range: 100 to 199
Directions: E-W, SW-NE
Address range: 100 to 199
Mill Run
Length: 0.07 miles
Directions: E-W, SW-NE
Address range: 100 to 199
Directions: E-W, SW-NE
Address range: 100 to 199
N Primrose Ave
Length: 0.05 miles
Direction: SE-NW
Address range: 526 to 550
Direction: SE-NW
Address range: 526 to 550
Mesa Cir
Length: 0.03 miles
Directions: E-W, SE-NW
Address range: 400 to 599
Directions: E-W, SE-NW
Address range: 400 to 599