Farallon neighborhood in Belmont, Aghnajane, California (CA), 94002 detailed profile
Settings
X


Business Search - 14 Million verified businesses
Area: 0.207 square miles
Population: 668
Population density:
| Farallon: | 3,228 people per square mile |
| Belmont: | 6,147 people per square mile |

- 23434.1%White
- 18627.1%Asian
- 18426.8%Hispanic or Latino
- 365.2%Two or more races
- 202.9%Native Hawaiian and Other
Pacific Islander - 192.8%Black
- 71.0%Some other race

Distribution of median household income
![Distribution of median household income]()
- 11Less than $10,000
- 24$10,000 to $19,999
- 13$20,000 to $29,999
- 17$30,000 to $39,999
- 8$40,000 to $49,999
- 25$50,000 to $59,999
- 6$60,000 to $74,999
- 19$75,000 to $99,999
- 47$100,000 to $124,999
- 17$125,000 to $149,999
- 23$150,000 to $199,999
- 99$200,000 or more

Distribution of owner-occupied house/condo value
![Distribution of owner-occupied house/condo value]()
- 2Less than $50,000
- 4$50,000 to $99,999
- 1$100,000 to $149,999
- 2$200,000 to $249,999
- 3$300,000 to $399,999
- 9$400,000 to $499,999
- 9$500,000 to $749,999
- 26$750,000 to $999,999
- 89$1,000,000 or more

Distribution of rent paid by renters
![Distribution of rent paid by renters]()
- 22$300 to $399
- 4$400 to $499
- 2$600 to $699
- 13$800 to $899
- 22$1,000 to $1,249
- 14$1,250 to $1,499
- 5$1,500 to $1,999
- 109$2,000 or more

Median rent in 2022:
| Farallon: | $2,791 |
| Belmont: | $2,001 |
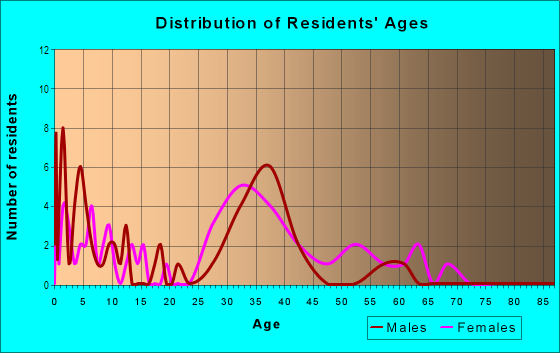
| Males: | 346 |
| Females: | 322 |
Males:
| This neighborhood: | 40.2 years |
| Whole city: | 40.1 years |
| This neighborhood: | 40.9 years |
| Whole city: | 41.5 years |
Average household size:
| Farallon: | 2.6 people |
| Belmont: | 2.5 people |
Percentage of family households:
| Farallon: | 61.0% |
| Belmont: | 53.9% |
| Here: | 48.2% |
| Belmont: | 60.1% |
Percentage of married-couple families with children (among all households):
| Farallon: | 28.7% |
| Belmont: | 34.5% |
Percentage of single-mother households (among all households):
| Farallon: | 4.6% |
| Belmont: | 3.1% |
Percentage of never married males 15 years old and over:
Percentage of never married females 15 years old and over:
| Farallon: | 22.1% |
| Belmont: | 15.9% |
Percentage of never married females 15 years old and over:
| Farallon: | 17.5% |
| city: | 13.0% |
Percentage of people that speak English not well or not at all:
| Farallon: | 4.2% |
| Belmont: | 2.5% |
Percentage of people born in this state:
Percentage of people born in another U.S. state:
Percentage of native residents but born outside the U.S.:
Percentage of foreign born residents:
| Here: | 42.4% |
| Belmont: | 49.1% |
Percentage of people born in another U.S. state:
| Farallon: | 17.1% |
| Belmont: | 19.5% |
Percentage of native residents but born outside the U.S.:
| Here: | 1.5% |
| city: | 1.7% |
Percentage of foreign born residents:
| Here: | 39.0% |
| Belmont: | 29.7% |

Owner-occupied
Renter-occupied


- Rooms in owner-occupied houses and condos in Farallon
- 01 room
- 02 rooms
- 63 rooms
- 394 rooms
- 165 rooms
- 156 rooms
- 187 rooms
- 78 rooms
- 39+ rooms

- Rooms in renter-occupied apartments in Farallon
- 191 room
- 42 rooms
- 103 rooms
- 504 rooms
- 415 rooms
- 156 rooms
- 187 rooms
- 18 rooms
- 29+ rooms
Owner-occupied
Renter-occupied

- Bedrooms in owner-occupied houses and condos in Farallon
- 0no bedroom
- 121 bedroom
- 162 bedrooms
- 633 bedrooms
- 194 bedrooms
- 105+ bedrooms

- Bedrooms in renter-occupied apartments in Farallon
- 19no bedroom
- 51 bedroom
- 692 bedrooms
- 453 bedrooms
- 54 bedrooms
- 25+ bedrooms
Average number of cars or other vehicles available in houses/condos:
Average number of cars or other vehicles available in apartments:
| This neighborhood: | 2.1 |
| Belmont: | 2.2 |
Average number of cars or other vehicles available in apartments:
| Here: | 1.4 |
| city: | 1.4 |
Percentage of units with a mortgage:
| Farallon: | 63.1% |
| Belmont: | 71.5% |
Housing prices:
- Average estimated value of detached houses in 2022 (48.5% of all units):
Farallon: $1,649,726 California: $988,808
- Average estimated value of townhouses or other attached units in 2022 (23.4% of all units):
This neighborhood: $1,090,036 California: $838,546

- Year house built in Farallon
- 02020 or later
- 32010 to 2019
- 32000 to 2009
- 1021990 to 1999
- 201980 to 1989
- 91970 to 1979
- 221960 to 1969
- 311950 to 1959
- 601940 to 1949
- 71939 or earlier

City-data.com crime index for city in 2020 (higher means more crime):
| City: | 138.7 |
| U.S. average: | 219.5 |
Travel time to work (commute)
![Travel time to work (commute)]()
- 4Less than 5 minutes
- 95 to 9 minutes
- 3310 to 14 minutes
- 4115 to 19 minutes
- 2120 to 24 minutes
- 1125 to 29 minutes
- 2030 to 34 minutes
- 2135 to 39 minutes
- 1140 to 44 minutes
- 1745 to 59 minutes
- 1760 to 89 minutes
- 890 or more minutes

Means of transportation to work
![Means of transportation to work]()
- 54.0%195Drove a car alone
- 6.9%25Carpooled
- 5.0%18Bus
- 3.6%13Subway or elevated rail
- 4.7%17Long-distance train or commuter rail
- 0.6%2Light rail, streetcar or trolley
- 15.8%57Taxi
- 0.6%2Bicycle
- 6.1%22Walked
- 1.1%4Other means
- 28.8%104Worked at home

Time leaving home to go to work
![Time leaving home to go to work]()
- 212:00 a.m. to 4:59 a.m.
- 45:00 a.m. to 5:29 a.m.
- 15:30 a.m. to 5:59 a.m.
- 136:00 a.m. to 6:29 a.m.
- 146:30 a.m. to 6:59 a.m.
- 167:00 a.m. to 7:29 a.m.
- 217:30 a.m. to 7:59 a.m.
- 538:00 a.m. to 8:29 a.m.
- 218:30 a.m. to 8:59 a.m.
- 349:00 a.m. to 9:59 a.m.
- 1410:00 a.m. to 10:59 a.m.
- 211:00 a.m. to 11:59 a.m.
- 1312:00 p.m. to 3:59 p.m.
- 64:00 p.m. to 11:59 p.m.

Occupations of males:
- Percentage of males in management occupations (except farmers):
Here: 10.9% city: 22.2%
- Percentage of males in business and financial operations occupations:
Here: 16.2% city: 7.5%
- Percentage of males in computer and mathematical occupations:
Here: 8.5% city: 18.4%
- Percentage of males in architecture and engineering occupations:
Here: 3.7% city: 9.3%
- Percentage of males in community and social services occupations:
Here: 1.8% city: 0.9%
- Percentage of males in education, training, and library occupations:
Here: 6.7% city: 3.7%
- Percentage of males in arts, design, entertainment, sports, and media occupations:
Here: 15.6% city: 2.3%
- Percentage of males in healthcare practitioners and technical occupations:
Here: 1.7% city: 2.8%
- Percentage of males in service occupations:
Here: 15.7% city: 8.1%
- Percentage of males in sales and office occupations:
Here: 14.6% city: 7.4%
- Percentage of males in farming, fishing, and forestry occupations:
Here: 4.9% city: 0.2%
Occupations of females:
- Percentage of females in management occupations (except farmers):
Here: 24.0% city: 21.7%
- Percentage of females in business and financial operations occupations:
Here: 2.3% city: 10.5%
- Percentage of females in life, physical, and social science occupations:
Here: 6.1% city: 4.4%
- Percentage of females in community and social services occupations:
Here: 3.0% city: 1.1%
- Percentage of females in legal occupations:
Here: 4.3% city: 1.3%
- Percentage of females in education, training, and library occupations:
Here: 1.0% city: 8.2%
- Percentage of females in arts, design, entertainment, sports, and media occupations:
Here: 2.0% city: 7.9%
- Percentage of females in healthcare practitioners and technical occupations:
Here: 10.6% city: 7.1%
- Percentage of females in service occupations:
Here: 17.2% city: 8.5%
- Percentage of females in sales and office occupations:
Here: 19.9% city: 17.0%
- Percentage of females in material moving occupations:
Here: 4.3% city: 0.2%
Education in this neighborhood (subdivision or community):
- Percentage of people 3 years and older in K-12 schools:
Farallon: 23.9% Belmont: 17.9%
- Percentage of people 3 years and older in undergraduate colleges:
Farallon: 3.6% Belmont: 5.0%
- Percentage of people 3 years and older in grad. or professional schools:
Farallon: 1.4% Belmont: 1.3%
- Percentage of students K-12 enrolled in private schools:
Farallon: 35.9% Belmont: 9.7%
Percentage of population below poverty level:
| Farallon: | 11.6% |
| Belmont: | 6.9% |
Median year owner moved in (as recorded in 2022):
Median year renter moved in (as recorded in 2022):
| Farallon: | 2007 |
| Belmont: | 2005 |
Median year renter moved in (as recorded in 2022):
| Farallon: | 2017 |
| Belmont: | 2017 |
Percentage of married-couple families with both working:
| Farallon: | 71.7% |
| Belmont: | 73.7% |

- 44.0%Utility gas
- 43.6%Electricity
- 5.7%No fuel used
- 2.6%Bottled, tank, or LP gas
- 2.2%Wood
- 1.1%Solar energy
- 0.8%Other fuel
Roads and streets:
Clipper Dr
Length: 0.34 miles
Directions: E-W, N-S, SE-NW, SW-NE
Address range: 100 to 199
Directions: E-W, N-S, SE-NW, SW-NE
Address range: 100 to 199
Island Pkwy
Length: 0.34 miles
Directions: E-W, N-S, SE-NW
Address range: 300 to 799
Directions: E-W, N-S, SE-NW
Address range: 300 to 799
Concourse Pl
Length: 0.31 miles
Direction: E-W
Address range: 200 to 499
Direction: E-W
Address range: 200 to 499
Northampton Ln
Length: 0.22 miles
Directions: E-W, N-S, SE-NW, SW-NE
Address range: 100 to 199
Directions: E-W, N-S, SE-NW, SW-NE
Address range: 100 to 199
Farallon Dr
Length: 0.20 miles
Directions: E-W, N-S, SW-NE
Address range: 100 to 199
Directions: E-W, N-S, SW-NE
Address range: 100 to 199
Sem Ln
Length: 0.14 miles
Direction: SW-NE
Address range: 100 to 199
Direction: SW-NE
Address range: 100 to 199
Frog Valley Ln
Length: 0.14 miles
Directions: E-W, SE-NW
Address range: 100 to 199
Directions: E-W, SE-NW
Address range: 100 to 199
Sotocastle Ln (Oral B, Soto Castle Ln)
Length: 0.12 miles
Direction: E-W
Address range: 100 to 199
Direction: E-W
Address range: 100 to 199
Twin Dolphin Dr
Length: 0.11 miles
Direction: SE-NW
Address range: 100 to 221
Direction: SE-NW
Address range: 100 to 221
Newcastle Ln
Length: 0.10 miles
Direction: E-W
Address range: 100 to 199
Direction: E-W
Address range: 100 to 199
Treasure Island Dr
Length: 0.10 miles
Directions: E-W, N-S
Address range: 299 to 399
Directions: E-W, N-S
Address range: 299 to 399
Manchester Ln
Length: 0.08 miles
Directions: E-W, N-S
Address range: 100 to 199
Directions: E-W, N-S
Address range: 100 to 199
Factory (London Ln)
Length: 0.06 miles
Direction: E-W
Address range: 100 to 199
Direction: E-W
Address range: 100 to 199
Clipper Ct
Length: 0.05 miles
Direction: E-W
Direction: E-W
Castle Ln
Length: 0.04 miles
Directions: E-W, SW-NE
Directions: E-W, SW-NE
London Ln
Length: 0.03 miles
Direction: E-W
Direction: E-W
Farallon Ct
Length: 0.01 miles
Direction: SE-NW
Direction: SE-NW