Fairway Park neighborhood in Pacifica, California (CA), 94066, 94044 detailed profile
Settings
X


Business Search - 14 Million verified businesses
Area: 1.471 square miles
Population: 363
Population density:
| Fairway Park: | 247 people per square mile |
| Pacifica: | 3,012 people per square mile |

- 15743.6%White
- 9025.0%Asian
- 4713.1%Two or more races
- 4612.8%Hispanic or Latino
- 133.6%Black
- 61.7%Native Hawaiian and Other
Pacific Islander - 10.3%Some other race

Median household income in 2022:
| Fairway Park: | $168,293 |
| Pacifica: | $151,849 |
Distribution of median household income
![Distribution of median household income]()
- 2Less than $10,000
- 10$10,000 to $19,999
- 30$20,000 to $29,999
- 53$30,000 to $39,999
- 891$40,000 to $49,999
- 7$50,000 to $59,999
- 9$60,000 to $74,999
- 16$75,000 to $99,999
- 9$100,000 to $124,999
- 11$125,000 to $149,999
- 13$150,000 to $199,999
- 57$200,000 or more

Distribution of owner-occupied house/condo value
![Distribution of owner-occupied house/condo value]()
- 109Less than $50,000
- 8$100,000 to $149,999
- 31$300,000 to $399,999
- 1$400,000 to $499,999
- 754$500,000 to $749,999
- 15$750,000 to $999,999
- 71$1,000,000 or more

Distribution of rent paid by renters
![Distribution of rent paid by renters]()
- 37$200 to $299
- 10$300 to $399
- 19$400 to $499
- 22$500 to $599
- 1$1,250 to $1,499
- 1,208$1,500 to $1,999
- 298$2,000 or more

Median rent in 2022:
| Fairway Park: | $3,040 |
| Pacifica: | $2,001 |
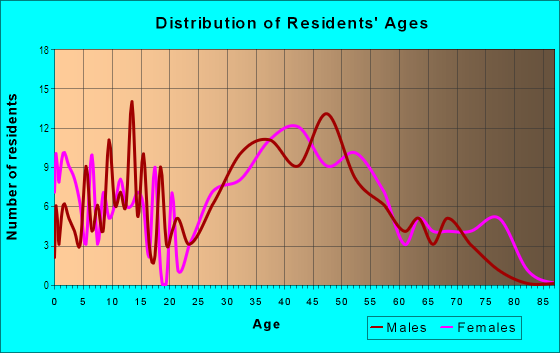
| Males: | 197 |
| Females: | 165 |
Males:
| This neighborhood: | 41.7 years |
| Whole city: | 42.2 years |
| This neighborhood: | 44.8 years |
| Whole city: | 44.6 years |
Average household size:
| Fairway Park: | 7.4 people |
| Pacifica: | 2.7 people |
Percentage of family households:
| Fairway Park: | 42.0% |
| Pacifica: | 45.8% |
| Here: | 58.5% |
| Pacifica: | 55.6% |
Percentage of married-couple families with children (among all households):
| Fairway Park: | 30.7% |
| Pacifica: | 30.5% |
Percentage of single-mother households (among all households):
| Fairway Park: | 6.1% |
| Pacifica: | 4.0% |
Percentage of never married males 15 years old and over:
Percentage of never married females 15 years old and over:
| Fairway Park: | 14.9% |
| Pacifica: | 18.0% |
Percentage of never married females 15 years old and over:
| Fairway Park: | 11.9% |
| city: | 13.5% |
Percentage of people that speak English not well or not at all:
| Fairway Park: | 6.1% |
| Pacifica: | 2.3% |
Percentage of people born in this state:
Percentage of people born in another U.S. state:
Percentage of native residents but born outside the U.S.:
Percentage of foreign born residents:
| Here: | 57.9% |
| Pacifica: | 58.3% |
Percentage of people born in another U.S. state:
| Fairway Park: | 18.1% |
| Pacifica: | 17.9% |
Percentage of native residents but born outside the U.S.:
| Here: | 1.9% |
| city: | 1.9% |
Percentage of foreign born residents:
| Here: | 22.1% |
| Pacifica: | 21.9% |

Owner-occupied
Renter-occupied


- Rooms in owner-occupied houses and condos in Fairway Park
- 01 room
- 02 rooms
- 73 rooms
- 94 rooms
- 155 rooms
- 196 rooms
- 137 rooms
- 168 rooms
- 89+ rooms

- Rooms in renter-occupied apartments in Fairway Park
- 1761 room
- 1412 rooms
- 4783 rooms
- 4644 rooms
- 95 rooms
- 56 rooms
- 1407 rooms
- 18 rooms
- 139+ rooms
Owner-occupied
Renter-occupied

- Bedrooms in owner-occupied houses and condos in Fairway Park
- 0no bedroom
- 51 bedroom
- 82 bedrooms
- 463 bedrooms
- 224 bedrooms
- 75+ bedrooms

- Bedrooms in renter-occupied apartments in Fairway Park
- 176no bedroom
- 6331 bedroom
- 142 bedrooms
- 113 bedrooms
- 174 bedrooms
- 15+ bedrooms
Average number of cars or other vehicles available in houses/condos:
Average number of cars or other vehicles available in apartments:
| This neighborhood: | 2.1 |
| Pacifica: | 2.4 |
Average number of cars or other vehicles available in apartments:
| Here: | 0.8 |
| city: | 1.7 |
Percentage of units with a mortgage:
| Fairway Park: | 61.2% |
| Pacifica: | 69.8% |
Housing prices:
- Average estimated value of detached houses in 2022 (62.8% of all units):
Fairway Park: $1,341,693 California: $988,808
- Average estimated value of townhouses or other attached units in 2022 (7.3% of all units):
This neighborhood: $1,123,631 California: $838,546

- Year house built in Fairway Park
- 02020 or later
- 72010 to 2019
- 112000 to 2009
- 181990 to 1999
- 41980 to 1989
- 201970 to 1979
- 171960 to 1969
- 511950 to 1959
- 31940 to 1949
- 771939 or earlier

City-data.com crime index for city in 2020 (higher means more crime):
| City: | 150.9 |
| U.S. average: | 219.5 |
Travel time to work (commute)
![Travel time to work (commute)]()
- 12Less than 5 minutes
- 305 to 9 minutes
- 1810 to 14 minutes
- 1715 to 19 minutes
- 3220 to 24 minutes
- 4430 to 34 minutes
- 235 to 39 minutes
- 1140 to 44 minutes
- 1345 to 59 minutes
- 1260 to 89 minutes
- 190 or more minutes

Means of transportation to work
![Means of transportation to work]()
- 67.0%138Drove a car alone
- 2.9%6Carpooled
- 0.5%1Bus
- 13.6%28Subway or elevated rail
- 1.5%3Long-distance train or commuter rail
- 0.5%1Light rail, streetcar or trolley
- 6.8%14Taxi
- 68.0%140Motorcycle
- 10.2%21Walked
- 1.5%3Other means
- 15.5%32Worked at home

Time leaving home to go to work
![Time leaving home to go to work]()
- 812:00 a.m. to 4:59 a.m.
- 35:00 a.m. to 5:29 a.m.
- 25:30 a.m. to 5:59 a.m.
- 266:00 a.m. to 6:29 a.m.
- 216:30 a.m. to 6:59 a.m.
- 177:00 a.m. to 7:29 a.m.
- 187:30 a.m. to 7:59 a.m.
- 228:00 a.m. to 8:29 a.m.
- 198:30 a.m. to 8:59 a.m.
- 209:00 a.m. to 9:59 a.m.
- 1510:00 a.m. to 10:59 a.m.
- 411:00 a.m. to 11:59 a.m.
- 712:00 p.m. to 3:59 p.m.
- 74:00 p.m. to 11:59 p.m.

Occupations of males:
- Percentage of males in management occupations (except farmers):
Here: 8.0% city: 14.5%
- Percentage of males in business and financial operations occupations:
Here: 1.4% city: 5.0%
- Percentage of males in computer and mathematical occupations:
Here: 14.6% city: 8.8%
- Percentage of males in architecture and engineering occupations:
Here: 1.7% city: 4.6%
- Percentage of males in community and social services occupations:
Here: 1.0% city: 0.6%
- Percentage of males in education, training, and library occupations:
Here: 3.9% city: 3.6%
- Percentage of males in arts, design, entertainment, sports, and media occupations:
Here: 5.6% city: 3.3%
- Percentage of males in healthcare practitioners and technical occupations:
Here: 2.0% city: 3.5%
- Percentage of males in service occupations:
Here: 22.4% city: 12.5%
- Percentage of males in sales and office occupations:
Here: 23.9% city: 14.8%
- Percentage of males in construction, extraction, and maintenance occupations:
Here: 2.1% city: 7.7%
- Percentage of males in production occupations:
Here: 4.5% city: 4.4%
- Percentage of males in transportation occupations:
Here: 8.1% city: 8.0%
Occupations of females:
- Percentage of females in management occupations (except farmers):
Here: 11.3% city: 13.8%
- Percentage of females in business and financial operations occupations:
Here: 4.0% city: 7.1%
- Percentage of females in architecture and engineering occupations:
Here: 1.4% city: 2.1%
- Percentage of females in community and social services occupations:
Here: 2.8% city: 3.2%
- Percentage of females in education, training, and library occupations:
Here: 25.7% city: 10.7%
- Percentage of females in arts, design, entertainment, sports, and media occupations:
Here: 3.5% city: 4.6%
- Percentage of females in healthcare practitioners and technical occupations:
Here: 9.2% city: 10.8%
- Percentage of females in service occupations:
Here: 12.1% city: 15.1%
- Percentage of females in sales and office occupations:
Here: 17.1% city: 21.8%
- Percentage of females in production occupations:
Here: 8.5% city: 1.4%
- Percentage of females in material moving occupations:
Here: 3.1% city: 1.1%
Percentage of people 16-64 in Armed Forces:
| Fairway Park: | 0.0% |
| Pacifica: | 0.1% |
Education in this neighborhood (subdivision or community):
- Percentage of people 3 years and older in K-12 schools:
Fairway Park: 24.4% Pacifica: 14.7%
- Percentage of people 3 years and older in undergraduate colleges:
Fairway Park: 3.1% Pacifica: 5.6%
- Percentage of people 3 years and older in grad. or professional schools:
Fairway Park: 1.4% Pacifica: 1.1%
- Percentage of students K-12 enrolled in private schools:
Fairway Park: 279.1% Pacifica: 16.2%
Percentage of population below poverty level:
| Fairway Park: | 5.1% |
| Pacifica: | 5.6% |
Percentage of married-couple families with both working:
| Fairway Park: | 1360.0% |
| Pacifica: | 76.9% |

- 73.5%Utility gas
- 17.7%Electricity
- 3.2%Solar energy
- 2.5%No fuel used
- 1.9%Wood
- 1.2%Bottled, tank, or LP gas
Highways in this neighborhood:
Cabrillo Hwy (Coast Hwy, State Hwy 1)
Length: 0.77 miles
Directions: E-W, N-S, SE-NW
Address range: 2000 to 2002
Directions: E-W, N-S, SE-NW
Address range: 2000 to 2002
Roads and streets:
Sharp Park Rd
Length: 1.39 miles
Directions: E-W, N-S, SE-NW, SW-NE
Address range: 601 to 657
Directions: E-W, N-S, SE-NW, SW-NE
Address range: 601 to 657
Moris Point Rd
Length: 0.87 miles
Directions: E-W, SE-NW
Directions: E-W, SE-NW
Bradford Way
Length: 0.61 miles
Directions: E-W, N-S, SE-NW, SW-NE
Address range: 700 to 799
Directions: E-W, N-S, SE-NW, SW-NE
Address range: 700 to 799
Lundy Way
Length: 0.56 miles
Directions: E-W, N-S, SE-NW, SW-NE
Address range: 700 to 799
Directions: E-W, N-S, SE-NW, SW-NE
Address range: 700 to 799
Seaside Dr
Length: 0.46 miles
Directions: E-W, N-S, SE-NW
Address range: 200 to 399
Directions: E-W, N-S, SE-NW
Address range: 200 to 399
Fairway Dr
Length: 0.40 miles
Direction: E-W
Address range: 200 to 399
Direction: E-W
Address range: 200 to 399
Outlook Cir
Length: 0.33 miles
Directions: E-W, N-S, SE-NW, SW-NE
Address range: 1 to 199
Directions: E-W, N-S, SE-NW, SW-NE
Address range: 1 to 199
State Hwy 1
Length: 0.27 miles
Directions: E-W, N-S, SE-NW
Directions: E-W, N-S, SE-NW
Ridgeway Dr
Length: 0.27 miles
Direction: E-W
Address range: 500 to 599
Direction: E-W
Address range: 500 to 599
Greenway Dr
Length: 0.25 miles
Directions: E-W, N-S, SE-NW
Address range: 200 to 399
Directions: E-W, N-S, SE-NW
Address range: 200 to 399
Ysabel Dr
Length: 0.22 miles
Directions: E-W, N-S, SE-NW
Address range: 3600 to 3898
Directions: E-W, N-S, SE-NW
Address range: 3600 to 3898
College Rd
Length: 0.21 miles
Directions: N-S, SE-NW
Directions: N-S, SE-NW
College Dr
Length: 0.18 miles
Directions: E-W, SE-NW
Directions: E-W, SE-NW
Arleen Way
Length: 0.13 miles
Direction: N-S
Address range: 700 to 799
Direction: N-S
Address range: 700 to 799
Cindy Way
Length: 0.13 miles
Directions: N-S, SW-NE
Address range: 700 to 799
Directions: N-S, SW-NE
Address range: 700 to 799
Cullen Rd (Cullen Dr)
Length: 0.11 miles
Direction: E-W
Address range: 400 to 499
Direction: E-W
Address range: 400 to 499
Outlook Dr
Length: 0.11 miles
Direction: E-W
Address range: 135 to 143
Direction: E-W
Address range: 135 to 143
Westport Dr
Length: 0.10 miles
Direction: E-W
Direction: E-W
Marina Way
Length: 0.10 miles
Direction: N-S
Address range: 200 to 299
Direction: N-S
Address range: 200 to 299
Pinehaven Way
Length: 0.09 miles
Direction: N-S
Address range: 200 to 299
Direction: N-S
Address range: 200 to 299
Pacific Heights Dr
Length: 0.09 miles
Directions: E-W, N-S
Directions: E-W, N-S
Lakeside Ave
Length: 0.09 miles
Direction: N-S
Direction: N-S
Outlook Heights Ct
Length: 0.08 miles
Directions: E-W, N-S, SE-NW
Directions: E-W, N-S, SE-NW
E Clarendon Rd
Length: 0.06 miles
Direction: E-W
Direction: E-W
Burns Ct
Length: 0.05 miles
Direction: N-S
Address range: 800 to 899
Direction: N-S
Address range: 800 to 899
Outlook Heights Dr
Length: 0.04 miles
Directions: N-S, SE-NW
Directions: N-S, SE-NW
Francisco Blvd
Length: 0.04 miles
Direction: SW-NE
Direction: SW-NE
Seaforth Ct
Length: 0.03 miles
Directions: N-S, SE-NW
Address range: 300 to 399
Directions: N-S, SE-NW
Address range: 300 to 399
Garden Ct
Length: 0.03 miles
Direction: N-S
Address range: 300 to 399
Direction: N-S
Address range: 300 to 399
Other features:
Laguna Salada
Length: 0.33 miles
Directions: E-W, N-S, SE-NW, SW-NE
Directions: E-W, N-S, SE-NW, SW-NE