Eastside Park neighborhood in Paterson, New Jersey (NJ), 07504 detailed profile
Settings
X

Business Search - 14 Million verified businesses
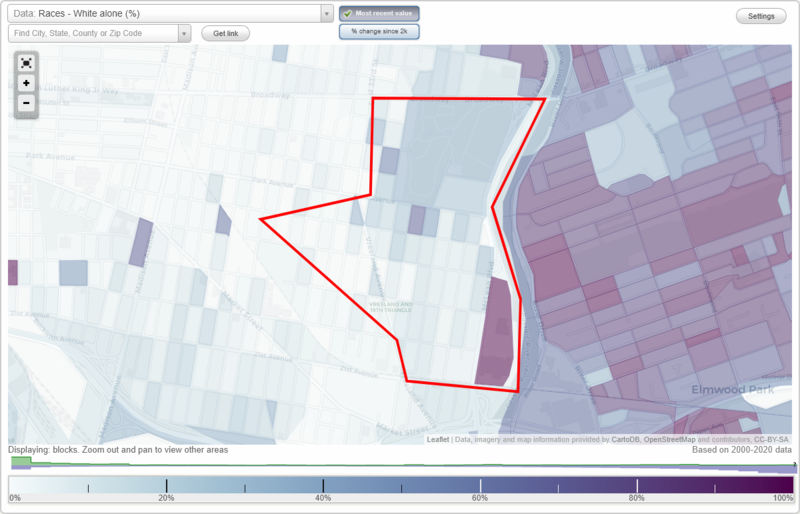
Area: 0.452 square miles
Population: 3,859
Population density:
| Eastside Park: | 8,531 people per square mile |
| Paterson: | 18,554 people per square mile |

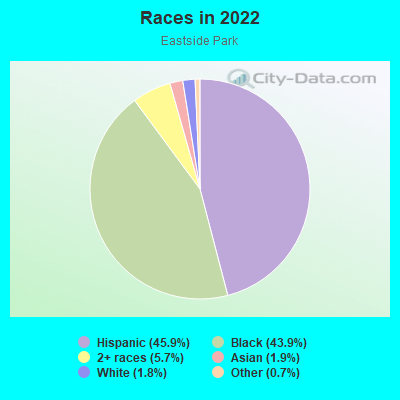
- 1,82245.9%Hispanic or Latino
- 1,74443.9%Black
- 2275.7%Two or more races
- 771.9%Asian
- 721.8%White
- 290.7%Some other race
Median household income in 2022:
| Eastside Park: | $111,885 |
| Paterson: | $47,373 |
Distribution of median household income
![Distribution of median household income]()
- 147Less than $10,000
- 91$10,000 to $19,999
- 136$20,000 to $29,999
- 145$30,000 to $39,999
- 74$40,000 to $49,999
- 74$50,000 to $59,999
- 147$60,000 to $74,999
- 164$75,000 to $99,999
- 103$100,000 to $124,999
- 116$125,000 to $149,999
- 231$150,000 to $199,999
- 210$200,000 or more

Distribution of owner-occupied house/condo value
![Distribution of owner-occupied house/condo value]()
- 28Less than $50,000
- 87$50,000 to $99,999
- 3$100,000 to $149,999
- 11$150,000 to $199,999
- 58$200,000 to $249,999
- 198$250,000 to $299,999
- 299$300,000 to $399,999
- 195$400,000 to $499,999
- 78$500,000 to $749,999
- 154$750,000 to $999,999
- 10$1,000,000 or more

Distribution of rent paid by renters
![Distribution of rent paid by renters]()
- 21$200 to $299
- 13$300 to $399
- 15$500 to $599
- 22$600 to $699
- 7$800 to $899
- 10$900 to $999
- 68$1,000 to $1,249
- 96$1,250 to $1,499
- 115$1,500 to $1,999
- 119$2,000 or more

Median rent in 2022:
| Eastside Park: | $1,474 |
| Paterson: | $1,227 |
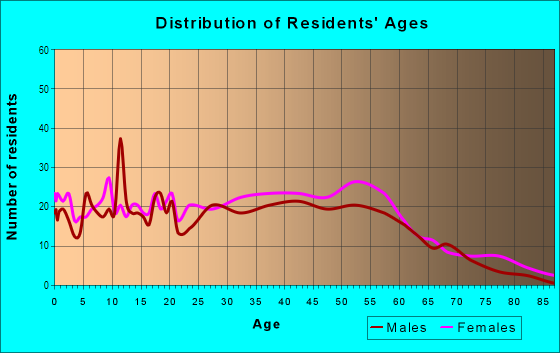
| Males: | 1,672 |
| Females: | 2,187 |
Males:
| This neighborhood: | 42.4 years |
| Whole city: | 33.1 years |
| This neighborhood: | 40.8 years |
| Whole city: | 33.3 years |
Average household size:
| Eastside Park: | 6.8 people |
| Paterson: | 3.1 people |
Percentage of family households:
| Eastside Park: | 59.4% |
| Paterson: | 48.8% |
| Here: | 40.4% |
| Paterson: | 31.0% |
Percentage of married-couple families with children (among all households):
| Eastside Park: | 17.0% |
| Paterson: | 16.3% |
Percentage of single-mother households (among all households):
| Eastside Park: | 14.6% |
| Paterson: | 13.4% |
Percentage of never married males 15 years old and over:
Percentage of never married females 15 years old and over:
| Eastside Park: | 21.7% |
| Paterson: | 24.4% |
Percentage of never married females 15 years old and over:
| Eastside Park: | 23.2% |
| city: | 24.1% |
Percentage of people that speak English not well or not at all:
| Eastside Park: | 16.1% |
| Paterson: | 24.5% |
Percentage of people born in this state:
Percentage of people born in another U.S. state:
Percentage of native residents but born outside the U.S.:
Percentage of foreign born residents:
| Here: | 52.5% |
| Paterson: | 42.9% |
Percentage of people born in another U.S. state:
| Eastside Park: | 13.5% |
| Paterson: | 11.0% |
Percentage of native residents but born outside the U.S.:
| Here: | 2.2% |
| city: | 4.8% |
Percentage of foreign born residents:
| Here: | 31.8% |
| Paterson: | 41.3% |
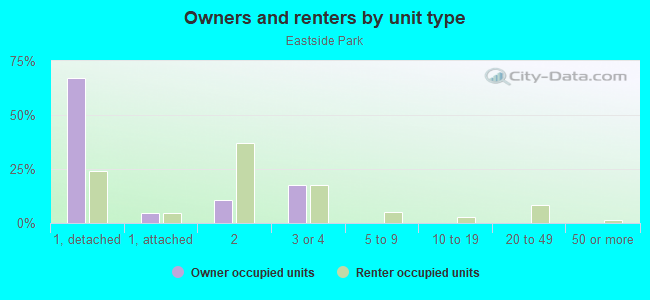
Owner-occupied
Renter-occupied

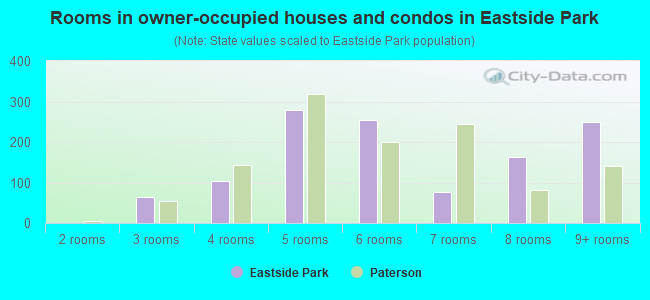
- Rooms in owner-occupied houses and condos in Eastside Park
- 01 room
- 02 rooms
- 643 rooms
- 1044 rooms
- 2805 rooms
- 2546 rooms
- 777 rooms
- 1638 rooms
- 2499+ rooms
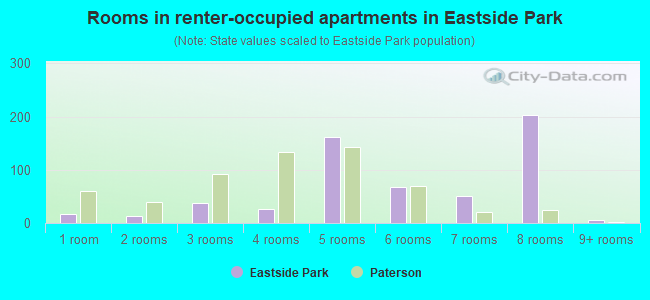
- Rooms in renter-occupied apartments in Eastside Park
- 161 room
- 132 rooms
- 383 rooms
- 274 rooms
- 1615 rooms
- 676 rooms
- 517 rooms
- 2038 rooms
- 59+ rooms
Owner-occupied
Renter-occupied
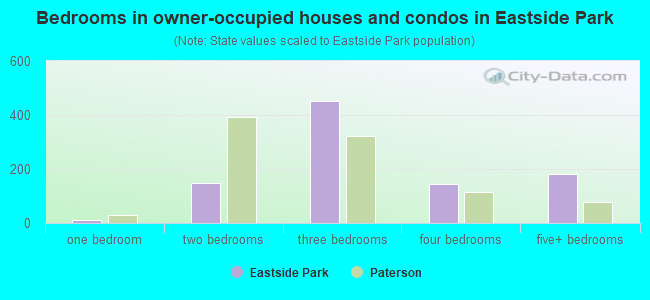
- Bedrooms in owner-occupied houses and condos in Eastside Park
- 0no bedroom
- 111 bedroom
- 1502 bedrooms
- 4533 bedrooms
- 1434 bedrooms
- 1835+ bedrooms
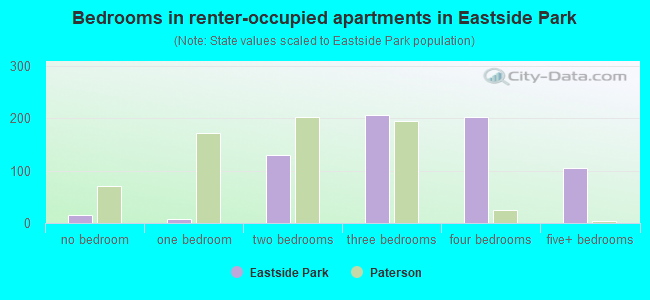
- Bedrooms in renter-occupied apartments in Eastside Park
- 16no bedroom
- 81 bedroom
- 1292 bedrooms
- 2063 bedrooms
- 2034 bedrooms
- 1045+ bedrooms
Average number of cars or other vehicles available in houses/condos:
Average number of cars or other vehicles available in apartments:
| This neighborhood: | 2.2 |
| Paterson: | 1.9 |
Average number of cars or other vehicles available in apartments:
| Here: | 1.5 |
| city: | 0.9 |
Percentage of units with a mortgage:
| Eastside Park: | 69.2% |
| Paterson: | 67.2% |
Average estimated value of detached houses in 2022 (70.6% of all units):
| Eastside Park: | $447,411 |
| Paterson: | $336,232 |
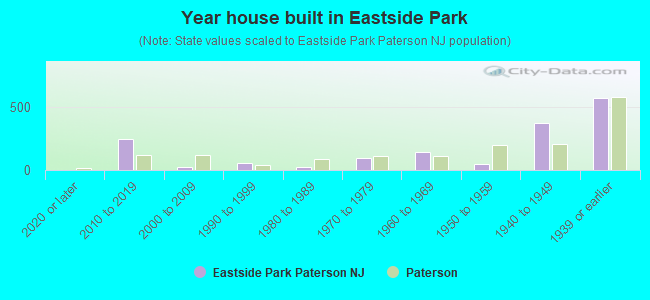
- Year house built in Eastside Park
- 02020 or later
- 2502010 to 2019
- 252000 to 2009
- 571990 to 1999
- 201980 to 1989
- 961970 to 1979
- 1431960 to 1969
- 501950 to 1959
- 3741940 to 1949
- 5711939 or earlier
City-data.com crime index for city in 2020 (higher means more crime):
| City: | 359.6 |
| U.S. average: | 219.5 |
Travel time to work (commute)
![Travel time to work (commute)]()
- 32Less than 5 minutes
- 1055 to 9 minutes
- 14410 to 14 minutes
- 18915 to 19 minutes
- 14620 to 24 minutes
- 10225 to 29 minutes
- 11630 to 34 minutes
- 435 to 39 minutes
- 7640 to 44 minutes
- 8445 to 59 minutes
- 6160 to 89 minutes
- 590 or more minutes

Means of transportation to work
![Means of transportation to work]()
- 79.3%1,252Drove a car alone
- 6.2%98Carpooled
- 8.6%136Bus
- 2.0%32Long-distance train or commuter rail
- 1.0%16Taxi
- 5.2%82Bicycle
- 25.7%406Walked
- 1.8%29Other means
- 4.9%77Worked at home

Time leaving home to go to work
![Time leaving home to go to work]()
- 2812:00 a.m. to 4:59 a.m.
- 85:00 a.m. to 5:29 a.m.
- 625:30 a.m. to 5:59 a.m.
- 976:00 a.m. to 6:29 a.m.
- 2116:30 a.m. to 6:59 a.m.
- 1427:00 a.m. to 7:29 a.m.
- 1707:30 a.m. to 7:59 a.m.
- 1608:00 a.m. to 8:29 a.m.
- 278:30 a.m. to 8:59 a.m.
- 129:00 a.m. to 9:59 a.m.
- 4510:00 a.m. to 10:59 a.m.
- 411:00 a.m. to 11:59 a.m.
- 8112:00 p.m. to 3:59 p.m.
- 704:00 p.m. to 11:59 p.m.

Occupations of males:
- Percentage of males in management occupations (except farmers):
Here: 17.5% city: 5.2%
- Percentage of males in business and financial operations occupations:
Here: 9.5% city: 2.1%
- Percentage of males in community and social services occupations:
Here: 11.3% city: 0.9%
- Percentage of males in education, training, and library occupations:
Here: 8.1% city: 1.2%
- Percentage of males in service occupations:
Here: 4.8% city: 17.1%
- Percentage of males in sales and office occupations:
Here: 15.2% city: 15.3%
- Percentage of males in construction, extraction, and maintenance occupations:
Here: 2.0% city: 10.5%
- Percentage of males in production occupations:
Here: 4.7% city: 14.8%
- Percentage of males in transportation occupations:
Here: 12.3% city: 12.6%
- Percentage of males in material moving occupations:
Here: 3.7% city: 10.2%
Occupations of females:
- Percentage of females in management occupations (except farmers):
Here: 10.2% city: 4.3%
- Percentage of females in education, training, and library occupations:
Here: 9.7% city: 5.1%
- Percentage of females in arts, design, entertainment, sports, and media occupations:
Here: 8.7% city: 0.3%
- Percentage of females in healthcare practitioners and technical occupations:
Here: 1.9% city: 5.0%
- Percentage of females in service occupations:
Here: 18.0% city: 29.3%
- Percentage of females in sales and office occupations:
Here: 27.2% city: 28.3%
- Percentage of females in construction, extraction, and maintenance occupations:
Here: 1.2% city: 0.2%
- Percentage of females in production occupations:
Here: 13.9% city: 11.3%
- Percentage of females in transportation occupations:
Here: 9.2% city: 3.0%
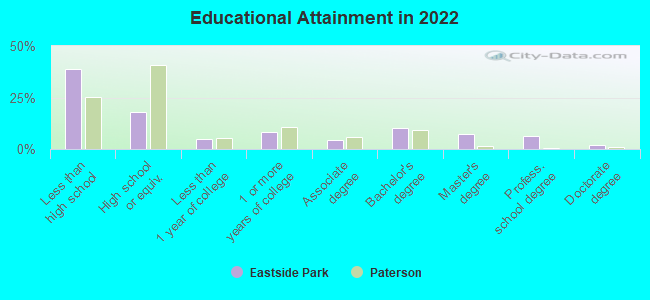
Education in this neighborhood (subdivision or community):
- Percentage of people 3 years and older in K-12 schools:
Eastside Park: 36.4% Paterson: 21.2%
- Percentage of people 3 years and older in undergraduate colleges:
Eastside Park: 10.9% Paterson: 5.7%
- Percentage of people 3 years and older in grad. or professional schools:
Eastside Park: 2.7% Paterson: 0.6%
- Percentage of students K-12 enrolled in private schools:
Eastside Park: 17.7% Paterson: 2.9%
Percentage of population below poverty level:
| Eastside Park: | 17.4% |
| Paterson: | 21.1% |
Median year owner moved in (as recorded in 2022):
| Eastside Park: | 2004 |
| Paterson: | 2009 |
Percentage of married-couple families with both working:
| Eastside Park: | 211.7% |
| Paterson: | 39.8% |
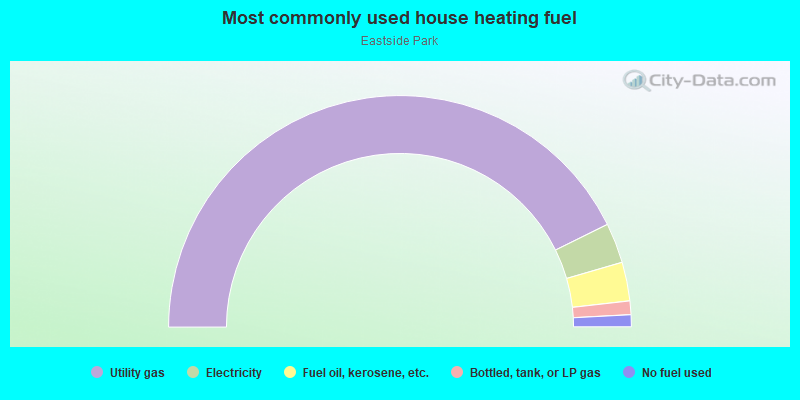
- 85.4%Utility gas
- 5.6%Electricity
- 5.4%Fuel oil, kerosene, etc.
- 1.9%Bottled, tank, or LP gas
- 1.7%No fuel used
Highways in this neighborhood:
McLean Blvd (State Rte 20)
Length: 1.45 miles
Directions: N-S, SW-NE
Address range: 146 to 200
Directions: N-S, SW-NE
Address range: 146 to 200
McLean Blvd (State Rte 20, E 43rd St)
Length: 0.37 miles
Direction: N-S
Address range: 199 to 360
Direction: N-S
Address range: 199 to 360
Roads and streets:
Park Ave
Length: 0.57 miles
Direction: E-W
Address range: 531 to 710
Direction: E-W
Address range: 531 to 710
17th Ave
Length: 0.57 miles
Direction: E-W
Address range: 351 to 533
Direction: E-W
Address range: 351 to 533
E 41st St
Length: 0.56 miles
Direction: N-S
Address range: 291 to 538
Direction: N-S
Address range: 291 to 538
E 39th St
Length: 0.56 miles
Directions: N-S, SW-NE
Address range: 293 to 539
Directions: N-S, SW-NE
Address range: 293 to 539
E 40th St
Length: 0.55 miles
Direction: N-S
Address range: 295 to 542
Direction: N-S
Address range: 295 to 542
E 42nd St
Length: 0.49 miles
Directions: N-S, SW-NE
Address range: 289 to 527
Directions: N-S, SW-NE
Address range: 289 to 527
E 38th St
Length: 0.45 miles
Direction: N-S
Address range: 291 to 498
Direction: N-S
Address range: 291 to 498
18th Ave
Length: 0.45 miles
Direction: E-W
Address range: 322 to 488
Direction: E-W
Address range: 322 to 488
19th Ave
Length: 0.39 miles
Direction: E-W
Address range: 338 to 499
Direction: E-W
Address range: 338 to 499
E 37th St
Length: 0.33 miles
Direction: N-S
Address range: 289 to 429
Direction: N-S
Address range: 289 to 429
20th Ave
Length: 0.32 miles
Direction: E-W
Address range: 677 to 782
Direction: E-W
Address range: 677 to 782
Wall Ave
Length: 0.27 miles
Direction: N-S
Address range: 179 to 299
Direction: N-S
Address range: 179 to 299
Derrom Ave
Length: 0.27 miles
Direction: N-S
Address range: 168 to 281
Direction: N-S
Address range: 168 to 281
Overlook Ave
Length: 0.20 miles
Direction: E-W
Address range: 1 to 60
Direction: E-W
Address range: 1 to 60
E 36th St
Length: 0.20 miles
Direction: N-S
Address range: 287 to 365
Direction: N-S
Address range: 287 to 365
21st Ave
Length: 0.19 miles
Direction: E-W
Direction: E-W
E Park Dr
Length: 0.17 miles
Direction: SW-NE
Address range: 1 to 61
Direction: SW-NE
Address range: 1 to 61
15th Ave
Length: 0.16 miles
Direction: E-W
Address range: 509 to 568
Direction: E-W
Address range: 509 to 568
14th Ave
Length: 0.12 miles
Direction: E-W
Address range: 783 to 818
Direction: E-W
Address range: 783 to 818
Vreeland Ave (Passaic County 651)
Length: 0.11 miles
Direction: N-S
Direction: N-S
E 35th St
Length: 0.10 miles
Direction: N-S
Address range: 285 to 331
Direction: N-S
Address range: 285 to 331
E 33rd St (Passaic County 651 II)
Length: 0.09 miles
Direction: N-S
Address range: 272 to 312
Direction: N-S
Address range: 272 to 312
E 34th St
Length: 0.09 miles
Direction: N-S
Address range: 291 to 338
Direction: N-S
Address range: 291 to 338
13th Ave
Length: 0.08 miles
Direction: E-W
Address range: 87 to 118
Direction: E-W
Address range: 87 to 118
Railroad features:
New York Susquehanna and Western Rlwy
Length: 0.39 miles
Direction: E-W
Direction: E-W