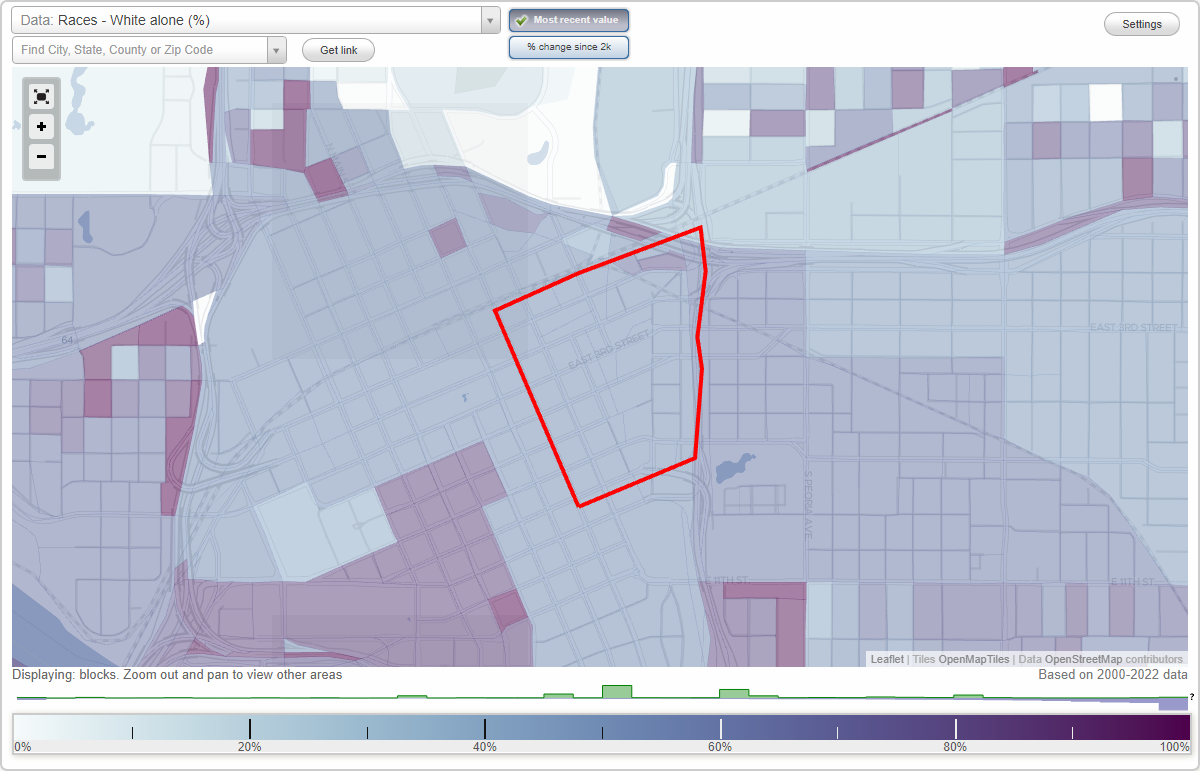
East Village District neighborhood in Tulsa, Oklahoma (OK), 74120 detailed profile
Settings
X

Business Search - 14 Million verified businesses
Area: 0.217 square miles
Population: 265
Population density:
| East Village District: | 1,219 people per square mile |
| Tulsa: | 2,262 people per square mile |

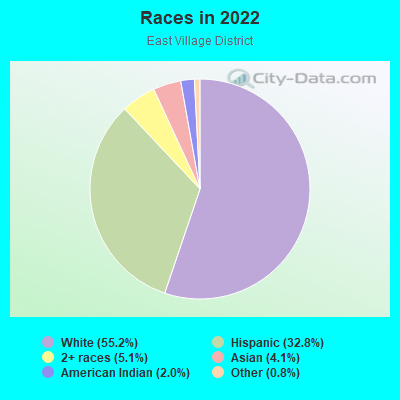
- 21755.2%White
- 12932.8%Hispanic or Latino
- 205.1%Two or more races
- 164.1%Asian
- 82.0%American Indian
- 30.8%Some other race
Median household income in 2022:
| East Village District: | $57,816 |
| Tulsa: | $54,040 |
Distribution of median household income
![Distribution of median household income]()
- 13Less than $10,000
- 10$10,000 to $19,999
- 12$20,000 to $29,999
- 21$30,000 to $39,999
- 21$40,000 to $49,999
- 20$50,000 to $59,999
- 23$60,000 to $74,999
- 28$75,000 to $99,999
- 10$100,000 to $124,999
- 16$125,000 to $149,999
- 2$150,000 to $199,999
- 22$200,000 or more

Distribution of owner-occupied house/condo value
![Distribution of owner-occupied house/condo value]()
- 15Less than $50,000
- 32$50,000 to $99,999
- 3$100,000 to $149,999
- 4$150,000 to $199,999

Distribution of rent paid by renters
![Distribution of rent paid by renters]()
- 1Less than $100
- 10$200 to $299
- 2$300 to $399
- 8$400 to $499
- 12$500 to $599
- 5$600 to $699
- 5$700 to $799
- 29$800 to $899
- 12$900 to $999
- 48$1,000 to $1,249
- 39$1,250 to $1,499
- 18$1,500 to $1,999
- 25$2,000 or more

Median rent in 2022:
| East Village District: | $1,181 |
| Tulsa: | $802 |
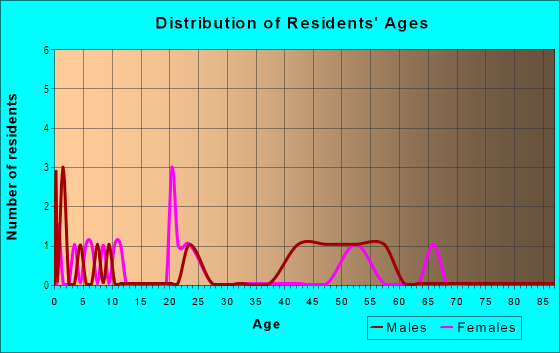
| Males: | 166 |
| Females: | 98 |
Males:
| This neighborhood: | 32.4 years |
| Whole city: | 34.8 years |
| This neighborhood: | 39.6 years |
| Whole city: | 36.7 years |
Average household size:
| East Village District: | 2.0 people |
| Tulsa: | 2.3 people |
Percentage of family households:
| East Village District: | 14.7% |
| Tulsa: | 40.9% |
| Here: | 11.5% |
| Tulsa: | 36.4% |
Percentage of married-couple families with children (among all households):
| East Village District: | 69.1% |
| Tulsa: | 26.0% |
Percentage of single-mother households (among all households):
| East Village District: | 217.7% |
| Tulsa: | 13.4% |
Percentage of never married males 15 years old and over:
Percentage of never married females 15 years old and over:
| East Village District: | 42.3% |
| Tulsa: | 19.4% |
Percentage of never married females 15 years old and over:
| East Village District: | 20.7% |
| city: | 17.6% |
Percentage of people that speak English not well or not at all:
| East Village District: | 0.0% |
| Tulsa: | 5.0% |
Percentage of people born in this state:
Percentage of people born in another U.S. state:
Percentage of native residents but born outside the U.S.:
Percentage of foreign born residents:
| Here: | 51.7% |
| Tulsa: | 55.7% |
Percentage of people born in another U.S. state:
| East Village District: | 37.1% |
| Tulsa: | 31.1% |
Percentage of native residents but born outside the U.S.:
| Here: | 1.8% |
| city: | 1.3% |
Percentage of foreign born residents:
| Here: | 9.3% |
| Tulsa: | 11.8% |
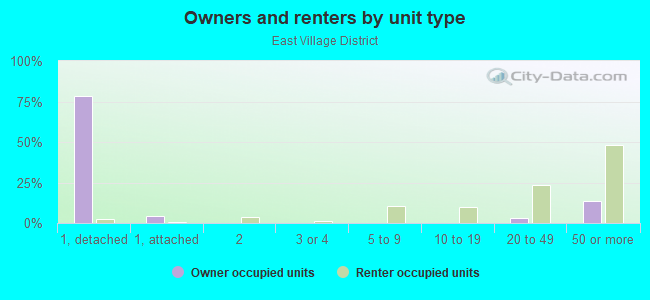
Owner-occupied
Renter-occupied

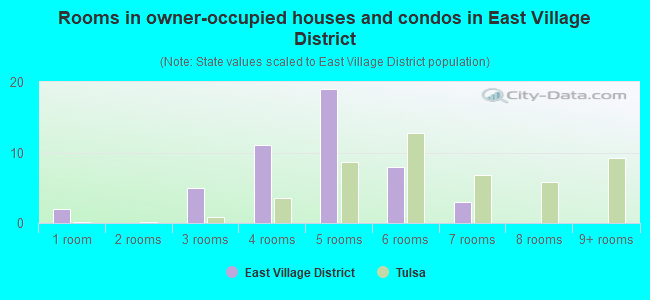
- Rooms in owner-occupied houses and condos in East Village District
- 21 room
- 02 rooms
- 53 rooms
- 114 rooms
- 195 rooms
- 86 rooms
- 37 rooms
- 08 rooms
- 09+ rooms
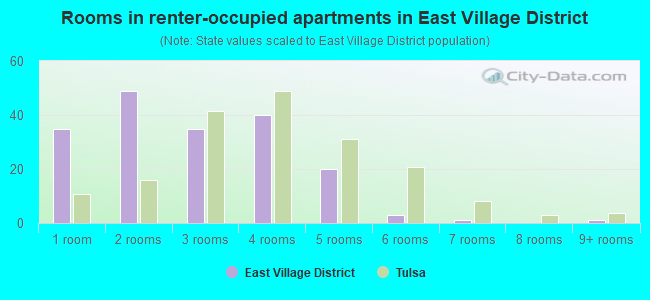
- Rooms in renter-occupied apartments in East Village District
- 351 room
- 492 rooms
- 353 rooms
- 404 rooms
- 205 rooms
- 36 rooms
- 17 rooms
- 08 rooms
- 19+ rooms
Owner-occupied
Renter-occupied
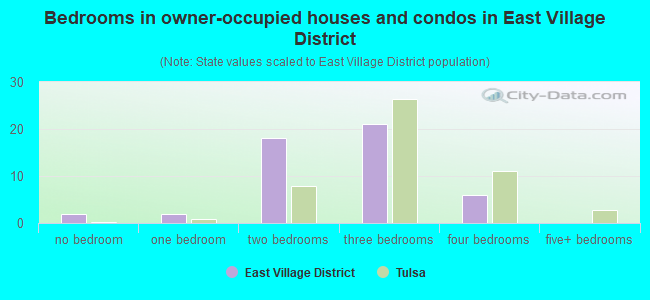
- Bedrooms in owner-occupied houses and condos in East Village District
- 2no bedroom
- 21 bedroom
- 182 bedrooms
- 213 bedrooms
- 64 bedrooms
- 05+ bedrooms
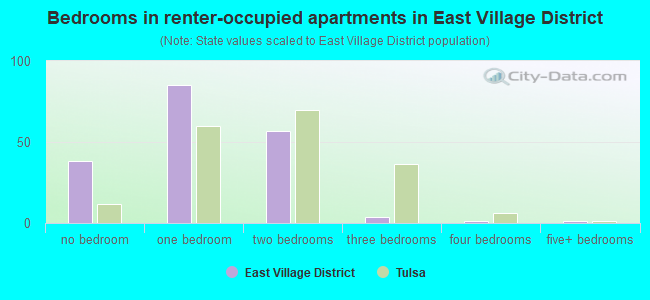
- Bedrooms in renter-occupied apartments in East Village District
- 38no bedroom
- 851 bedroom
- 572 bedrooms
- 43 bedrooms
- 14 bedrooms
- 15+ bedrooms
Average number of cars or other vehicles available in houses/condos:
Average number of cars or other vehicles available in apartments:
| This neighborhood: | |
| Tulsa: |
Average number of cars or other vehicles available in apartments:
| Here: | 1.1 |
| city: | 1.3 |
Percentage of units with a mortgage:
| East Village District: | 33.2% |
| Tulsa: | 57.3% |
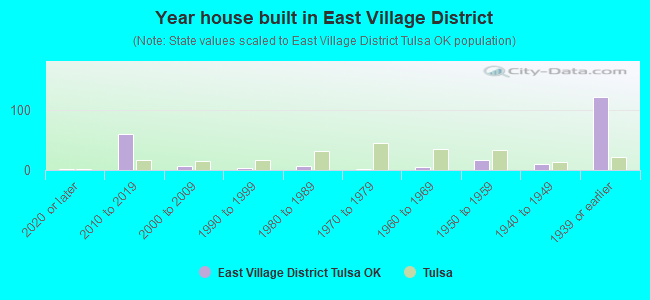
- Year house built in East Village District
- 22020 or later
- 602010 to 2019
- 62000 to 2009
- 31990 to 1999
- 61980 to 1989
- 11970 to 1979
- 51960 to 1969
- 171950 to 1959
- 101940 to 1949
- 1221939 or earlier
Travel time to work (commute)
![Travel time to work (commute)]()
- 13Less than 5 minutes
- 415 to 9 minutes
- 2410 to 14 minutes
- 2815 to 19 minutes
- 920 to 24 minutes
- 1125 to 29 minutes
- 530 to 34 minutes
- 545 to 59 minutes
- 460 to 89 minutes
- 290 or more minutes

Means of transportation to work
![Means of transportation to work]()
- 59.8%125Drove a car alone
- 7.2%15Carpooled
- 1.4%3Bus
- 1.0%2Bicycle
- 13.9%29Walked
- 15.8%33Worked at home

Time leaving home to go to work
![Time leaving home to go to work]()
- 312:00 a.m. to 4:59 a.m.
- 25:00 a.m. to 5:29 a.m.
- 46:00 a.m. to 6:29 a.m.
- 76:30 a.m. to 6:59 a.m.
- 217:00 a.m. to 7:29 a.m.
- 247:30 a.m. to 7:59 a.m.
- 218:00 a.m. to 8:29 a.m.
- 268:30 a.m. to 8:59 a.m.
- 139:00 a.m. to 9:59 a.m.
- 210:00 a.m. to 10:59 a.m.
- 111:00 a.m. to 11:59 a.m.
- 412:00 p.m. to 3:59 p.m.
- 104:00 p.m. to 11:59 p.m.

Occupations of males:
- Percentage of males in management occupations (except farmers):
Here: 18.0% city: 10.6%
- Percentage of males in business and financial operations occupations:
Here: 11.1% city: 4.9%
- Percentage of males in computer and mathematical occupations:
Here: 8.4% city: 3.7%
- Percentage of males in architecture and engineering occupations:
Here: 10.3% city: 3.1%
- Percentage of males in legal occupations:
Here: 1.4% city: 1.6%
- Percentage of males in education, training, and library occupations:
Here: 3.5% city: 3.0%
- Percentage of males in arts, design, entertainment, sports, and media occupations:
Here: 11.0% city: 2.0%
- Percentage of males in healthcare practitioners and technical occupations:
Here: 9.6% city: 4.0%
- Percentage of males in service occupations:
Here: 5.5% city: 13.9%
- Percentage of males in sales and office occupations:
Here: 17.7% city: 15.7%
- Percentage of males in construction, extraction, and maintenance occupations:
Here: 1.4% city: 10.8%
- Percentage of males in material moving occupations:
Here: 3.5% city: 5.5%
Occupations of females:
- Percentage of females in management occupations (except farmers):
Here: 26.1% city: 8.3%
- Percentage of females in business and financial operations occupations:
Here: 9.3% city: 6.3%
- Percentage of females in life, physical, and social science occupations:
Here: 2.6% city: 0.6%
- Percentage of females in community and social services occupations:
Here: 22.0% city: 2.6%
- Percentage of females in legal occupations:
Here: 9.0% city: 1.7%
- Percentage of females in arts, design, entertainment, sports, and media occupations:
Here: 12.5% city: 2.3%
- Percentage of females in healthcare practitioners and technical occupations:
Here: 9.0% city: 9.2%
- Percentage of females in service occupations:
Here: 4.5% city: 21.8%
- Percentage of females in sales and office occupations:
Here: 5.1% city: 28.9%
Percentage of people 16-64 in Armed Forces:
| East Village District: | 0.3% |
| Tulsa: | 0.2% |
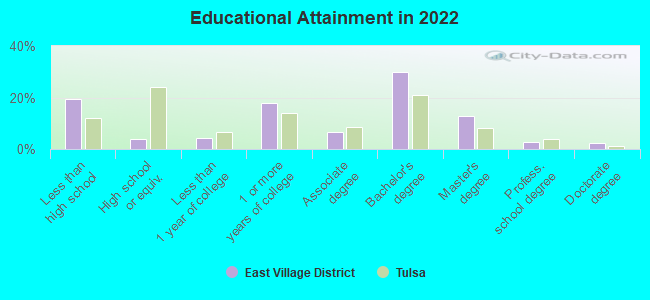
Education in this neighborhood (subdivision or community):
- Percentage of people 3 years and older in K-12 schools:
East Village District: 15.8% Tulsa: 17.8%
- Percentage of people 3 years and older in undergraduate colleges:
East Village District: 8.9% Tulsa: 4.7%
- Percentage of people 3 years and older in grad. or professional schools:
East Village District: 6.9% Tulsa: 1.5%
- Percentage of students K-12 enrolled in private schools:
East Village District: 12.2% Tulsa: 15.2%
Percentage of population below poverty level:
| East Village District: | 22.2% |
| Tulsa: | 20.0% |
Percentage of married-couple families with both working:
| East Village District: | 82.2% |
| Tulsa: | 66.7% |
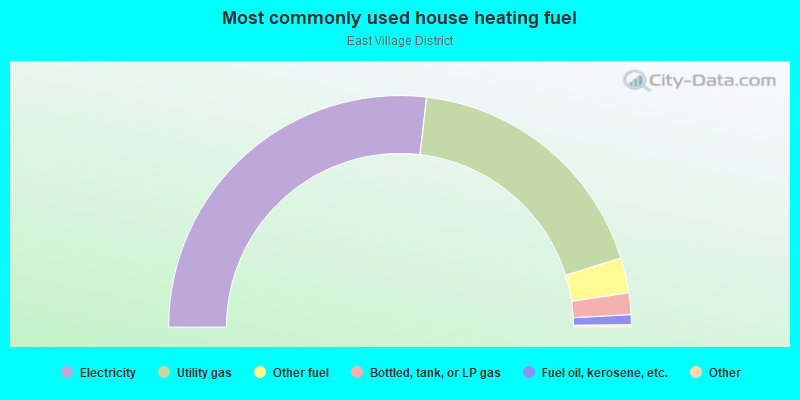
- 53.7%Electricity
- 36.7%Utility gas
- 4.9%Other fuel
- 3.0%Bottled, tank, or LP gas
- 1.4%Fuel oil, kerosene, etc.
Limited-access highways (interstate or state) in this neighborhood:
Crosstown Expy (I- 244, US Hwy 412)
Length: 0.17 miles
Direction: E-W
Direction: E-W
Highways in this neighborhood:
US Hwy 75
Length: 0.70 miles
Direction: N-S
Direction: N-S
US Hwy 75 (Cherokee Expy)
Length: 0.10 miles
Directions: N-S, SE-NW
Directions: N-S, SE-NW
Roads and streets:
E 2nd St
Length: 0.52 miles
Directions: E-W, N-S
Address range: 400 to 999
Directions: E-W, N-S
Address range: 400 to 999
E 4th St
Length: 0.46 miles
Directions: E-W, SW-NE
Address range: 400 to 912
Directions: E-W, SW-NE
Address range: 400 to 912
S Elgin Ave
Length: 0.45 miles
Direction: SE-NW
Address range: 100 to 699
Direction: SE-NW
Address range: 100 to 699
E 1st St
Length: 0.45 miles
Direction: E-W
Address range: 400 to 898
Direction: E-W
Address range: 400 to 898
S Lansing Ave
Length: 0.44 miles
Direction: N-S
Address range: 100 to 699
Direction: N-S
Address range: 100 to 699
E 3rd St
Length: 0.44 miles
Directions: E-W, SW-NE
Address range: 400 to 912
Directions: E-W, SW-NE
Address range: 400 to 912
S Frankfort Ave
Length: 0.41 miles
Direction: SE-NW
Address range: 50 to 699
Direction: SE-NW
Address range: 50 to 699
S Kenosha Ave
Length: 0.40 miles
Direction: N-S
Address range: 200 to 699
Direction: N-S
Address range: 200 to 699
E 6th St
Length: 0.32 miles
Direction: E-W
Address range: 500 to 912
Direction: E-W
Address range: 500 to 912
E 5th St
Length: 0.31 miles
Direction: E-W
Address range: 400 to 899
Direction: E-W
Address range: 400 to 899
E 7th St
Length: 0.15 miles
Direction: E-W
Address range: 400 to 799
Direction: E-W
Address range: 400 to 799
S Hartford Ave
Length: 0.14 miles
Direction: SE-NW
Address range: 100 to 299
Direction: SE-NW
Address range: 100 to 299
S Greenwood Ave
Length: 0.14 miles
Direction: SE-NW
Address range: 168 to 299
Direction: SE-NW
Address range: 168 to 299
E 1st Pl
Length: 0.14 miles
Directions: E-W, SW-NE
Address range: 100 to 899
Directions: E-W, SW-NE
Address range: 100 to 899
E Admiral Blvd
Length: 0.09 miles
Direction: E-W
Address range: 700 to 799
Direction: E-W
Address range: 700 to 799
E 5th Pl (W 5th Pl)
Length: 0.08 miles
Direction: E-W
Address range: 800 to 899
Direction: E-W
Address range: 800 to 899
S Iroquois Ave
Length: 0.03 miles
Direction: SE-NW
Address range: 1 to 99
Direction: SE-NW
Address range: 1 to 99
Railroad features:
Midland Valley RR
Length: 1.55 miles
Directions: E-W, N-S, SE-NW, SW-NE
Directions: E-W, N-S, SE-NW, SW-NE
Missouri-Kansas-Texas RR
Length: 0.58 miles
Directions: E-W, N-S, SE-NW, SW-NE
Directions: E-W, N-S, SE-NW, SW-NE