Downtown San Bruno (Downtown) neighborhood in San Bruno, California (CA), 94066 detailed profile
Settings
X


Business Search - 14 Million verified businesses
Area: 0.323 square miles
Population: 2,047
Population density:
| Downtown San Bruno (Downtown): | 6,336 people per square mile |
| San Bruno: | 7,913 people per square mile |

- 79933.1%White
- 58124.1%Hispanic or Latino
- 49520.5%Asian
- 1656.8%Native Hawaiian and Other
Pacific Islander - 1215.0%Two or more races
- 1144.7%Black
- 913.8%Some other race
- 492.0%American Indian

Median household income in 2022:
| Downtown San Bruno (Downtown): | $144,694 |
| San Bruno: | $131,669 |
Distribution of median household income
![Distribution of median household income]()
- 28Less than $10,000
- 130$10,000 to $19,999
- 149$20,000 to $29,999
- 98$30,000 to $39,999
- 96$40,000 to $49,999
- 52$50,000 to $59,999
- 39$60,000 to $74,999
- 114$75,000 to $99,999
- 64$100,000 to $124,999
- 92$125,000 to $149,999
- 180$150,000 to $199,999
- 236$200,000 or more

Distribution of owner-occupied house/condo value
![Distribution of owner-occupied house/condo value]()
- 50Less than $50,000
- 107$50,000 to $99,999
- 9$100,000 to $149,999
- 32$150,000 to $199,999
- 61$200,000 to $249,999
- 93$300,000 to $399,999
- 47$400,000 to $499,999
- 45$500,000 to $749,999
- 116$750,000 to $999,999
- 562$1,000,000 or more

Distribution of rent paid by renters
![Distribution of rent paid by renters]()
- 17$100 to $199
- 4$500 to $599
- 1$600 to $699
- 18$700 to $799
- 17$900 to $999
- 87$1,000 to $1,249
- 17$1,250 to $1,499
- 28$1,500 to $1,999
- 231$2,000 or more

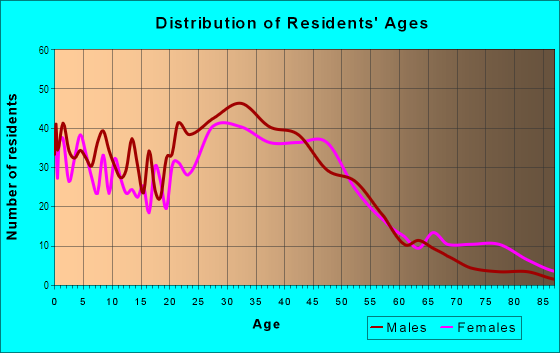
| Males: | 984 |
| Females: | 1,063 |
Males:
| This neighborhood: | 35.9 years |
| Whole city: | 36.8 years |
| This neighborhood: | 39.6 years |
| Whole city: | 41.6 years |
Average household size:
| Downtown San Bruno (Downtown): | 3.2 people |
| San Bruno: | 2.8 people |
Percentage of family households:
| Downtown San Bruno (Downtown): | 45.2% |
| San Bruno: | 45.6% |
| Here: | 64.4% |
| San Bruno: | 52.4% |
Percentage of married-couple families with children (among all households):
| Downtown San Bruno (Downtown): | 34.7% |
| San Bruno: | 27.4% |
Percentage of single-mother households (among all households):
| Downtown San Bruno (Downtown): | 12.1% |
| San Bruno: | 5.2% |
Percentage of never married males 15 years old and over:
Percentage of never married females 15 years old and over:
| Downtown San Bruno (Downtown): | 14.6% |
| San Bruno: | 20.4% |
Percentage of never married females 15 years old and over:
| Downtown San Bruno (Downtown): | 14.5% |
| city: | 15.1% |
Percentage of people that speak English not well or not at all:
| Downtown San Bruno (Downtown): | 4.3% |
| San Bruno: | 7.3% |
Percentage of people born in this state:
Percentage of people born in another U.S. state:
Percentage of native residents but born outside the U.S.:
Percentage of foreign born residents:
| Here: | 59.5% |
| San Bruno: | 53.6% |
Percentage of people born in another U.S. state:
| Downtown San Bruno (Downtown): | 9.3% |
| San Bruno: | 7.8% |
Percentage of native residents but born outside the U.S.:
| Here: | 2.3% |
| city: | 1.5% |
Percentage of foreign born residents:
| Here: | 28.8% |
| San Bruno: | 37.2% |

Owner-occupied
Renter-occupied


- Rooms in owner-occupied houses and condos in Downtown San Bruno <
> - 31 room
- 192 rooms
- 383 rooms
- 704 rooms
- 1105 rooms
- 2786 rooms
- 1327 rooms
- 588 rooms
- 639+ rooms

- Rooms in renter-occupied apartments in Downtown San Bruno <
> - 761 room
- 332 rooms
- 343 rooms
- 774 rooms
- 825 rooms
- 566 rooms
- 157 rooms
- 98 rooms
- 649+ rooms
Owner-occupied
Renter-occupied

- Bedrooms in owner-occupied houses and condos in Downtown San Bruno <
> - 3no bedroom
- 571 bedroom
- 1512 bedrooms
- 3253 bedrooms
- 944 bedrooms
- 255+ bedrooms

- Bedrooms in renter-occupied apartments in Downtown San Bruno <
> - 76no bedroom
- 581 bedroom
- 1252 bedrooms
- 243 bedrooms
- 614 bedrooms
- 05+ bedrooms
Average number of cars or other vehicles available in houses/condos:
Average number of cars or other vehicles available in apartments:
| This neighborhood: | 1.6 |
| San Bruno: | 2.2 |
Average number of cars or other vehicles available in apartments:
| Here: | 1.9 |
| city: | 1.6 |
Percentage of units with a mortgage:
| Downtown San Bruno (Downtown): | 63.4% |
| San Bruno: | 69.6% |
Average estimated value of detached houses in 2022 (87.6% of all units):
| Downtown San Bruno (Downtown): | $1,204,796 |
| California: | $988,808 |

- Year house built in Downtown San Bruno <
> - 892020 or later
- 602010 to 2019
- 432000 to 2009
- 351990 to 1999
- 231980 to 1989
- 281970 to 1979
- 681960 to 1969
- 1891950 to 1959
- 2611940 to 1949
- 3161939 or earlier

City-data.com crime index for city in 2020 (higher means more crime):
| City: | 177.8 |
| U.S. average: | 219.5 |
Travel time to work (commute)
![Travel time to work (commute)]()
- 42Less than 5 minutes
- 615 to 9 minutes
- 14010 to 14 minutes
- 13015 to 19 minutes
- 13620 to 24 minutes
- 5725 to 29 minutes
- 13530 to 34 minutes
- 1835 to 39 minutes
- 4940 to 44 minutes
- 9645 to 59 minutes
- 5060 to 89 minutes
- 1490 or more minutes

Means of transportation to work
![Means of transportation to work]()
- 58.3%614Drove a car alone
- 20.8%219Carpooled
- 8.6%90Bus
- 3.9%41Subway or elevated rail
- 2.9%31Long-distance train or commuter rail
- 0.2%2Taxi
- 5.5%58Motorcycle
- 4.6%48Walked
- 2.4%25Other means
- 13.5%142Worked at home

Time leaving home to go to work
![Time leaving home to go to work]()
- 4412:00 a.m. to 4:59 a.m.
- 495:00 a.m. to 5:29 a.m.
- 235:30 a.m. to 5:59 a.m.
- 576:00 a.m. to 6:29 a.m.
- 886:30 a.m. to 6:59 a.m.
- 987:00 a.m. to 7:29 a.m.
- 1337:30 a.m. to 7:59 a.m.
- 1128:00 a.m. to 8:29 a.m.
- 238:30 a.m. to 8:59 a.m.
- 929:00 a.m. to 9:59 a.m.
- 3510:00 a.m. to 10:59 a.m.
- 3911:00 a.m. to 11:59 a.m.
- 7512:00 p.m. to 3:59 p.m.
- 404:00 p.m. to 11:59 p.m.

Occupations of males:
- Percentage of males in management occupations (except farmers):
Here: 26.7% city: 12.7%
- Percentage of males in business and financial operations occupations:
Here: 1.6% city: 4.2%
- Percentage of males in computer and mathematical occupations:
Here: 16.2% city: 9.0%
- Percentage of males in architecture and engineering occupations:
Here: 1.0% city: 4.1%
- Percentage of males in life, physical, and social science occupations:
Here: 1.8% city: 2.6%
- Percentage of males in arts, design, entertainment, sports, and media occupations:
Here: 1.5% city: 1.7%
- Percentage of males in service occupations:
Here: 13.2% city: 17.6%
- Percentage of males in sales and office occupations:
Here: 13.1% city: 13.7%
- Percentage of males in farming, fishing, and forestry occupations:
Here: 1.8% city: 0.1%
- Percentage of males in construction, extraction, and maintenance occupations:
Here: 9.8% city: 9.3%
- Percentage of males in production occupations:
Here: 8.8% city: 5.4%
- Percentage of males in transportation occupations:
Here: 1.4% city: 5.9%
Occupations of females:
- Percentage of females in management occupations (except farmers):
Here: 10.4% city: 11.1%
- Percentage of females in business and financial operations occupations:
Here: 14.2% city: 10.4%
- Percentage of females in computer and mathematical occupations:
Here: 1.2% city: 3.0%
- Percentage of females in architecture and engineering occupations:
Here: 2.9% city: 0.4%
- Percentage of females in community and social services occupations:
Here: 1.3% city: 1.3%
- Percentage of females in education, training, and library occupations:
Here: 3.9% city: 5.5%
- Percentage of females in healthcare practitioners and technical occupations:
Here: 10.5% city: 9.0%
- Percentage of females in service occupations:
Here: 19.1% city: 20.3%
- Percentage of females in sales and office occupations:
Here: 21.7% city: 26.0%
- Percentage of females in production occupations:
Here: 4.1% city: 1.4%
- Percentage of females in material moving occupations:
Here: 6.2% city: 3.0%
Percentage of people 16-64 in Armed Forces:
| Downtown San Bruno (Downtown): | 0.2% |
| San Bruno: | 0.2% |
Education in this neighborhood (subdivision or community):
- Percentage of people 3 years and older in K-12 schools:
Downtown San Bruno (Downtown): 39.6% San Bruno: 13.8%
- Percentage of people 3 years and older in undergraduate colleges:
Downtown San Bruno (Downtown): 7.9% San Bruno: 6.2%
- Percentage of people 3 years and older in grad. or professional schools:
Downtown San Bruno (Downtown): 4.2% San Bruno: 1.4%
- Percentage of students K-12 enrolled in private schools:
Downtown San Bruno (Downtown): 28.0% San Bruno: 22.1%
Percentage of population below poverty level:
| Downtown San Bruno (Downtown): | 3.0% |
| San Bruno: | 5.6% |
Median year owner moved in (as recorded in 2022):
| Downtown San Bruno (Downtown): | 2006 |
| San Bruno: | 2003 |
Percentage of married-couple families with both working:
| Downtown San Bruno (Downtown): | 130.6% |
| San Bruno: | 80.8% |

- 44.6%Utility gas
- 37.1%Electricity
- 5.0%No fuel used
- 4.8%Bottled, tank, or LP gas
- 3.4%Wood
- 2.0%Solar energy
- 1.8%Other fuel
- 1.4%Fuel oil, kerosene, etc.
Highways in this neighborhood:
State Hwy 82 (el Camino Real)
Length: 0.94 miles
Directions: N-S, SE-NW
Directions: N-S, SE-NW
Roads and streets:
Huntington Ave
Length: 0.94 miles
Directions: N-S, SE-NW
Address range: 200 to 799
Directions: N-S, SE-NW
Address range: 200 to 799
San Mateo Ave
Length: 0.65 miles
Directions: N-S, SE-NW, SW-NE
Address range: 400 to 809
Directions: N-S, SE-NW, SW-NE
Address range: 400 to 809
Mastick Ave
Length: 0.63 miles
Directions: N-S, SE-NW, SW-NE
Address range: 200 to 599
Directions: N-S, SE-NW, SW-NE
Address range: 200 to 599
Linden Ave
Length: 0.53 miles
Direction: SE-NW
Address range: 300 to 631
Direction: SE-NW
Address range: 300 to 631
Angus Ave W
Length: 0.52 miles
Directions: E-W, SW-NE
Address range: 1 to 899
Directions: E-W, SW-NE
Address range: 1 to 899
1st Ave
Length: 0.44 miles
Directions: E-W, SE-NW
Address range: 500 to 799
Directions: E-W, SE-NW
Address range: 500 to 799
Hensley Ave
Length: 0.42 miles
Directions: E-W, SE-NW
Address range: 500 to 799
Directions: E-W, SE-NW
Address range: 500 to 799
San Bruno Ave W
Length: 0.42 miles
Direction: E-W
Address range: 100 to 849
Direction: E-W
Address range: 100 to 849
Green Ave (Green Dr)
Length: 0.42 miles
Direction: SE-NW
Address range: 500 to 799
Direction: SE-NW
Address range: 500 to 799
Easton Ave
Length: 0.40 miles
Direction: SE-NW
Address range: 501 to 799
Direction: SE-NW
Address range: 501 to 799
Kains Ave
Length: 0.36 miles
Directions: E-W, N-S, SW-NE
Address range: 100 to 747
Directions: E-W, N-S, SW-NE
Address range: 100 to 747
San Anselmo Ave N
Length: 0.34 miles
Directions: E-W, SE-NW
Address range: 200 to 499
Directions: E-W, SE-NW
Address range: 200 to 499
Milton Ave
Length: 0.33 miles
Direction: SE-NW
Address range: 200 to 499
Direction: SE-NW
Address range: 200 to 499
Sylvan Ave
Length: 0.33 miles
Directions: E-W, SW-NE
Address range: 100 to 599
Directions: E-W, SW-NE
Address range: 100 to 599
Masson Ave
Length: 0.29 miles
Direction: SE-NW
Address range: 600 to 799
Direction: SE-NW
Address range: 600 to 799
Jenevein Ave
Length: 0.28 miles
Directions: E-W, SW-NE
Address range: 500 to 899
Directions: E-W, SW-NE
Address range: 500 to 899
San Felipe Ave
Length: 0.27 miles
Direction: SW-NE
Address range: 100 to 598
Direction: SW-NE
Address range: 100 to 598
White Way
Length: 0.27 miles
Directions: E-W, SE-NW
Address range: 600 to 799
Directions: E-W, SE-NW
Address range: 600 to 799
Elm Ave
Length: 0.23 miles
Direction: SE-NW
Address range: 500 to 599
Direction: SE-NW
Address range: 500 to 599
Taylor Ave
Length: 0.22 miles
Directions: E-W, SE-NW, SW-NE
Address range: 300 to 599
Directions: E-W, SE-NW, SW-NE
Address range: 300 to 599
Chapman Ave
Length: 0.18 miles
Directions: N-S, SW-NE
Address range: 300 to 699
Directions: N-S, SW-NE
Address range: 300 to 699
Mills Ave
Length: 0.16 miles
Direction: SE-NW
Address range: 700 to 799
Direction: SE-NW
Address range: 700 to 799
East Ave
Length: 0.16 miles
Direction: SE-NW
Address range: 200 to 299
Direction: SE-NW
Address range: 200 to 299
Florida Ave
Length: 0.15 miles
Directions: E-W, N-S, SW-NE
Address range: 100 to 399
Directions: E-W, N-S, SW-NE
Address range: 100 to 399
Georgia Ave
Length: 0.15 miles
Directions: E-W, N-S, SW-NE
Address range: 100 to 399
Directions: E-W, N-S, SW-NE
Address range: 100 to 399
Poplar Ave
Length: 0.12 miles
Direction: SE-NW
Address range: 500 to 599
Direction: SE-NW
Address range: 500 to 599
Maryland Pl
Length: 0.12 miles
Directions: E-W, SE-NW
Address range: 1 to 99
Directions: E-W, SE-NW
Address range: 1 to 99
Layne Pl
Length: 0.11 miles
Directions: E-W, N-S, SE-NW
Address range: 1 to 99
Directions: E-W, N-S, SE-NW
Address range: 1 to 99
Camino Plz
Length: 0.11 miles
Directions: N-S, SE-NW
Address range: 700 to 799
Directions: N-S, SE-NW
Address range: 700 to 799
Terrace Ave
Length: 0.09 miles
Directions: E-W, N-S, SE-NW, SW-NE
Address range: 200 to 299
Directions: E-W, N-S, SE-NW, SW-NE
Address range: 200 to 299
Carlton Ave
Length: 0.09 miles
Directions: E-W, N-S, SE-NW, SW-NE
Address range: 200 to 299
Directions: E-W, N-S, SE-NW, SW-NE
Address range: 200 to 299
Martin Pl
Length: 0.08 miles
Directions: E-W, N-S
Address range: 100 to 199
Directions: E-W, N-S
Address range: 100 to 199
Memory Ln
Length: 0.07 miles
Direction: SW-NE
Address range: 1 to 199
Direction: SW-NE
Address range: 1 to 199
Kensington Ave
Length: 0.07 miles
Directions: E-W, SW-NE
Address range: 400 to 499
Directions: E-W, SW-NE
Address range: 400 to 499
Garden Ave
Length: 0.06 miles
Directions: N-S, SW-NE
Address range: 400 to 499
Directions: N-S, SW-NE
Address range: 400 to 499
Crystal Springs Rd
Length: 0.06 miles
Direction: SW-NE
Address range: 600 to 699
Direction: SW-NE
Address range: 600 to 699
Cypress Ct
Length: 0.06 miles
Direction: E-W
Address range: 1 to 99
Direction: E-W
Address range: 1 to 99
Texas Pl
Length: 0.05 miles
Direction: SW-NE
Address range: 300 to 399
Direction: SW-NE
Address range: 300 to 399
Cupid Row
Length: 0.05 miles
Direction: SW-NE
Address range: 100 to 199
Direction: SW-NE
Address range: 100 to 199
Railroad features:
Union Pacific RR
Length: 0.91 miles
Direction: SE-NW
Direction: SE-NW
Caltrain
Length: 0.19 miles
Direction: SE-NW
Direction: SE-NW